Research Article - (2022) Volume 10, Issue 11
Received: 01-Aug-2022, Manuscript No. JBES-22-70910;
Editor assigned: 04-Aug-2022, Pre QC No. JBES-22-70910(PQ);
Reviewed: 19-Aug-2022, QC No. JBES-22-70910;
Revised: 03-Oct-2022, Manuscript No. JBES-22-70910(R);
Published:
11-Oct-2022
, DOI: 10.37421/2332-2543.2022.10.457
Citation: Fikadu, Tolera. "The Effects of Tree Species
on Herbaceous Vegetation Composition, Distribution and Diversity in
Eastern Oromia, Ethiopia." J Biodivers Endanger Species 10 (2022) :
457.
Copyright: © 2022 Fikadu T. This is an open-access article distributed under the terms of the creative commons attribution license which permits unrestricted
use, distribution and reproduction in any medium, provided the original author and source are credited.
Sources of funding : © 2022 Fikadu T. This is an open-access article distributed under the terms of the creative commons attribution license which permits unrestricted use, distribution and reproduction in any medium, provided the original author and source are credited.
Background: The fast growing natures of conifer tree species and favorable economic returns from these trees have encouraged the conversion of natural grasslands in open forests into tree plantations in ethiopia. The dominant tree species used for this purpose were Podocarpus falcatus, Juniperus procera and Cupressus lusitanica. These tree species plantation is spreading rapidly in mountain, specially, open forest areas of eastern oromia. Therefore, in the current study, we evaluated the effects of these tree species on herbaceous plant composition, distribution and diversity. Data was collected under and outside canopies of each tree in four directions. Four quadrants for each canopy type used. Twenty trees selected from each tree species. Totally, 60 trees were selected purposively. Four quadrants for each canopy type used under and outside canopy of the tree.
Results: The present results showed that tree species had negatively effect on herbaceous plant distribution, composition and diversity where the whole parameters were significantly higher outside canopy than inside canopy cover. The values of IVI reported that the outside canopy was dominated by hyparrhenia rufa while under canopy cover was dominated by oplismenus compositus. Also the value of IVI showed that some of the herbaceous species were found in both canopy types while a few of them were found only inside or outside canopy of the tree species.
Conclusion: Our current study suggests that Podocarpus falcatus, Juniperus procera and Cupressus lusitanica tree species has negative effects on the grassland found in open forest. Therefore, management and monitoring of herbaceous vegetation of grassland found in open forest is crucial in keramile open forest, Goro-Gutu district, eastern ethiopia and open woodlands receiving similar practice.
Canopy cover • Inside canopy • Composition • Diversity • Important value Index • Richness • Outside canopy
ANOVA: Analysis of Variance; FAO: Food and Agriculture Organization; GLM:General Linear Models; IVI: Important Value Index; RA: Relative Abundance; RD: Relative Density; RF: Relative Frequency; SAS: Statistical Analytical System
The importance of maintaining biodiversity has been widely recognized at both national and international levels [1]. In recent years, increasing attention on productive agricultural systems that are resource use efficient has placed biodiversity at the center stage of discussions on agricultural intensification [2]. Healthy and properly functioning biodiversity resources have the power to deliver the natural services of ecosystems to humanity. Biodiversity resources are the driving forces for the proper functioning of ecosystems.
Plants diversity is a fundamental component of ecosystem diversity, contributing to both habitat structure and ecosystem function [3]. CBD reported that, the richer diversity of plant life, the greater the opportunity for medical discoveries, economic development, and adaptive responses to such new challenges as climate changes. However, globally, one of the most pressing contemporary environmental problems in terrestrial ecosystems is the loss of biodiversity resulting from changes in land use and management [4]. This is mainly attributed to elimination of natural habitats to meet the increasing demands of the growing population in the form of land use changes; the expansion of agricultural lands and settlement areas, energy demand and the need for shelter and construction material [5].
Grasslands are among the earth’s major natural resources supporting the livelihoods of many in different parts of the world as a result of the proper functioning of natural ecosystems that are aided by the existence of diverse faunal and floral species. But despite their fauna and flora richness, grassland biomes are degraded ecosystems [6]. Many of the grasslands ecosystems occur where the climate can theoretically support closed canopy forests [7].
Grasslands have historically been an area of expansion for human land use, and much of the world’s highly productive grassland has been converted to crops, mixed farming and tree plantations [8].
Grasslands biodiversity face immense pressure from humaninduced environmental change but are widely perceived to be of low conservation priority relative to forests [9]. The under valuation of grassland ecosystem is reflected in national and international environmental policies that inadvertently exacerbate conversion for agriculture, degradation caused by inappropriate management and increasingly, tree plantsing [10]. Thus, the future threats to grasslands appear high, given a need to feed a rapidly growing human population [11].
Afforestation expansion is of concern because the conversion of grassland biomes to tree plantations or forests comes at a high cost to biodiversity and ecosystem services [12]. Dense tree cover is fundamentally incompatible with grassland biome biodiversity, because it severely limits the richness and productivity of light demanding herbaceous plants and faunal diversity while reducing habitat for animals adapted to open environments [13]. Compared with grasses and forbs, trees require far more water and soil nutrients and have markedly different patterns of above and belowground carbon allocation [14]. Consequently, afforestation and forest expansion in grassland can dramatically alter nutrient cycles, reduce soil-carbon storage, and change hydrology (e.g., decrease groundwater recharge and stream flow [15,16]. Despite these high environmental costs, tree planting and carbon sequestration initiatives continue to target grassland biomes [17]. In these areas, tree plantsing can quickly increase aboveground carbon stocks [18]. In contrast, where grassy biomes are protected, grassland largely increase belowground carbon stocks as much carbon as forests do globally [19].
The fast growing natures of conifer tree species in Ethiopia and favorable economic returns from these tree plantations have encouraged the conversion of natural grasslands into tree plantations. Despite the increasing number of studies looking at the stability of tree plantations, there have been few efforts comparing the forests established and grasslands [20]. Furthermore, a lack of scientific management guidelines, soil degradation, decline in biological diversity, and low resilience of the ecosystem are common problems in afforested areas. The effects of tree species on the associated understory herbaceous productivity vary with the environment or the climatic conditions. Additionally, factors that are critical for vegetation diversity are not consistent across regions or locals. Thus, understanding how they affect biodiversity is critical to the understanding of ecological functions of plantations and to the improvement in their management.
Due to their richness in species and important ecosystem services grasslands are particularly valuable habitats that are in the focus of nature conservation and ecosystem restoration. The Keramile open forest is a home to grassland herbaceous plants species disappeared on communal grazing land, farmland, degraded grasslands and roadside. On grasslands, knowledge of factors affecting plants species composition and their abundance is the key to the understanding of productivity and forage quality and thus to successful management, too. However, it was unclear what these conifer tree species impact would be on grassland herbaceous plants in Keramile open forest, Goro-Gutu district, eastern Ethiopia. No information or data is available on the effects of these tree species on herbaceous plants here. Therefore, there was a strong need of undertaking further investigation of the exotic Cupressus lusitanica and indigenous Juniperus procera and Podocarpus falcatus trees species effects on grassland herbaceous plants composition, distribution and diversity.
Description of the study area
The study was conducted at Keramile protected open forest in Goro-Gutu district. Goro-Gutu district is found in eastern highlands of Ethiopia, Eastern Hararghe zone of the Oromia National Regional State. It is 408 km from Addis Ababa at 90 35'N, 380 18'E; and it is located 107 km from the zonal capital Harar. The agro-ecological classification of the Goro-Gutu district indicated that 28% of the total area is classified as mid-land “woina-dega ‟, 49% as lowland “kola” and 23% as highland “dega”. The land use pattern within the district shows that 43% of the total area is arable land; 2.3% pasture and 19.95% is forest and bush land, 34.8% degraded and settlement areas. The district is characterized by mountain, plateau, dissected gullies and degraded hills. It has bimodal rainfall patterns. The annual average rain fall is 900 mm with the corresponding temperature range of 16°C-200°C and 20°C-240°C during the coldest and warmest months respectively.
The district is characterized by open forest which is made up of trees or shrubs interspersed with grass species. The plants description presented by east hararghe planning and economic development shows that the Keramile protected open forest is characterized by dry evergreen montane forest and grassland complex on the basis that the plants type occurring in an altitudinal range of 2000 m-2300 m, with average annual temperature and rainfall of 16°C-24°C and 800 mm-1200 mm, respectively.
Climate
Flora: Keramile open forest is characterized by open forest which is made up of trees or shrubs and dominated with grass species. The vegetation description presented by east hararghe planning and economic development (2001) shows that the study area is characterized by dry evergreen montane forest and grassland complex on the basis that the vegetation type occurring in an altitudinal range of 2000 m-2300 m, with average annual temperature and rainfall of 16°C-24°C and 800 mm-1200 mm, respectively.
The dominant tree species of the study area Juniperus procera, Cupressus lusitanica, Podocarpus falcatus, Croton macrostachyus, Cordia Africana, Ficus sycomorus, Hagenia abyssinica, Olea europaea, Acacia abyssinica, Acacia decurrens, Acacia saligna, Eulcalyptus globules, Psidium guajava, Schinus molle, Gravillea robusta and Casuarinas cunninghamiana. The whole area is dominated by Juniperus procera, Cupressus lusitanica and Podocarpus falcatus. The area is well known by its natural vegetation and plantations of exotic tree species.
Selection of sampling trees
The three dominant tree species, representing one exotic (Cupressus lusitanica) and two indigenous (Podocarpus falcatus and Juniperus procera), found in isolation, were selected for this study. Based on their dominance compared to other to other woody species they represent suitable species for a purposive study of the effects of tree species on herbaceous vegetation. Accordingly, 20 matured trees, from each species, were purposively selected based on their similar canopy size and tree height. In total, 60 trees (3 tree species × 20 trees for each species) were selected for the study.
Tree height was measured using clinometers. The canopy cover of the trees was measured by using the measuring tape on ground level through the canopy length and then canopy area was calculated by using perpendicular diameters in two dimensions at right angle according to Savadogo and Elfving.
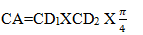
Where:
CA=Canopy/crown area
CD1 and CD2=Canopy diameters in two dimensions at right angle
Vegetation sampling and analysis
Sampling of herbaceous vegetation: The herbaceous species were assessed in 1 m2 quadrat under inside and outside canopies of selected individual trees in four directions (north, south, east and west). In each tree, canopy radius was determined by averaging the distance measured from the trunk to the canopy edge in four different directions. Totally, 480 samples (3 tree species × 20 trees/species × 2 canopy cover × 4 directions as sample quadrats) were used for the study. The study was conducted in September, 2018 during the flowering stage of most herbaceous species. For those herbaceous species that were difficult to identify in the field; their specimens were transported to Haramaya University Herbarium and plant laboratory for further identification (Figure 1).

Figure 1. The layout of herbaceous vegetation data collection under and outside tree canopies.
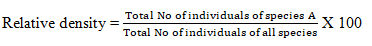
Relative density, relative frequency, relative dominance and important value index: Relative density was calculated as the percentage of the density of each species divided by the total stem number of all species ha-1.
Relative frequency of a species was computed as the ratio of the frequency of the species to the sum total of the frequency of all species in the study site.
Relative abundance was calculated as the percentage of the total ground cover of a species out of the total ground cover of all species at the study site.
Important Value Index (IVI), which indicates the relative ecological importance of a given herbaceous species at a particular site, was determined from the summation of the relative values of density, frequency and dominance of each herbaceous species. That is,
Important value index=Relative density+Relative dominance +Relative frequency
Species diversity, richness and evenness: The diversity of herbaceous plants per sampling position (quadrat) was calculated in terms of the species richness (S), species evenness (E) and shannon weiner index (H’). Species richness is the total number of species recorded in a site, and was determined from the total number of herbaceous species recorded in all sample plots. Diversity of herbaceous species was analyzed by using the Shannon-Weiner diversity index. The index takes into account the species richness and proportion of each species in all sampled quadrats of the study site. The Shannon diversity index was calculated using the following formula.
Where: H’=Shannon-Wiener Diversity Index;
S=the number of species;
Σ=Summation symbol;
pi=the proportion of' individuals of the ith species expressed as a proportion of the total number of individuals of all species;
ln=log bases (natural logarithms).
The value of Shannon diversity index is usually between 1.5 and 3.5 and only rarely exceeds 4.5.
Equitability or evenness, a measure of similarity of the abundances of the different herbaceous species in the study site, was analyzed by using shannon’s evenness or equitability index. Equitability or evenness index was calculated using the following formula.
Where: E=Evenness;
H’=Shannon-Wiener Diversity Index;
Hmax=lnS;
S=total number of species in the sample.
The value of evenness index falls between 0 and 1. The higher the value of evenness index, the more even the species is in their distribution within the given area.
Data analysis
The herbaceous vegetation species diversity was analyzed using PAST version 3.10, Paleontological Statistical software. The herbaceous vegetation species data from all quadrats were combined by tree species separately to it’s under canopy and outside canopy cover. The data obtained from the herbaceous plats were subjected to two way ANOVA (Analysis of Variance) in the factorial experiment, with tree species as one factor and canopy type as the other factor. All statistical analyses were performed using SAS software (SAS, 2009, version 9.1.3) by the General Linear Models (GLM) procedure. Before performing ANOVA, the data were log-transformed to increase normality. The model included the effects of tree species, canopy cover and their interaction as independent factor.
Mean separations were tested using the Least Significance Difference (LSD) and significant levels considered at P<0.05.The statistical model used for this study was:
Where: Yij=Over all observation
μ=Over all mean
Ti=Tree species effect
Cj=Canopy effect
CTij=Interaction effect
eij=Error effect
Heights and crown diameters of the three tree species
The mean heights and crown diameters of the three dominant tree species, Cupressus lusitanica, Podocarpus falcatus and Juniperus procera selected for this study is presented in Table 1 below. The tree species were representative of the dominant tree species in Keramile open forest land. Their dominance when compared to other woody species of the study area they represented the suitable tree species for a purposive study of the effects of tree species on herbaceous plants (Table 1).
| Tree species | Height (m) | Crown diameter (m) |
|---|---|---|
| P. falcatus | 33.00 ± 0.96 | 5.03 ± 0.08 |
| J. procera | 26.00 ± 0.96 | 5.20 ± 0.08 |
| C. lusitanica | 29.67 ± 0.96 | 5.40 ± 0.08 |
Effects of tree species on herbaceous vegetation composition and distribution
In the present study, 55 herbaceous plant species belonging to 17 families were identified outside and inside of the tree canopy of the total 60 trees. The dominant families were Fabaceae represented by 11 species (20%), Poaceae by 11 species (20%), Asteraceae by 10 species (18.18%), Lamiaceae by 5 species (9.09%), Acanthaceae by 4 species (7.27%), Rubiaceae by 3 species (5.45%). The rest of the families were represented by one species (1.82%). In the present study, the herbaceous plants species composition and dominant species varied in outside and inside canopy covers of the tree species. The overall results of relative abundance, relative density, relative frequency and Important Value Index (IVI) of herbaceous vegetation outside and inside of the tree canopy of study site are given in Table 2.
The result of this study revealed that under canopies of the three tree species and the outside canopies were occupied by different herbaceous species composition. Although some of the species were found on more than one tree species and canopy types, a few of the species were found to occupy only inside or outside canopy of the tree species.
The plants that made the highest cover/abundance were Hyparrhenia rufa (22.73%) in the outside canopies and Abutilon bidentatum (14.38%) under P. falcatus trees and Oplismenus compositus (20.31% and 21.60%) under J. procera and C. lusitanica canopies respectively. Highest relative density value was observed for Oplismenus compositus (38.21, 33.79 and 21.06) under J. procera, C. lusitanica and P. falcatus trees respectively and Hyparrhenia rufa (45.5) in the outside canopy. Whereas the other plants species that showed the least RD values include Indigofera intricate, Crotalaria albicoulis and Salvia nilotica under P.falcatus canopiy; Rumex nervosus, Crotalaria spps and Guizotia schimperi; under J.procera tree; Rumex nervosus, Vicia sativa L. and Asystasia mysorensis under C.lusitanica; and Amaranthus gracilis, Rubia cordifolia and Galium ofhamatum in outside canopy.
Relative Frequency (RF) data also varied for different herbaceous plants, canopy types and tree species. Abutilon bidentatum has the highest (8.56) RF value under P. falcatus while Oplismenus compositus has highest (9.46 and 6.54) RF value under J. procera and C. lusitanica trees respectively. Hyparrhenia rufa had highest RF value in outside canopy. Indigofera intricate, Crotalaria albicoulis Franch, Salvia nilotica, Becium flamentosum and Crotalaria keniensis make the lowest RF under P. falcatus, while Senna alexandrina, Rumex nervosus, Bidens ghedoensis, Crotalaria spp, Ocimum spp, Tetrapogon villosus and Guizotia schimperi under J. procera canopy; Rumex nervosus, Crotalaria spp, Vicia sativa L., Asystasia mysorensis, Crotalaria laburnifolia, Ocimum sppand Becium flamentosum under C.lusitanica canopy; and Amaranthus gracilis and Paspalidium desertorum in outside canopy had the lowest RF value.
Considering the first three herbaceous plants species with the highest values of IVI, the outside canopy was dominated by Hyparrhenia rufa (78.45), Medicago polymorpha (36.63) and Cenchrus Ciliaris L. (30.81) species. The dominant herbaceous plants species under P.falcatus canopy were Oplismenus compositus (36.20), Abutilon bidentatum (34.12) and Hyparrhenia rufa (32.22). Under J. procera, the dominant herbaceous plants species were Oplismenus compositus (67.78), Tephrosia pumila (36.99) and Hypoestes forskaolii (19.97). Oplismenus compositus (63.68), Hyparrhenia rufa (34.75) and Hypoestes forskaolii (28.57) appeared as dominant herbaceous plants species occurred under C. lusitanica canopy (Table 2).
|
Plants species |
Under P.falcatus canopy |
Outside P.falcatus canopy |
Under J. procera canopy |
Outside J. procera canopy |
Under C. lusitanica canopy |
Outside C. lusitanica canopy |
||||||||||||||||||
|---|---|---|---|---|---|---|---|---|---|---|---|---|---|---|---|---|---|---|---|---|---|---|---|---|
|
RD |
RF |
RA |
IVI |
RD |
RF |
RA |
IVI |
RD |
RF |
RA |
IVI |
RD |
RF |
RA |
IVI |
RD |
RF |
RA |
IVI |
RD |
RF |
RA |
IVI |
|
|
Hypoestes triflora |
1.84 |
3.67 |
2.81 |
8.32 |
0.06 |
1.53 |
0.36 |
1.95 |
0.39 |
1.8 |
0.51 |
2.7 |
0.04 |
1.49 |
0.23 |
1.77 |
0.54 |
2.8 |
1.36 |
4.7 |
0.06 |
1.41 |
0.12 |
1.59 |
|
Tagetes minuta |
0.53 |
1.96 |
2.3 |
4.79 |
0.14 |
2.45 |
1.39 |
3.98 |
1.36 |
2.25 |
1.12 |
4.73 |
2.2 |
2.99 |
1.64 |
6.83 |
0.72 |
1.87 |
1.36 |
3.95 |
3.22 |
3.23 |
2.59 |
9.03 |
|
Commelina africana L. |
0.71 |
3.18 |
1.23 |
5.11 |
0.04 |
0.61 |
0.11 |
0.76 |
0.42 |
1.8 |
0.61 |
2.83 |
0.04 |
0.75 |
0.14 |
0.93 |
0.54 |
1.87 |
0.9 |
3.32 |
0.11 |
0.94 |
0.12 |
1.17 |
|
Medicago polymorpha |
3.43 |
3.67 |
3.79 |
10.88 |
16.26 |
8.8 |
15.02 |
40.07 |
7.82 |
2.7 |
6.16 |
16.68 |
10.85 |
8.21 |
13.48 |
32.53 |
5.42 |
6.54 |
4.37 |
16.33 |
13.04 |
8.92 |
15.33 |
37.29 |
|
Senna alexandrina |
0.16 |
0.98 |
0.51 |
1.65 |
0.07 |
1.23 |
0.71 |
2.01 |
0.07 |
0.45 |
0.1 |
0.62 |
0.05 |
1.12 |
0.51 |
1.68 |
0 |
0 |
0 |
0 |
0.04 |
0.94 |
0.35 |
1.33 |
|
Teramnus uncinatus |
0.69 |
2.2 |
2.41 |
5.29 |
0.17 |
2.15 |
0.89 |
3.2 |
3.76 |
7.21 |
6.2 |
17.17 |
0.52 |
2.24 |
1.21 |
3.97 |
1.88 |
2.8 |
2.26 |
6.95 |
0.88 |
2.35 |
1.47 |
4.69 |
|
Indigofera intricate |
0.02 |
0.24 |
0.1 |
0.36 |
0.08 |
2.15 |
1.07 |
3.29 |
0 |
0 |
0 |
0 |
0.03 |
1.12 |
0.37 |
1.53 |
0 |
0 |
0 |
0 |
0.08 |
0.94 |
0.23 |
1.25 |
|
Rumex nervosus |
0.07 |
0.73 |
0.2 |
1.01 |
0.06 |
1.53 |
0.39 |
1.98 |
0.04 |
0.45 |
0.1 |
0.59 |
0.05 |
1.12 |
0.23 |
1.41 |
0.18 |
0.93 |
0.45 |
1.57 |
0.13 |
0.94 |
0.41 |
1.48 |
|
Vernonia tenoreana |
0.14 |
1.47 |
0.72 |
2.32 |
0.08 |
2.15 |
0.82 |
3.04 |
0.11 |
1.35 |
0.51 |
1.97 |
0.36 |
1.49 |
0.75 |
2.6 |
0.36 |
1.87 |
1.46 |
3.69 |
0.03 |
1.41 |
0.35 |
1.8 |
|
Asystosia mysorensis |
0.49 |
1.71 |
1.48 |
3.69 |
0 |
0 |
0 |
0 |
0.47 |
2.25 |
0.91 |
3.6 |
0 |
0 |
0 |
0 |
0.72 |
1.87 |
1.36 |
3.95 |
0 |
0 |
0 |
0 |
|
Amaranthus gracilis |
0.85 |
2.93 |
1.69 |
5.47 |
0.03 |
0.31 |
0.11 |
0.44 |
0.45 |
1.8 |
1.31 |
3.57 |
0 |
0 |
0 |
0 |
2.93 |
3.74 |
3.82 |
10.49 |
0 |
0 |
0 |
0 |
|
Bidens biternata |
0.21 |
1.22 |
0.51 |
1.95 |
0.06 |
1.23 |
0.36 |
1.64 |
0.11 |
0.9 |
0.41 |
1.41 |
0.03 |
0.75 |
0.23 |
1.01 |
2.32 |
1.87 |
2.46 |
6.65 |
0.03 |
0.94 |
0.18 |
1.14 |
|
Paspalidium desertorum |
0.88 |
1.71 |
0.77 |
3.36 |
0.05 |
0.61 |
0.11 |
0.77 |
0.65 |
1.8 |
0.81 |
3.26 |
0 |
0 |
0 |
0 |
1.26 |
1.87 |
1.46 |
4.59 |
0 |
0 |
0 |
0 |
|
Lotus species |
0.27 |
1.22 |
0.31 |
1.79 |
0.12 |
1.53 |
0.32 |
1.97 |
0.29 |
1.8 |
0.41 |
2.49 |
0.33 |
1.49 |
0.42 |
2.24 |
0.72 |
1.87 |
0.9 |
3.5 |
0.31 |
1.88 |
0.41 |
2.6 |
|
Polygala tinctoria |
0.04 |
0.49 |
0.2 |
0.73 |
0.06 |
1.84 |
0.78 |
2.69 |
0.14 |
1.8 |
0.71 |
2.66 |
0.28 |
1.87 |
0.75 |
2.89 |
0.36 |
1.87 |
1.56 |
3.79 |
0.21 |
2.35 |
0.76 |
3.32 |
|
Ageratum conyzoides |
0.23 |
0.73 |
0.26 |
1.22 |
0.11 |
1.53 |
0.32 |
1.97 |
0.54 |
2.7 |
2.91 |
6.15 |
0.2 |
2.61 |
0.79 |
3.61 |
1.08 |
3.74 |
2.81 |
7.63 |
0.36 |
2.82 |
0.65 |
3.82 |
|
Bidens ghedoensis |
0.19 |
1.22 |
0.67 |
2.08 |
0.17 |
2.45 |
1.39 |
4.01 |
0.07 |
0.45 |
0.1 |
0.62 |
0.38 |
1.87 |
0.51 |
2.76 |
0 |
0 |
0 |
0 |
0.27 |
1.41 |
0.76 |
2.44 |
|
Crotalaria species |
0.07 |
0.98 |
0.26 |
1.3 |
0.07 |
1.53 |
0.53 |
2.14 |
0.04 |
0.45 |
0.2 |
0.69 |
0.42 |
1.87 |
0.84 |
3.13 |
0.36 |
0.93 |
0.45 |
1.75 |
0.09 |
1.88 |
0.47 |
2.43 |
|
Crotalaria albicoulis Franch |
0.04 |
0.24 |
0.1 |
0.38 |
0.12 |
1.53 |
0.78 |
2.43 |
0 |
0 |
0 |
0 |
0.12 |
1.12 |
0.51 |
1.75 |
0 |
0 |
0 |
0 |
0.1 |
1.41 |
0.41 |
1.92 |
|
Guizotia schimperi |
0.16 |
1.22 |
0.67 |
2.05 |
0.09 |
1.23 |
1.25 |
2.56 |
0.04 |
0.45 |
0.1 |
0.59 |
0.05 |
1.12 |
0.65 |
1.82 |
0 |
0 |
0 |
0 |
0.06 |
1.41 |
0.53 |
2 |
|
Bidens pilosa |
5.95 |
6.6 |
8.34 |
20.9 |
0.03 |
0.61 |
0.11 |
0.75 |
2.15 |
2.7 |
2.52 |
7.37 |
0.05 |
0.75 |
0.14 |
0.94 |
0.54 |
1.87 |
1.9 |
4.32 |
0.08 |
0.94 |
0.41 |
1.43 |
|
Cardamine hirsuta |
0.35 |
1.47 |
0.67 |
2.49 |
0.21 |
2.15 |
0.96 |
3.32 |
0.5 |
1.35 |
0.81 |
2.66 |
0.14 |
1.87 |
0.37 |
2.38 |
0.97 |
1.87 |
1.76 |
4.43 |
0.56 |
2.35 |
1 |
3.91 |
|
Plantsago lanceolata L. |
0 |
0 |
0 |
0 |
0.04 |
0.92 |
0.14 |
1.1 |
0.22 |
0.9 |
0.3 |
1.42 |
0.07 |
1.49 |
0.28 |
1.84 |
0 |
0 |
0 |
0 |
0.04 |
0.94 |
0.12 |
1.1 |
|
Vicia sativa L. |
0.39 |
1.96 |
0.67 |
3.01 |
0.27 |
1.53 |
0.75 |
2.55 |
0.24 |
0.9 |
0.51 |
1.65 |
0.16 |
1.12 |
0.65 |
1.93 |
0.18 |
0.93 |
0.45 |
1.57 |
0.32 |
1.88 |
1.59 |
3.79 |
|
Hyparrhenia rufa |
19.05 |
5.13 |
8.03 |
32.22 |
48.13 |
9.82 |
21.96 |
79.91 |
6.78 |
5.86 |
6.49 |
19.12 |
44.65 |
10.45 |
22.4 |
77.5 |
16.8 |
6.54 |
11.41 |
34.75 |
43.72 |
11.33 |
23.82 |
78.86 |
|
Cenchrus ciliaris L. |
2.07 |
2.69 |
1.84 |
6.6 |
18.86 |
6.13 |
13.94 |
38.94 |
1.4 |
1.35 |
1.22 |
3.97 |
11.37 |
4.85 |
12.75 |
28.97 |
1.81 |
1.87 |
2.26 |
5.94 |
9.97 |
4.23 |
10.34 |
24.53 |
|
Crotalaria incana L. |
0 |
0 |
0 |
0 |
0.06 |
1.23 |
0.86 |
2.14 |
0 |
0 |
0 |
0 |
0.05 |
1.49 |
0.51 |
2.05 |
0 |
0 |
0 |
0 |
0.05 |
1.41 |
0.65 |
2.11 |
|
Hypoestes forskaolii |
15.42 |
5.62 |
10.7 |
31.74 |
0.22 |
1.53 |
0.57 |
2.32 |
6.46 |
6.31 |
7.2 |
19.97 |
0.6 |
2.24 |
0.89 |
3.73 |
10.21 |
8.41 |
9.95 |
28.57 |
0.22 |
2.35 |
0.53 |
3.09 |
|
Pentanisia ouranogyne |
0.18 |
0.98 |
0.92 |
2.08 |
0 |
0 |
0 |
0 |
0.07 |
0.9 |
0.41 |
1.38 |
0 |
0 |
0 |
0 |
0.36 |
1.87 |
1.36 |
3.59 |
0 |
0 |
0 |
0 |
|
Eriochloa procera |
2.83 |
4.16 |
3.28 |
10.26 |
0 |
0 |
0 |
0 |
0 |
0 |
0 |
0 |
0 |
0 |
0 |
0 |
0 |
0 |
0 |
0 |
0 |
0 |
0 |
0 |
|
Salvia nilotica |
0.04 |
0.24 |
0.1 |
0.38 |
0.03 |
0.61 |
0.11 |
0.75 |
0.14 |
1.35 |
0.3 |
1.8 |
0.03 |
0.75 |
0.23 |
1.01 |
0 |
0 |
0 |
0 |
0.03 |
0.94 |
0.12 |
1.08 |
|
Asystasia mysorensis |
0.14 |
0.98 |
0.41 |
1.53 |
0 |
0 |
0 |
0 |
0.07 |
0.9 |
0.2 |
1.18 |
0 |
0 |
0 |
0 |
0.18 |
0.93 |
0.65 |
1.77 |
0 |
0 |
0 |
0 |
|
Abutilon bidentatum |
11.18 |
8.56 |
14.38 |
34.12 |
0.15 |
2.45 |
0.64 |
3.24 |
4.26 |
6.95 |
5.94 |
17.16 |
0.11 |
1.49 |
0.56 |
2.16 |
1.99 |
1.87 |
1.81 |
5.66 |
0.11 |
1.41 |
0.53 |
2.05 |
|
Crotalaria laburnifolia |
0.21 |
1.47 |
0.97 |
2.65 |
0.28 |
3.37 |
2 |
5.65 |
0.18 |
1.35 |
0.71 |
2.24 |
0.12 |
1.87 |
0.89 |
2.88 |
0.36 |
0.93 |
0.45 |
1.75 |
0.09 |
1.88 |
0.59 |
2.55 |
|
Ageratum conyzoides |
0.74 |
1.22 |
1.13 |
3.09 |
2.79 |
2.76 |
4.67 |
10.22 |
0.18 |
0.9 |
0.3 |
1.38 |
2.81 |
2.61 |
3.88 |
9.3 |
0.54 |
1.87 |
0.9 |
3.32 |
4.11 |
3.29 |
6.29 |
13.68 |
|
Chloris radiota |
3.29 |
1.71 |
2.35 |
7.35 |
6.8 |
3.78 |
11.81 |
22.39 |
2.18 |
1.8 |
1.91 |
5.9 |
7.74 |
3.73 |
9.9 |
21.37 |
2.53 |
3.74 |
3.62 |
9.89 |
9.29 |
4.23 |
11.87 |
25.38 |
|
Zehneria scabra |
0.25 |
1.22 |
0.61 |
2.08 |
0 |
0 |
0 |
0 |
0.11 |
0.9 |
0.4 |
1.41 |
0 |
0 |
0 |
0 |
0 |
0 |
0 |
0 |
0 |
0 |
0 |
0 |
|
Asparagus racemosus |
0 |
0 |
0 |
0 |
0 |
0 |
0 |
0 |
1.14 |
1.35 |
0.81 |
3.31 |
0 |
0 |
0 |
0 |
0 |
0 |
0 |
0 |
0 |
0 |
0 |
0 |
|
Geranium aculeolatum |
0.53 |
1.47 |
0.72 |
2.71 |
0.08 |
0.92 |
0.25 |
1.25 |
0.32 |
0.9 |
0.5 |
1.72 |
0.02 |
0.75 |
0.09 |
0.86 |
0 |
0 |
0 |
0 |
0.06 |
0.94 |
0.23 |
1.23 |
|
Oplismenus compositus |
21.06 |
4.65 |
10.49 |
36.2 |
0.59 |
1.53 |
1.25 |
3.37 |
38.21 |
9.26 |
20.31 |
67.78 |
5.45 |
3.36 |
6.35 |
15.15 |
33.79 |
8.28 |
21.6 |
63.68 |
0.52 |
0.94 |
0.88 |
2.34 |
|
Tephrosia pumila |
1.68 |
4.65 |
5.89 |
12.21 |
0.31 |
3.68 |
2.71 |
6.7 |
10.87 |
9.46 |
16.66 |
36.99 |
3.54 |
5.22 |
3.64 |
12.41 |
4.07 |
6.54 |
5.88 |
16.49 |
2.37 |
4.23 |
3.5 |
10.6 |
|
Eragrostis superba |
0 |
0 |
0 |
0 |
1.07 |
1.84 |
2 |
4.91 |
0 |
0 |
0 |
0 |
1.17 |
1.49 |
2.38 |
5.05 |
0 |
0 |
0 |
0 |
1.47 |
0.94 |
1.88 |
4.29 |
|
Rubia cordifolia |
1.13 |
3.67 |
2.97 |
7.77 |
0.03 |
0.92 |
0.14 |
1.09 |
1.72 |
4.05 |
1.64 |
7.41 |
0.01 |
0.37 |
0.05 |
0.43 |
0.9 |
2.8 |
1.81 |
5.52 |
0 |
0 |
0 |
0 |
|
Sporobolus pyramidalis |
0 |
0 |
0 |
0 |
0.73 |
2.76 |
2.18 |
5.66 |
0 |
0 |
0 |
0 |
1.8 |
2.61 |
2.85 |
7.26 |
0 |
0 |
0 |
0 |
2.68 |
2.35 |
2.88 |
7.91 |
|
Ocimum species |
0.12 |
0.73 |
0.41 |
1.27 |
0.11 |
0.61 |
0.5 |
1.22 |
0.14 |
0.45 |
0.2 |
0.8 |
0.05 |
0.75 |
0.23 |
1.03 |
0.54 |
0.93 |
0.65 |
2.14 |
0.24 |
1.88 |
0.94 |
3.06 |
|
Becium flamentosum |
0.05 |
0.24 |
0.1 |
0.4 |
0.35 |
1.53 |
1.25 |
3.13 |
0 |
0 |
0 |
0 |
0.46 |
2.61 |
1.5 |
4.56 |
0.36 |
0.93 |
0.45 |
1.75 |
1.89 |
2.82 |
3.41 |
8.11 |
|
Crotalaria keniensis |
0.05 |
0.24 |
0.26 |
0.55 |
0.04 |
0.92 |
0.36 |
1.32 |
0 |
0 |
0 |
0 |
0.03 |
1.12 |
0.34 |
1.49 |
0 |
0 |
0 |
0 |
0.04 |
0.94 |
0.23 |
1.22 |
|
Corchorus trilocularis |
0.44 |
1.71 |
0.56 |
2.72 |
0.48 |
3.07 |
1.68 |
5.23 |
0.22 |
1.35 |
0.4 |
1.97 |
0.33 |
2.61 |
1.12 |
4.06 |
0.54 |
1.87 |
1.2 |
3.62 |
0.42 |
2.35 |
0.65 |
3.41 |
|
Tetrapogon villosus |
0.42 |
1.22 |
0.51 |
2.16 |
0.16 |
2.15 |
0.46 |
2.77 |
0.11 |
0.45 |
0.2 |
0.76 |
1.16 |
2.61 |
1.91 |
5.69 |
0 |
0 |
0 |
0 |
0.16 |
1.88 |
0.53 |
2.56 |
|
Plectranthus barbatus |
0.05 |
0.49 |
0.15 |
0.7 |
0.03 |
1.84 |
0.36 |
2.22 |
0 |
0 |
0 |
0 |
0.05 |
1.49 |
0.23 |
1.77 |
0 |
0 |
0 |
0 |
0.03 |
1.41 |
0.23 |
1.68 |
|
Eragrostis species |
0 |
0 |
0 |
0 |
0.15 |
1.23 |
0.53 |
1.91 |
0 |
0 |
0 |
0 |
0.14 |
1.12 |
0.65 |
1.91 |
0 |
0 |
0 |
0 |
0.17 |
0.94 |
0.53 |
1.64 |
|
Orthosiphon schimperi |
0.42 |
1.22 |
0.61 |
2.26 |
0.03 |
0.61 |
0.11 |
0.75 |
0.11 |
0.45 |
0.2 |
0.76 |
0.05 |
1.12 |
0.19 |
1.36 |
0.36 |
0.93 |
0.45 |
1.75 |
0.04 |
0.94 |
0.18 |
1.16 |
|
Galium ofhamatum |
0.34 |
1.47 |
0.72 |
2.52 |
0.04 |
0 |
0.14 |
0.18 |
0.11 |
0 |
0 |
0.11 |
0 |
0.75 |
0.09 |
0.84 |
0.36 |
0 |
0 |
0.36 |
0 |
0.47 |
0.06 |
0.53 |
|
Kyllinga appendiculata |
0.25 |
0.98 |
0.36 |
1.58 |
0.1 |
1.53 |
0.5 |
2.13 |
0.07 |
0.45 |
0.1 |
0.62 |
0.08 |
1.12 |
0.37 |
1.58 |
0.36 |
0.93 |
0.45 |
1.75 |
0.03 |
0.94 |
0.18 |
1.15 |
|
Acmella caulirhiza |
0.35 |
1.47 |
0.87 |
2.69 |
0.08 |
1.53 |
0.36 |
1.97 |
4.83 |
4.95 |
5.75 |
15.54 |
1.2 |
2.99 |
0.84 |
5.02 |
2.71 |
5.61 |
3.17 |
11.48 |
0.3 |
3.76 |
1.23 |
5.29 |
Herbaceous vegetation species diversity, richness and evenness under and outside canopies of the tree species
The average species richness, evenness and diversity index of the herb layer under the tree canopy and outside canopies are shown in Table 3. The species richness of the herb vegetation under P. falcatus was significantly higher than under J. procera and C. lusitanica tree species (P<0.005). Similarly, a higher Shannon-Wiener species diversity (P<0.01) was recorded under P. falcatus when compared with J. procera and C. lusitanica. However, herbaceous vegetation richness and diversity were almost the same under C. lusitanica and J. procera but comparatively J. procera had higher species richness and diversity than C. lusitanica. Species evenness seems to be unaffected by the trees species. The result also revealed that canopy type had significant effects on species richness, evenness and diversity index of the herbaceous plants with higher species richness (P<0.001) and Shannon-Wiener species diversity index (P<0.002) outside canopy than under canopy areas.
| Tree species | Canopy cover | Diversity | Richness | Evenness |
|---|---|---|---|---|
| P. falcatus | Under canopy | 2.70 ± 0.17a | 47 ± 2.45a | 0.81 ± 0.034a |
| Outside canopy | 2.64 ± 0.17a | 47.31 ± 2.45a | 0.68 ± 0.034b | |
| J. procera | Under canopy | 1.70 ± 0.17b | 33.60 ± 2.45b | 0.75 ± 0.034ab |
| Outside canopy | 2.53 ± 0.17a | 45.81 ± 2.45a | 0.66 ± 0.034b | |
| C. lusitanica | Under canopy | 1.64 ± 0.17b | 30.61 ± 2.45b | 0.71 ± 0.034ab |
| Outside canopy | 2.56 ± 0.17a | 44.48 ± 2.45a | 0.68 ± 0.034b | |
| Tree species (TS) | SL | * | ** | Ns |
| Canopy cover (CC) | SL | ** | *** | ** |
| TS*CC | SL | * | ** | Ns |
Where: a, b, Means within a column with different superscripts differ significantly (P<0.05),* =(P<0.05); **=(P<0.01); *** =(P<0.001); SL: significance level; ns=non significant.
Effects of tree species on herbaceous plants composition and distribution
Our present study showed that tree species has modified the relative abundance, relative density, relative frequency and Important Value Index (IVI) of herbaceous vegetation. In terms of the species Importance Value Index (IVI), some of the species were found to be dominant in more than one site, i.e. the three tree species and canopy types. The result of this study revealed that under canopies of the three tree species and the outside canopies were occupied by different herbaceous species composition. Several studies also reported that differences in herbaceous plants communities in the outside and under canopy covers of tree species. In terms of the species Importance Value Index (IVI), some of the species were found to be dominant in more than one site, i.e. the three tree species and canopy types. If we consider the first 11 herbaceous species (Hyparrhenia rufa, Medicago polymorpha, Cenchrus ciliaris L., Chloris radiota, Bidens ghedoensis, Tephrosia pumila, Sporobolus pyramidalis, Crotalaria laburnifolia, Corchorus trilocularis, Eragrostis superba and Bidens ghedoensis)with the highest values of IVI in the outside canopies, except one species (Tephrosia pumila) which had higher IVI value under canopy; ten of them had higher IVI value in the outside canopy than under canopies.
Although some of the species were found on more than one tree species and canopy types, a few of the species were found only inside or outside canopy of the tree species. Species such as Crotalaria incana L, Eragrostis superba, Sporobolus pyramidalis and Eragrostis spp were present in outside canopy only. This shows that tree species and canopy over negatively affected herbaceous vegetation of the study area. Similar to different findings data collected in this study indicated that canopy closure was the important factors influencing herbaceous plants species composition and distribution. Similarly; Berthrong, et al. reported that changes in species abundance and composition of species assemblages in response to alterations in environmental conditions and disruption of ecological processes are major biotic impacts of afforestation on grasslands. This shows that some shade intolerant herb species found in open grasslands declined and others disappeared with tree species plantations. It may be related to the fact that there is competition among understory plants species for soil moisture, soil nutrients or may be to escape high shading effects, as there is already enough rainfall in highland areas.
The current study showed that the open areas/outside canopy and under canopy of the trees were dominated by different herbaceous plants species. It means that the tree canopy was strong filter that determines distribution and composition of herbaceous species in this study area as the canopy of species had a great influence on herb cover underside it. The two herbaceous species (Hypoestes forskaolii and Oplismenus compositus) were found to display higher IVI values under the three tree species canopy. On the other hand, the compositions of herbaceous vegetation under the tree canopy differ from one tree species to another one.
The herbaceous species, which had the highest relative density, also exhibited high relative frequency of occurrence and abundance, that is, good ground covered by the species. As a result, they also represented the highest IVI value, which shows that these species are dominant species of the study area and play crucial role for the ecological functioning of the area. They are well adapted to the environmental factors, suggesting that they are ecologically the most important species than the other herbaceous plants species and need monitoring management.The IVI could also be used to identify species under threat and set up conservation priority plans. Accordingly, those species under the three tree species and in the open area represented by small number of species and also their contribution to the total IVI is small or zero and hence conservation priority plans should first focus on these species. These species with low IVI values need high conservation efforts.
Effects of tree species on herbaceous vegetation species diversity, richness and evenness
Tree species had significant effects on species richness and diversity of the herbaceous vegetation species. The current study showed that the species richness and diversity of the herbaceous vegetation was significantly higher under P. falcatus than J. procera and C. lusitanica tree species. This might be related to the different in crown density which determines the amount of rainfall and light reaching the understory herbaceous vegetation. The amount of these impacts through interference with sunlight availability and rainfall depends on tree species. The scattered crown cover of P. falcatus allows enough rainfall and light to the understory vegetation.
Similar to this finding, von Oheimb and Härdtle, reported that canopy openness increases the proportion of light demanding species and species richness and diversity as well. However, the dense crown of C. lusitanica and J. procera, blocks out light and reduces the amount of rainfall, and prevents herbaceous plants growth under canopies. In agreement to this finding, Bol and Vroomen, reported that, the cypress tree species dense foliage blocks out light and prevent understory growth. Zemmrich, et al. also reported that light availability generally affects plants performance and the regeneration of species. Similarly, studies in a forest by Vockenhuber, et al. also showed a negative response of species richness to increasing canopy cover.
The difference in species richness and diversity might be also due to soil nutrient availability and litter quantity and quality. The physical and chemical features of litter layer might be the factor that brought different in herbaceous plants richness and diversity between the tree species and canopy types. Inside canopy vegetation seed under litter are deprived of light and the seeds cannot root easily and suppressed the growth of herbaceous plants. It means that litter hinders seed germination and reduces the diversity of plants species.
This result agrees with the findings of Macdonald and Fenniak, who reported that the change in soil physicochemical properties depends on the litter quality and quantity and the canopy architecture, which in turn depends on the tree species and canopy types. Also different studies have demonstrated that the physical and chemical features of the litter layer affect local species diversity.
Generally, the combine effects of precipitation, sunlight, nutrient availability and litter quality and quantity may be the factors that brought about increase of herb species richness and diversity under P. falcatus than C. lusitanica and J. procera trees. All these critical parameters are different among different tree species. This shows that, different micro environment created by different tree species had occupied by combination of different herbaceous species with different diversity and richness. However, herbaceous vegetation richness and diversity were almost the same under C. lusitanica and J. procera but comparatively J. procera had higher species richness and diversity than C. lusitanica. This result suggests that they had identical impacts on their sub canopy herbaceous plants diversity and richness. In this regard, trees species had strong filtering ability, which determines the composition of the herbaceous layer. However, species evenness seems to be unaffected by the trees species (Table 3).
Our study result also revealed that canopy type had significant effects on species richness, evenness and diversity of the herbaceous vegetation. Accordingly, the outside canopy area had higher species richness and species diversity than the under canopy areas. This might be related to the higher soil nutrient availability outside the tree canopies. A number of factors have been identified as determinants of herb layer diversity, for instance soil pH, nutrient availability, soil moisture, mass of the litter layer. The decline in plants diversity with grassland afforestation has been also attributed to several factors, including the exclusion of shade-intolerant native species by increasing plantations canopy over and the physical barrier of litter (particularly pine litter) or slash to germination.
The lower herbaceous vegetation diversity and richness under canopy cover might be associated to low light intensity under the canopy areas. The trees canopy cover might allow less light to reach the ground as a result the presence of many shade intolerant herb species decreased. Species richness and diversity index increased with increasing gap area and increasing light availability in beech stands. Light availability was positively correlated with understory plants species richness and with understory covers. Similar to the current study, Zemmrich, et al. pointed out that canopies are the main factors affecting the quantity and quality of light. In addition, Barbier, et al. estimated that light is commonly considered to be the major limiting factor of vegetation richness. Other studies confirmed our result indicating that canopy closure, was the important factors influencing understory vegetation composition. The result of this study shows tree canopies particularly by changes of light can affect herbaceous plants species composition. Inline to this finding, Veldman, et al. pointed out dense tree cover is fundamentally incompatible with grassland biome biodiversity; because it severely limits the richness and productivity of light demanding herbaceous plants. In addition to this conversions of natural grasslands to forests are likely to result in a decrease in species richness and diversity also reported by Bremer and Farley.
Another possible implication of increased species diversity and richness in the open area may be related to some of the changes in soil nutrient properties. The topsoil determines the physicochemical growth conditions for understory plants, changing their chemical and physical properties will influence the understory vegetation. Similarly, Pena, et al. demonstrated that herbaceous species were more influenced by soil conditions than by other factors in the surrounding landscape. In addition, according to Berthrong, et al., grassland afforestation decreases in plants diversity and richness, and composition.
Moisture availability may be also the factor brought difference in species diversity and richness between canopy cover. The tree crown interacts with rainfall through direct competition for water or preventing the rainfall from under story vegetation. In enough rainfall areas, especially in highlands; the environmental conditions created by the tree species might be less favored to shade intolerant herb species. The acidic nature of the soil under J. procera and C. lusitanica tree species might be also the factor determined the low herb species diversity and richness. Herb layer species richness and cover increased was positive effect on pH, with pH often emerging as the main driver of diversity and biomass in the herb layer. Additionally, the quantity and quality of the litter may be also the factor that brought difference between canopies. Similar to this, different studies have demonstrated that stand associated environmental conditions, specially the physical and chemical features of the litter layer affect local species diversity.
Generally, the richness and diversity of the herbaceous plants of the study area was significantly affected by tree species, canopy cover and their interaction. Both tree species and canopy cover negatively affected the richness and diversity of herbaceous plants in the current study. This clearly indicates that species richness and diversity of herbaceous plants was highly influenced by the nature of trees species and their canopy covers at Keramile open forest, Goro- Gutu district, eastern Ethiopia. In a natural disturbance based system, harvest gaps conserved understory plants diversity by promoting moderate disturbance. Similar to the current finding Baker, et al. reported that rainforest trees invasion in open forests led to decline in understory plants diversity and cover in open forests.
The current study showed that herbaceous species composition, distribution and diversity had significant variations between tree species and canopy types. Under tree canopy covers and outside canopy covers were dominated by different herbaceous plants species. Herbaceous plants composition and distribution were negatively affected by this tree species. Our study result showed that under and outside the tree species create a uniquely different plants community. The Important Value Index (IVI) result of the current study revealed that Oplismenus compositus, Abutilon bidentatum, Hyparrhenia rufa, Tephrosia pumila and Hypoestes forskaolii were the dominant herbaceous plants species under the tree canopy.
While the outside canopy of the tree species was dominated by Hyparrhenia rufa, Medicago polymorpha and Cenchrus Ciliaris L herbaceous plants species. Herbaceous plants species Crotalaria incana L, Eragrostis superba, Sporobolus pyramidalis and Eragrostis spp were present only outside canopies. This shows that during the transformation of grasslands in open forest or woodlands areas to this conifer tree plantation some shade-intolerant native species found in outside area were declined and others might be disappeared with tree plantations. The IVI value results also showed that species which had higher IVI value were dominated the outside canopy of the tree species. It means that the tree species are strongly affecting the distribution and composition of herbaceous plants communities in the study area. The finding implies the need for conservation and management of herbaceous plants species in open forest land.
The present study also revealed, in terms of species richness and species diversity index (Shannon-Wiener diversity index), which takes into account both the species richness and evenness were significantly higher under P. falcatus canopy and outside canopies than under J. procera and C. lusitanica tree species. Thus, it seems to be more useful for preserving herbaceous plants biodiversity than the other investigated tree species. The current study revealed that, the open grass areas had higher herbaceous diversity and richness than under canopy cover. The results emphasizes that tree species affect herbaceous plants communities of the study area in a different way, with J. procera and C. lusitanica tree species having the greater negative impacts.
Generally, the increased diversity and production of herbaceous plants in the outside canopies in the current study indicates that the presence of these large trees in Keramile open forest, Goro-Gutu district, Eastern Ethiopia could increase the vulnerability of the grassland ecosystem to future disturbances, such as climatic events.
It means that it has a negative effect on grassland ecosystem functions over time for maintaining its ecological stability and reliance in the study area. The study shows that many of the benefits or an ecosystem service of this high altitude grassland is under threat from human actions taken, tree plantations, which are incompatible with grassland biodiversity and ecosystem functions. This shows that the gains derived from tree plantations to increase the supply of only forest ecosystem service in grassland have been achieved at the losses in many ecosystem services of the grasslands.
Tree plantations establishment for rehabilitation of deforested or degraded areas in some parts of Ethiopia has up to now have been largely unsuccessful. It is clear that lack of incentives, compensation for protection and maintenance of the planted areas, lack of attention to the local conditions, conflict and lower soil fertility is a major reason for the failure. These enforce the expansion of tree plantations in open forest areas, where grassland vegetation protected and survival rate for tree plantations has been estimated to be high. These processes might be driven by unbalanced overall agricultural and policy support; which highlights the problem when decision making in one sector does not consider the implications for other sectors.
In this case, the combined effect of inadequate management and tree plantations has degraded the capacity of grassland ecosystems to supply ecosystem service. Even though a current wave of agricultural expansion and tree plantations is occurring in Goro-Gutu open forest, with many grasslands undergoing change, the restoration of grassland by using planting of grasses and forbs are often neglected in management and planning. This suggests that lack of integrated forest and grassland management would pose a serious challenge for grassland conservation and management in eastern Ethiopia. Therefore, future threats to grasslands appear high; a serious challenge to both wild and domestic herbivores, thus threatening a need to feed a rapidly growing human population. These problems, unless addressed, will substantially diminish the benefits that future generations obtain from grassland ecosystems and are a barrier to achieving further development. Thus, proper management and conservation of grassland herbaceous plants are very crucial under the rapidly growing human population, changing climate and global warming. Therefore, the following points are recommended to meet the above objectives:
• To maintain and enhance the ecosystem services of forests and grasslands for the benefit of present and future generations; efforts to conserve and restore forests and grassland in open woodland should be integrated.
• Regional and national assessments are needed to determine where and what kind of conservation and restoration should occur to strictly protect the remaining natural grasslands in open woodland, particularly high altitude grassland, from conversion into other types of land uses.
• The restoration of grassland open woodland should be involved by using planting of grasses and forbs.
• A further study of changes in herbaceous plants species in the long term of different tree species in open woodland is needed to understand ecological consequences of tree plantations and to promote sustainable management.
The authors would like to acknowledge the Oromia Agricultural Research Institute (OARI) for the financial support to this research and Fedis Agricultural Research Center (FARC) for providing logistical support during the sampling trips. We thank the Goro-Gutu district Agricultural Office for allowing us to conduct the study on their land. I am thankful to my advisor Proff. Tesema Zewdu for help in proposal writing, field data collection, laboratory works and final write up. I am also thankful to Haramaya University Herbarium and Plant Laboratories for their permission to examine herbarium specimens for plant identification.
Tolera Fikadu, is an associate researcher at Fedis Agricultural Research Center (Oromia Agricultural Research Institute). He has completed his master’s degree in Range Ecology and Biodiversity at Haramaya University in 2019. He has been conducting various research activities with Fedis Agricultural Research Center and published more than 10 publications. His research interests are on animal feed resources, soil chemical properties, plant ecology and biodiversity. He is currently involved as livestock process coordinator and also researcher under Animal Feed Resources and Rangeland Management research team.
Tesema Zewdu, is an Associate Professor at Animal and Range Science Department, College of Agriculture And Environmental Science, Haramaya University, Ethiopia. He has served as a reviewer of journal articles such as East African Journal of Science, Grassland Science (Japan), South Africa Journal Of Animal Production, Grass and Forage Science (UK: Blackwell publishing), Diversity (MDPIPublishing- Switzerland), Ethiopian Journal of Animal Production, and Environmental Management. He has been conducting various research projects with colleagues as part of the three pillars in Haramaya University (teaching, research and community service) and published more than 64 publications, of which more than 27 articles are in peer reviewed reputable international journals, and others book chapters and proceedings. He has also authored one sole book on Improved pasture production and in developing countries.
The research was funded/ supported by oromia agricultural research institute, ethiopia.
The authors declare that they have no competing interests
Journal of Biodiversity & Endangered Species received 624 citations as per Google Scholar report