Research - (2020) Volume 10, Issue 5
Received: 13-Jul-2020
Published:
27-Aug-2020
, DOI: 10.37421/2165-8064.2020.10.417
Citation: Md. Ershad Khan, Mustafizur Rahman, Maruf Ahmed, Khondoker Jashimul Islam Shuvo and MD Riasat Ahmed. Acid-Base Indicator Properties of Dye from Local Plant: The Rosella Calyces (Hibiscus Sabdariffa). J Textile Sci Eng 10 (2020) doi: 10.37421/jtese.2020.10.417
Copyright: © 2020 Ershad K, et al. This is an open-access article distributed under the terms of the Creative Commons Attribution License, which permits unrestricted use, distribution, and reproduction in any medium, provided the original author and source are credited.
Textile fabrics (woven or knitted) are subjected to strain both lengthwise and widthwise during fabric manufacturing. This strain is released while washing the fabric under relaxed conditions, resulting in a reduction in length and/or width of the fabric which is called shrinkage. Apparel made of such fabrics suffers shrinkage after washing and go out of fit. In order to eliminate or minimize such undesirable alternation, the fabric needs to be stabilized dimensionally. Commercially cotton woven fabrics are given an anti-shrinkage finish branded as "Sanforized". This study focused on sanforization of 100% cotton twill fabric. The effects of three variables namely damping percentage, machine speed, overfeed percentage on shrinkage imparted in the finished fabrics were investigated. Shrinkage imparted to the fabrics was increased with increasing in the variables specially overfeed% and damping. The increase in machine speed imparted less shrinkage.
Shrinkage • Overfeed • Sanforization • Box-behken
The dimensional stability of a fabric refers to its ability to resist a change in its dimensions. It is the extent to which a fabric keeps its original dimensions during and after the manufacturing process and when it is in use by the consumer. Poor dimensional stability of textiles affects fabric manufacturers, retailers, garment makers, and consumers.
Some fabric faults such as color loss or pilling can degrade the appearance of a garment but still leave it usable. Other faults such as poor abrasion resistance may appear late in the life of a garment and to some extent their appearance may be anticipated by judging the quality of the fabric. A recent survey of manufacturers rated shrinkage as one of the ten leading quality problems regardless of the size of the company [1]. There are many factors that relate to shrinkage. These include the fiber type, yarn size and type, construction variables, crimp in yarn, wet processes, finishing procedures, apparel manufacturing techniques [2].
Fabric shrinkage can cause problems at two main stages; either during garment manufacturing or during subsequent laundering by endusers resulting in misfit of garments and gives rise to a large number of customer complaints. The cotton woven fabric may be made shrink-proof by mechanical (Compacting, stentering, calendaring, sanforizing, etc.) and chemical (enzyme softeners and resin finish) finishing methods. Mechanical methods are ecofriendly. Sanforizing is the most effective mechanical finishing processes without any addition of chemicals to control shrinkage of fabrics in such a way that fabric will not shrink after washing. If fabric that doesn’t undergo sanforization and is considered raw is likely to shrink up to 10% on the initial wash. These dimensional changes can appear at an early stage in the life of a garment, hence making customer complaint more likely [3].
The term ‘shrinkage’ can simply be defined as a change in the dimensions of a fabric or garment. This dimensional change may be in a positive (growth or elongation) or negative (shrinkage) direction for fabric length, width and thickness. For a cotton fabric, shrinkage relates to the loss of the length and/ or width dimensions. Shrinkage can be further defined as a dimensional change in a fabric or garment caused by an application of a force, energy or a change in environment that either allows the fabric to relax or forces it to move in a given direction. Shrinkage at any step in processing is residual in nature. By definition, ‘residual’ is defined as ‘something that remains after a part is taken, a remnant, a remainder’. Poor control of these processing forces can lead to high garment shrinkage as the after effect. Woven fabrics are much more stable than knitted fabrics and do not react to stresses as severely. However, much lower shrinkage specifications are demanded of woven fabrics, thereby making the impact of processing stresses just as important for cotton woven fabrics as they are for knitted goods [4].
Sanforization is a controlled compressive shrinkage process in which fabric is caused to shrink in length by compression. In sanforizing process shrinkage is achieved by passing the cotton fabric onto a movable elastic rubber belt which assumes a shortened condition when relaxed. Thus the cotton fabric is forced to conform to this compression. The internationally well-known and most important shrinking process today dates back more than 70 years. Though the correct expression for this process is Controlled Compressive Shrinkage process in textile industry, the average person knows it as SANFORIZED. The process is a purely mechanical treatment without any addition of chemicals. The word SANFORIZED is derived from the first name of the inventor of the compressive Shrinkage process, Mr. Sanford Lockwood Cluett in 1930. Developed in the late 1920s by the American chemist Sanford Cluett and patented by Sanforize Co. in 1928, the process was reportedly first used by Erwin Mills in 1936 to make denim for overalls marketed under JC Penney's Big Mac label. Lee jeans were made from Sanforized fabric soon afterwards, but Levi's jeans remained shrink-to-fit for another three decades until the 1960s. The Sanforized Company, a division of Cluett Peabody & Co., Inc., New York, USA, is sole owner of the registered trademarks Sanforized, Sanfor and Sanforizado [5].
Fabric
100% cotton woven fabric was used in the current study. The specification of the fabric is listed in the Table 1.
| Weave | 2/1 Twill weave |
|---|---|
| Ends/Inch | 140 |
| Picks/Inch | 86 |
| Warp Yarn Count | 30 Ne |
| Weft Yarn Count | 30 Ne |
| Fabric Width | 62 Inch |
| Areal Density | 175 g/m2 |
Sanforizing machine
The sanforising process of the fabric was carried out in Sanforization machine (Manufacturer: Bruckner, Origin: Germany). The passage diagram of the sanforization machine is shown in Figure 1. The fabric shrinkage is carried out with several simple operations: the rubber belt pressed between the squeezing cylinder and the drum is stretched and, once out of this squeezing unit, it again takes its original shape. The fabric is made to adhere to the rubber belt in the squeezing area and, since it can slide more easily on the heated and mirror-polished surface of the drum than on the rubber one, it is forced to follow it during the subsequent shrinkage. The resulting effect is a continuous and steady sliding between the drum and the rubber belt and consequently between the drum and the fabric [6].

Figure 1. Process flow diagram of a typical sanforizing machine.
Experimental design
Box–Behnken experimental design was employed for this study which has been proved appropriate for fitting the quadratic surface [7]. Three important process variables (damping%, machine speed and overfeed%) selected for this study. Total 17 experimental runs were generated by Design Expert software (version 11) using the following formula :
N = K2 + K + CP (1)
Where, N represents total number of experiments, K is the number of variables, and CP is the number of replicate of center points.
The second-order equation was used to show the relationship between dependent and independent variables, and was given as:
Y = β0 + β1 X1 + β2 X2 + β3 X3 + β12 X1 X2 + β13 X1 X3 + β23 X2 X3 + β11 X12 + β22 X21 + β33 X32 (2)
Where, Y = the response variable; β0 =intercept, β1, β2, β3 = the coefficients of X1, X2 and X3; β12, β13, β23 = coefficients of cross products; β11, β22, β33 = coefficients of quadratic terms.
A positive sign in the equation represents a synergistic effect of the variables, while a negative sign indicates an antagonistic effect of the variables. The optimum values were obtained by solving the regression equation, analyzing the contour plot, and also by setting the constraints for the levels of the variables.
The upper and lower limits of process variables for warpwise shrinkage% and weftwise shrinkage are presented in Table 2.
| Factors | Range and level | ||
|---|---|---|---|
| -1 | 0 | 1 | |
| X1: Damping% | 15 | 30 | 45 |
| X2: Machine Speed (m/min) | 40 | 50 | 60 |
| X3: Overfeed% | 1 | 2 | 3 |
Measurement of residual shrinkage
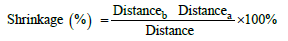
The residual shrinkage of the fabric was tested according to AATCC 135-2018 (Recipe mentioned in Table 3) using AATCC 1993 standard detergent in washing machine (Brand name: Electrolux Washcator, Manufacturer: James Heal, Origin: England) after the fabric is delivered in batcher [8]. The samples were dried in tumble dryer, conditioned in standard testing atmosphere for 4 hours and shrinkage was evaluated by the following equation 1 using shrinkage template (manufacturer: Testex, Origin: China).
| Chemical/Parameter | Amount |
|---|---|
| Standard detergent AATCC 1993 | 0.5 g/l |
| Time | 90 min |
| Temperature | 60°C |
 (1)
(1)
Where,
Distanceb = Distance between the marking point before wash.
Distancea = Distance between the marking point after wash.
Fitting the process model
The design matrix for real and coded values in Box-Behnken experimental design along with experimental and predicted values of warpwise shrinkage% and weftwise shrinkage% are shown in Table 4. The maximum shrinkage% were found 3.9% in run order 11 and 1.9% in run order 2 in warpwise and weftwise respectively (Table 4).
| Run Order | Real (Coded) Value | Warpwise Shrinkage % | Weftwise Shrinkage % | ||||
|---|---|---|---|---|---|---|---|
| X1 | X2 | X3 | Experimental | Predicted | Experimental | Predicted | |
| 1 | 15 (-1) | 40 (-1) | 2 (0) | 2.8 | 2.7375 | 1.8 | 1.74 |
| 2 | 45 (1) | 40 (-1) | 2 (0) | 3.1 | 2.9875 | 1.9 | 1.86 |
| 3 | 15 (-1) | 60 (1) | 2 (0) | 1.6 | 1.7125 | 1 | 0.9768 |
| 4 | 45 (1) | 60 (1) | 2 (0) | 1.8 | 1.8625 | 1.1 | 1.1 |
| 5 | 15 (-1) | 50 (0) | 1 (-1) | 1.4 | 1.4125 | 1.3 | 1.35 |
| 6 | 45 (1) | 50 (0) | 1 (-1) | 1.5 | 1.5625 | 1.5 | 1.48 |
| 7 | 15 (-1) | 50 (0) | 3 (1) | 3.3 | 3.2375 | 1.4 | 1.36 |
| 8 | 45 (1) | 50 (0) | 3 (1) | 3.5 | 3.4875 | 1.5 | 1.49 |
| 9 | 30 (0) | 40 (-1) | 1 (-1) | 2.1 | 2.15 | 1.75 | 1.8 |
| 10 | 30 (0) | 60 (1) | 1 (-1) | 1.2 | 1.075 | 1 | 1.03 |
| 11 | 30 (0) | 40 (-1) | 3 (1) | 3.9 | 4.025 | 1.7 | 1.81 |
| 12 | 30 (0) | 60 (1) | 3 (1) | 3 | 2.95 | 1 | 1.05 |
| 13 | 30 (0) | 50 (0) | 2 (0) | 2.85 | 2.85 | 1.5 | 1.42 |
| 14 | 30 (0) | 50 (0) | 2 (0) | 2.9 | 2.85 | 1.4 | 1.42 |
| 15 | 30 (0) | 50 (0) | 2 (0) | 2.8 | 2.85 | 1.4 | 1.42 |
| 16 | 30 (0) | 50 (0) | 2 (0) | 2.8 | 2.85 | 1.5 | 1.42 |
| 17 | 30 (0) | 50 (0) | 2 (0) | 2.9 | 2.85 | 1.4 | 1.42 |
The regression equation for the optimization of warpwise shrinkage% (Ywarp) as well as weftwise shrinkage% (Yweft) showed the relation with the damping% (X1), machine speed (X2) and overfeed% (X3). Box-Behnken model efficiently designed a second order response fit for the surface by these three factors.
As shown in Table 5, the quadratic model was found to be most suitable model for warpwise shrinkage among the four models studied here whereas linear model was found more suitable for the weftwise shrinkage%. The results indicated a close agreement between experimental and predicted warpwise shrinkage%.
| Shrinkage% | Source | Sequential p-value | Lack of Fit p-value | F Value | Adjusted R2 | Predicted R2 | |
|---|---|---|---|---|---|---|---|
| Warpwise | Linear | <0.0001 | 0.0018 | 50.6 | 0.9029 | 0.8766 | |
| 2FI | 0.9957 | 0.0009 | 0.0208 | 0.8746 | 0.7707 | ||
| Quadratic | 0.001 | 0.0235 | 19.05 | 0.9804 | 0.8773 | Suggested | |
| Cubic | 0.0235 | 10.33 | 0.9961 | Aliased | |||
| Weftwise | Linear | <0.0001 | 0.5135 | 126.48 | 0.9592 | 0.9415 | Suggested |
| 2FI | 0.8417 | 0.3793 | 0.2756 | 0.951 | 0.8879 | ||
| Quadratic | 0.1599 | 0.5705 | 2.34 | 0.9651 | 0.8958 | ||
| Cubic | 0.5705 | 0.7639 | 0.9611 | Aliased |
The predicted R2 warpwise shrinkage% is which is 0.8773 is in reasonable agreement with the Adjusted R2 of 0.9804; i.e. the difference is less than 0.2. On the other hand, the Predicted R2 of weftwise shrinkage% is 0.9415 which is also in reasonable agreement with the Adjusted R2 of 0.9592.
The tests for significance of the regression model were evaluated and the results of ANOVA tests are presented in Table 6.
| Shrinkage% | Source | Coefficient estimate | Standard error | F-value | P-Value |
|---|---|---|---|---|---|
| (probability>F) | |||||
| Warpwise | Intercept | 2.85 | 0.05 | ||
| X1 -Damping | 0.1 | 0.0395 | 6.4 | 0.0392 | |
| X2-Machine Speed | -0.5375 | 0.0395 | 184.9 | < 0.0001 | |
| X3-Overfeed | 0.9375 | 0.0395 | 562.5 | < 0.0001 | |
| X1 X2 | -0.025 | 0.0559 | 0.2 | 0.6682 | |
| X1 X3 | 0.025 | 0.0559 | 0.2 | 0.6682 | |
| X2 X3 | 0 | 0.0559 | 0 | 1 | |
| X12 | -0.325 | 0.0545 | 35.58 | 0.0006 | |
| X22 | -0.2 | 0.0545 | 13.47 | 0.008 | |
| X32 | -0.1 | 0.0545 | 3.37 | 0.1091 | |
| Weftwise | Intercept | 1.42 | 0.0136 | ||
| X1 -Damping | 0.0625 | 0.0198 | 9.93 | 0.0077 | |
| X2-Machine Speed | -0.3813 | 0.0198 | 369.43 | < 0.0001 | |
| X3-Overfeed | 0.0062 | 0.0198 | 0.0993 | 0.7577 |
By using ANOVA, the variation due to the treatment (change in the combination of variable levels) can be compared with the variation due to random errors inherent to the measurements of the generated responses. Linear coefficient of quadratic, interaction effects, and p-values are shown in Table 7. The larger F-values and the smaller p-values indicate a greater significance of the corresponding coefficients [9].
| Equation | R2 | Adjusted R2 | Predicted R2 | Adequate precision | SDa | CVb |
|---|---|---|---|---|---|---|
| Ywarp=2.85+0.1 X1-0.5375 X2+0.9375 X3-0.025 X1X2+0.025 X1X3-0.325 X12-0.2 X22-0.1 X32 | 0.9914 | 0.9804 | 0.8773 | 34.4026 | 0.1118 | 4.37 |
| Yweft=1.42059+0.0625 X1-0.38125 X2+0.00625 X3 | 0.9669 | 0.9592 | 0.9415 | 32.6115 | 0.0561 | 3.95 |
Adequate Precision measures the signal to noise ratio. A ratio greater than 4 is desirable. The ratio of 34.403 and 32.611 in warpwise shrinkage% and weftwise shrinkage% indicate an adequate signal. This model can be used to navigate the design space.
Effects of process variables
Figures 2a, 2b and 2c represent the effects of damping% (15%, 30% and 45%), machine speed (40 m/min, 50 m/min and 60 m/min) and overfeed% (1%, 2% and 3%) on the shrinkage% in both warp and weft direction. The maximum shrinkage % was observed in warp direction 3.9% at 30% damping, 40 m/min machine speed and 3% overfeed. On the other hand, maximum weftwise shrinkage was achieved at 45% damping, 40 m/ min and 2% overfeed% which is valued 1.9% shrinkage.

Figure 2. Contour plot showing the interactive effect of (a) damping % and machine speed (b) damping% and over feed% (c) machine speed and overfeed% on warpwise shrinkage.
From the contour plots of Figure 2, it can be concluded that machine speed and overfeed% are the most influencing factors among the three factors for warpwise shrinkage. In case of weftwise shrinkage only significant factor is machine speed as shown in Figure 3. This fact is also evident in 3D surface plots as shown in Figure 4 and 5.

Figure 3. 3D surface plot showing the interactive effect of (a) damping % and machine speed (b) damping% and overfeed % (c) machine speed and overfeed % on warpwise shrinkage.

Figure 4. Contour plot showing the interactive effect of (a) damping % and machine speed (b) damping % and overfeed % on weftwise shrinkage.

Figure 5. 3D surface plot showing the interactive effect of (a) damping % and machine speed (b) damping % and overfeed % on weftwise shrinkage.
Finally, optimized value of the three factors is and their results are graphically represented in Figure 6. The optimize parameters for the maximum shrinkage% in both warp and weftwise are 30.97 damping, 2.98% overfeed and 44.55 meters/min machine speed.

Figure 6. Optimized value of the damping%, overfeed% amad machine speed and their resultant warpwise and weftwise shrinakage.
The more shrinkage is controlled in the sanforization, the less shrinkage occurs after washing. In the sanforization process in this study shows the significant influences of the process parameters on shrinkage control of the woven fabric. But the influence machine speed had greater influence in shrinkage control in both warpwise and weftwise shrinkage control. The low machine speed results more effective shrinkage control. Suggested optimum speed is found around 45 m/min. Besides 31% damping and around 3% overfeed was suggested for optimum shrinkage control of 100% cotton fabric used in this study. Higher imparted shrinkage always expected to show lower residual shrinkage as desired.
The authors are very thankful to Hamid Fabrics Ltd., Narshingdi, Bangladesh for their permission to use their machines as well as material that were necessary for this research.
Journal of Textile Science & Engineering received 1008 citations as per Google Scholar report