Research - (2020) Volume 9, Issue 4
Received: 06-Aug-2020
Published:
19-Aug-2020
, DOI: 10.37421/2168-9679.2020.9.453
Citation: Jumanne M. Mnganga and Naboth Sindi Zachariah. Mathematical Model of Covid-19 Transmission Dynamics and Control Strategies. J Appl Computat Math 9 (2020) doi: 10.37421/jacm.2020.9.453
Copyright: © 2020 Mnganga JM, et al. This is an open-access article distributed under the terms of the Creative Commons Attribution License, which permits unrestricted use, distribution, and reproduction in any medium, provided the original author and source are credited
In this paper, we present a mathematical model of COVID-19 transmission dynamics and control strategies. The result reveal that the disease free equilibrium point exists and it is locally and globally asymptotically stable when the reproduction number is less than one unit and otherwise unstable when is greater than one unit. Simulation and discussions of a different variable of the model has been performed and we have compute sensitivity index of each parameter through sensitivity analysis of different embedded parameters. MATLAB of ode45 was employed perform numerical simulation analysis and the results show that there is importance of isolating infectious individual in an epidemic disease within the population.
Modeling • COVID-19 • Basic reproduction number • Sensitivity analysis • Simulation
The COVID- 19 pandemic is considered as the biggest global threat worldwide because of thousands of confirmed infections, accompanied by thousands deaths over the world. Notice, by July 8, 2020, report 11669259 confirmed cumulative cases with 539906 deaths; this is according to the report of World Health Organization (WHO) [1,2]. COVID-19 is an infectious disease caused by severe acute respiratory syndrome corona virus infection that can be found around the world. Even though no vaccine is available, COVID-19 continues to occur even in developed countries. The main symptoms of COVID-19 are Fever or chills, Cough, Shortness of breath or difficulty breathing, Fatigue, Muscle or body aches, Headache, New loss of taste or smell, Sore throat, Congestion or runny nose, Nausea or vomiting and Diarrhea [3]. Emergency warning sign for COVID-19 are Trouble breathing, Persistent pain or pressure in the chest, new confusion, Inability to wake or stay awake, Bluish lips or face [1,2]. COVID-19 virus is primarily transmitted between people through respiratory droplets and contact routes (objects or surfaces). Transmission occurs when a person will be close contact with infected person [3,4]. Therefore, transmission of the novel corona virus can occur by direct contact with infected people and indirect contact with surfaces in the immediate [2,5]. The disease has continued causing both economic and health problems to large population worldwide mostly affecting elders [6]. Due to these impacts, this study aims to develop a mathematical model of COVID-19 transmission dynamics and control strategies. The manuscript is organized by Description of variable, compartmental mathematical model of COVID-19, Existence of disease free equilibrium (DFE) point, the basic reproduction number (Ro), simulation of the mathematical model, and sensitivity analysis of each parameter involved in the model, conclusion and recommendation.
proposed compartmental diagram
The following is proposed compartmental diagram of COVID-19 transmission dynamics
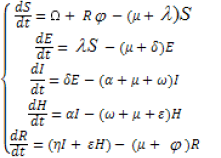
Based on the proposed compartmental mathematical model to describe the transmission dynamics of COVID-19. By taking into the account the localized well mixed population, there is demography, individual will become infected through direct contact with an infected individual and recovery individual will become infected again by corona virus [7]. The total population (N) is subdivided into five classes, these are, Susceptible (S), Exposed (E), Infected (I), Recovered (R) and Isolation (H). Also Death due to disease is represented by (ω), contact rate (λ), Natural mortality rate (μ), Probability of one infected individual (β), Rate at which infected individual become isolated (α), Rate at which insolated(H) individual become recovered (ε), The progression rate from exposed to infected (δ), Rate at which infectious(I) individual become recovered (η), Rate at which recovery individual become Susceptible (φ ). From compartmental diagram in Figure 1 above, the model take the following form of differential equations.

Figure 1. The model consists of five sub populations Susceptible (S), Exposed (E), Infected (I), Recovered (R) and Isolation (H) individuals in a population of N= S(t)+ E(t) + I(t) + H(t) + R(t) individuals.
 [01]
[01]
Whereby λ is the force infection given by λ=βci
The fraction of each compartment is given by 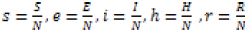
Positivity solution of the system
Consider the system of Eq. [01] above represents human population where by each equation has positive state of variables for all time.
Theorem: Let W be a positive region in 
 ; Then the solution of (s(t), e(t) , i(t) , h(t) , r(t)) of non linear differential equation system in [01] above are positive for all t≥0
Proof.
Consider the system in Eq. [01] above.
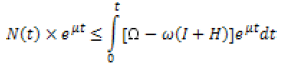
By using the integrating factor, without loss of generality we get
Therefore, the system of differential equation is positive since the condition is hold.
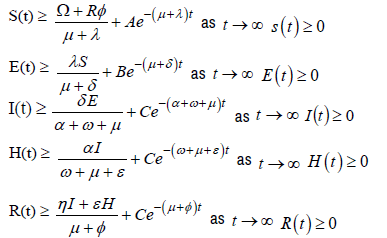
Bounded solution of the system
Theorem: The solution s(t), e(t) , i(t) , h(t) , r(t) of the system in the equation [01] above are bounded in the subset.
Proof.
We need to show all feasible region are bounded in the subset N(t)
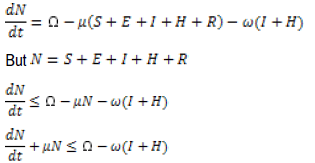
By using integrating factor,
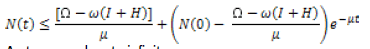
As t approaches to infinity
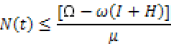
Therefore all solutions of the system are bounded, then mathematically and epidemiologically useful.
Disease free equilibrium points are steady state solution whereby there is no disease. At this state; an individual has no virus in the body.
The disease free equilibrium of the model system of differential equation [01] above is calculated by setting the system [01] equal to zero.
In case there is no disease that means that I=0, H=0 and E=0 and the point D(S0,R0,I0,E0,H0) exist then, the disease free equilibrium point is given by D(S0,I0,E0,F0,H0 ,R0)=(1,0,0,0,0)
The basic reproduction number
The basic reproduction number has been widely used in infection models and is defined as the average number of secondary cases arising from a single primary case in a very large population of susceptible [8]. In this paper the basic reproduction number is computed by using a next-generation matrix. To calculate the next generation matrix for the SEIHR model, we need to consider new infections can arise and the number of ways that individuals can move between compartments. In our model we have three infected compartments (E, I and H).
The jacobian matrices associated to the rate of new infectious and the net rate out the corresponding compartment is given by
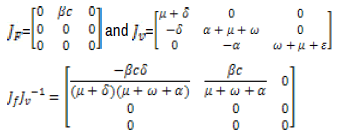
The basic reproduction number is obtained as absolute value of spectral radius JfJv-1 which is given by.
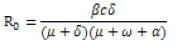
Therefore the basic reproduction number Ro is given by
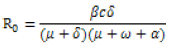
For the parameter used in our model we compute the basic reproduction number we obtain R0=0.006544 this implies that the epidemic disease outbreak can be easily identified and control measures effectively designed by any Government Authorities, since R0<1, the disease will die out of the population as the Disease Free Equilibrium (DFE) is stable.
Numerical Simulation
Numerical simulation of the system of differential equation [01] were carried out by sing MATLAB inbuilt function code 45. We perform numerical simulation of mathematical model of COVID-19 transmission dynamics and control strategies where by the aim is to assess the response of model parameters on the transmission dynamics of the disease and analytical results are shown by using graphical representation. Most of the numerical values of parameters are estimated and other numerical values are obtained from other sources. The following Table 1 describes the parameters used in our model Figure 2 is our SEIHR model which show the graph of combination of all variables (Susceptible (S), Exposed (E), Infected (I), Recovered (R) and Isolation (H)) against time (years). From the figure 2 show that COVID-19 model provides the illustration for control strategies and minimization of the transmission dynamics of COVID-19. We can observe that recovered individuals can be increased by increasing provision of Isolation for infected individual with epidemic disease and this reduce the susceptible and infectious individuals in the population.
| Parameters | Description | Numerical Value | SOURCE |
|---|---|---|---|
| ω | Death due to disease | 0.125 per year | [4] |
| c | Per capita contact rate | 0.09091 per year | [15] |
| δ | The progression rate from exposed to infected | 0.25 per year | [3] |
| µ | Natural mortality rate | 0.00875 per year | [15] |
| β | Probability of one infected individual | 0.08-0.8 per year | [10] |
| λ | Force of infection | 0.01 per year | [9] |
| α | Rate at which infected individual become isolated | 0.94 per year | Estimated |
| ε | Rate at which insolated individual become recovered | 0.27 per year | Estimated |

Figure 2. Graph of the combination of SEIHR.
We computed sensitivity analysis on R0 with respect to parameters in order to know the importance of different parameters on disease transmission. Sensitivity analysis is extremely important for mathematical models. Sensitivity analysis studies the variation of the outputs of a model caused by variations in the inputs. Sensitivity analysis help to check which parameter has high effect or impact on the reproduction number R0 [9-14].
The sensitivity is computed by finding the derivatives of each variable with respect to each parameter at any time t. The sensitive number was calculated using the formula of the normalized forward sensitivity index below,
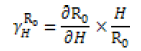
Whereby H is the parameters in the reproduction number.
From the Table 2 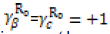 this implies that an increase (decrease) in β or c will cause increase (decrease) of the same proportion in R0. Therefore β or c they are directly proportional to R0. Therefore, to eradicate
COVID-19 transmission in a population, this study recommends that Isolation
should be implemented so as to reduce the rate of an individual to be infected
hence will reduce transmission of COVID-19.
this implies that an increase (decrease) in β or c will cause increase (decrease) of the same proportion in R0. Therefore β or c they are directly proportional to R0. Therefore, to eradicate
COVID-19 transmission in a population, this study recommends that Isolation
should be implemented so as to reduce the rate of an individual to be infected
hence will reduce transmission of COVID-19.
| Parameter | Sensitivity Index |
|---|---|
| δ | 0.00338175 |
| β | +1 |
| c | +1 |
| µ | -0.00875029 |
| α | -0.008755 |
| ω | -0.0198 |
Our model SEIHR indicated the diminishing of the spread of COVID-19 virus disease this is due to the fact that the basic reproduction number is less that 1 that is (R0 < 1). The basic reproduction number was computed by using next generation matrix and stability analysis was performed and the results reveal that the disease free equilibrium is locally and globally stable. Also our results from simulation reveal that large number of infectious depends on the contact rates (c=+1 ) with infected individuals. Also large numbers of infected and exposed are transferred into recovered and also infected individual within the population (N) are decreasing steadily due to self isolation. Eradication of COVID-19 has remained one of the biggest challenges facing world. Therefore there is an urgently need for any scientist to come up with another new control strategies and more efficient ones to fight the spread of the disease in the world. From the results of this paper the following are the control strategies:
i. Since our model SEIHR shows that the spread of the disease largely depend on the contact rate, therefore effort should be made to minimize unnecessary contact with COVID-19 infected individuals, this will reduce an outbreak.
ii. If there is neither medicine nor vaccination available, it’s only possible to reduce the infection rate by appropriate measures such as social distancing and isolation. This will reduce contact rate that will minimize the infection of individuals with the population.
Journal of Applied & Computational Mathematics received 1282 citations as per Google Scholar report