Research - (2022) Volume 13, Issue 12
Received: 02-Dec-2022, Manuscript No. jbmbs-22-79491;
Editor assigned: 05-Dec-2022, Pre QC No. P-79491;
Reviewed: 16-Dec-2022, QC No. Q-79491;
Revised: 17-Dec-2022, Manuscript No. R-79491;
Published:
28-Dec-2022
, DOI: 10.37421/2155-6180.2022.13.145
Citation: Kuntoro, Kuntoro. “K-Nearest Neighbours and K-Fold Cross Validation for Big Data of Covid 19.” J Biom Biosta 13 (2022): 145.
Copyright: © 2022 Kuntoro K. This is an open-access article distributed under the terms of the Creative Commons Attribution License, which permits unrestricted use, distribution, and reproduction in any medium, provided the original author and source are credited.
The most popular model in machine learning is K-Nearest Neighbours (KNN). It is used for solving classification. Moreover, K- Fold Crossvalidation is an important tool for assessing the performance of machine learning in doing KNN algorithm given available data. Compared to traditional statistical methods, both algorithms are effective to be implemented in big data. A supervised machine learning approach using KNN and K- Fold Cross- Validation algorithms is implemented in this study. For learning process, data of covid 19 is obtained from website. Four predictors such as new case, reproduction rate, new case in ICU, and hospitalized new case are selected to predict the target, new cases will be alive or will die. After cleaning process, 13,223 of 132,645 data sets are selected. This is considered as original data sets. When K-Fold Cross-Validation is executed by Python showing User Warning, the original data sets are replicated to be 264,441 data sets. This is considered as replicated data sets. Performance of KNN algorithm in predicting the target using original data sets shows lower accuracy than that using replicated data sets (75% vs. 92%). The number of members (K) using original data sets is lower than that using replicated data sets (7 vs. 12). Performance of K-Fold Cross-Validation using original data sets shows very small mean accuracy than that using replicated data sets (0.054 vs. 0.998). In using replicated data sets, mean accuracy shows consistent value until 5 splits while in using original data sets mean accuracy only shows in 2 splits. In using big data from various sources, it is recommended to implement appropriate Python libraries which can remove not a number (nan) and messy record effectively. It is also recommended to develop combine and comprehensive algorithm of KNN and K-Fold Cross-Validation.
Machine-learning • KNN • K-Fold Cross-Validation • Accuracy
The most popular model in machine learning is K-Nearest Neighbours (KNN). It is used for solving classification McCullum [1]. Moreover, KNN model has similarity with regression model in classification. Both models can be used for prediction. Regression model particularly logistic regression model predicts categorical variables via classification. In classification, KNN model splits the data into training, validation, and test sets. This is the basis for prediction in KNN model. Compared to traditional statistical method, KNN model is more effective in big data for predicting dependent variable. The K- Fold Cross validation is an important tool for assessing the performance of machine learning in doing KNN algorithm given available data. According to Lei J [2], for model and tuning parameter selection, K-Fold Cross-Validation is one of the most well-known methods. This method is useful for statistics and machine learning. However, K-Fold Cross-Validation is more effective than traditional statistical methods when big data is implemented in parameter selection. Moreover, the basic idea of K- Fold Cross-Validation is to fit and evaluate each candidate model on separate datasets. Then, performance evaluation is unbiased. Covid 19 cases that threat people globally make countries collect nationwide data daily. Each country has big data of covid 19 cases. The quality of big data in each country depends on the quality of officers who manage the data. Hence, KNN and K- Fold Cross-Validation are expected to help in assessing how good big data has been collected.
Theoretical frame work
Fix E and Hodges JL [3] first developed K-Nearest Neighbours (KNN) algorithm. It is included in a non-parametric classification method in statistics. Then Cover T and Hart P [4] expanded this method. It is used for classification and regression. In both methods, the input consists K-closest training examples in a data set. The output depends on whether KNN is used for classification or regression. Moreover, in KNN classification, the output is a class membership. An object is classified by a plurality vote of its neighbours, with the object being assigned to the class most common among its KNN (K is a positive integer, typically small). If K=1, then the object is simply assigned to the class of that single nearest neighbour. Furthermore, in KNN regression, the output is the property value for the object. This value is the average of the values of KNN.
Concept of classification
A prediction can be made based on current situation and past experienced as well. When a categorical class called a label is to be predicted given a number of variables called features, then we deal with classification. Moreover, an observation is assigned by a classifier with unknown class to a class based on similarity to other observations which are known their classes. Furthermore, observations whose classes are known which are used as basis for prediction are called data training sets. We use this data to train or teach our 3 classifier. Then the classifier is used for prediction of new data that is not known its class [5].
Classification with K-Nearest neighbours (KNN)
A classification algorithm is needed to make prediction for new observation. Then we use KNN classification algorithm. By this algorithm we want to find the K – Nearest or K-Most similar observations in our data training set. The results are used to make prediction for the new observation [5]. Concept of KNN can be explained by (Figures 1 and 2) as follows. Suppose an individual is classified into diseased (red dot) or healthy (green dot) individual based on Euclidean distance of two variables let say var1 and var2. A new observation called unknown diagnosis (blue dot) is decided whether it is classified into diseased or healthy individual depending on the closeness to diseased or healthy one. The closeness is measured by Euclidean distance. The KNN to a new observation is obtained by calculating the distance from new observation to each observation in training data. Then select the K – observations which have smallest distance values. Suppose we want to use K=5 neighbours to classify a new observation with certain values of two variables let say var1 and var2 shown as blue dot in (Figures 3 and 4). Then we calculate the distance between new observations to each observation in the training set. Moreover, we find K=5 neighbours which are nearest to new observation [5].

Figure 1. Scatter plot of diseased and healthy individuals based on two variables with a new observation (Modified from Timbers, et al. (2021)).

Figure 2. The closeness of a new observation to diseased individual or healthy individual (Modified from Timbers, et al. (2021)).

Figure 3. Confusion matrix (Source: Data to Fish, 2021).

Figure 4. Preparing libraries, importing, standardizing, training - testing data sets, and classifying.
This is the equation for calculating distance.
 ……… (1)
Where p and q are two different observations, each has predictor variables var1 and var2. Moreover, p var1 and q var2. are the values of var1 for observations p and q. Furthermore, p var2 and q var2 are the values of var2 for observations p and q.
Cross-Validation
Suppose  is the data drawn independently from a
common distribution P on Rpx R that satisfies (Lei, 2020)
is the data drawn independently from a
common distribution P on Rpx R that satisfies (Lei, 2020)
y1= f x +∈i……………………………………………………… (2)
In which f : Rp → R is an unknown function and ∈ satisfies E(∈| X ) = 0 Moreover, we want to approximate f in such a way that the value of Y can be predicted for future observation of X. Furthermore, f is an estimate of f . Then the quality of ^f is evaluated by the predictive risk as follows Lei J [2].
 …… (3)
In which (X ,Y) is a future random drawn from P, while  is a loss
function. Furthermore, the square loss
is a loss
function. Furthermore, the square loss  is a typical example of Lei J [2].
Validation by sample splitting can be implemented by using a unified notation for tuning parameter selection and model selection as well. Moreover, given a finite set of candidatesM = {1,2,,,,M}, in which the meaning of each m∈M can be a model or a tuning parameter value that depends on the context. Furthermore, we can estimate f by f for each m∈M using an estimating procedure specified by m .
Precision, recall, and F1 score
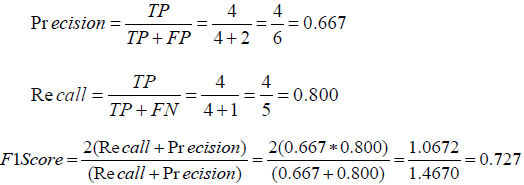
A classification report is part of classification algorithm like KNN. It is used to measure the quality of prediction concerning the number of predictions which is true or false. Predicting the metrics of a classification report uses true positives, false positives, true negatives and false Negatives. Precision is the ability of a classifier not to label an instance to be positive which is actually negative. For each class it is defined as the ratio of true positives to the sum of true and false positives [4]. The equation of precision is described as follows.
 …………………. (4)
In which TP is the number of True Positives and FP is the number of False Positives in a confusion matrix as follows.
Recall is the ability of a classifier to find all positive instances. For each class it is defined as the ratio of true positives to the sum of true positives and false negatives [6]. The equation of recall is described as follows.
 ……………………………(5)
In which TP is the number of True Postives and FN is the number of False Negatives in a confusion matrix mentioned above. The F1 score is a weighted harmonic mean of precision and recall such that the best score is 1.0 and the worst score is 0.0. Generally speaking, F1 scores are lower than accuracy measures as they embed precision and recall into their calculation. As a rule of thumb, the weighted average of F1 should be used to compare classifier models, not global accuracy [6]. The equation of recall is described as follows.
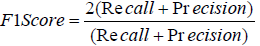 (6)
(6)
Using figure 3 we can calculate precision, recall, and F1 score
A supervised machine learning approach using KNN and K-Fold Cross- Validation is implemented in this study. For learning process, data sets of covid 19 is obtained by downloading in website as follows. https://github.com/owid/ covid-19-data/blob/master/public/data/latest/owid-covid-latest.csv Size of data sets is 132,645. Four variables, X are selected for KNN modelling, these are new case, reproduction rate (reprate), new case in ICU (Intensive Care Unit) or icu, and hospitalized new case (hosp). These variables are considered as predictors (X) used for predicting dependent variable (Y) as target. After data cleaning process, the complete data sets are to be 13,223. This data is stored in folder D of computer in csv format with name covid 251121ver13.csv. For KFold Cross-Validation, variable names (new case, reprate, icu, and hosp) and class column are deleted and the file is stored as covid251121cvver13.csv. Then data sets reduce to be 13,222.
The steps for implementing KNN are as follows Zach [7]. First, downloading data sets from website mentioned above. Second, loading Python libraries such as Numpy, Pandas, Scikitlearn. Third, importing data sets into Python script using Pandas library with code df=pd.read_csv('D:\covid251121ver13. csv'). Fourth, standardizing data sets to adjust all X values in order to have the same scale to make better prediction. Fifth splitting data sets into training data and test data. Sixth, predicting the target (Y) with a KNN algorithm. Seventh, measuring accuracy of the model. The steps for implementing K-Fold Cross- Validation are as follows McCullem N [1]. First, loading Python libraries such as Numpy, Pandas, Scikit-learn. Second, importing data sets into Python script using Pandas library with code df=pd.read_csv ('D:\covid251121cvver13.csv'). Third, performing K-Fold Cross-Validation in K-Fold Cross-Validation, when User Warning appears, which means the least populated class in y has only 1 member, which is less than n_splits=2, we replicate data sets nearly 20 times to be 264,441 data sets. Then we use n_splits=2, 3, 4, and 5.
K-Nearest neighbours for data sets with size 13,223
In implementing Python, preparing libraries is essential, these are Pandas, Numpy, and Scikit learn. Pandas is needed for importing data sets which is placed in folder of computer to Python script. Numpy is needed for numerical operation. Scikit-learn are needed when we use supervised machine learning. All data sets should be numbers not character symbols. It should be converted into number 1 or 0. All data sets should have the same scale. Hence, standardization is a step of implementing KNN to overcome these problems. Scikit-learn library provides standardization of data sets. Data sets which meet requirements enter further step, data training, data validating, and data testing. We split data sets into two parts, training data dan test data. We choose 30% of data sets as training data, the rest as test data. Scikit-learn library provides splitting data sets into both data [7,8]. Further step we classify data sets into class with, one member, 2 members, 3 members, 4 members etc. based on distance closeness. The number of member is called K, in which K=1, 2, 3, 4, …… This is a basic concept of KNN. Scikit-learn library provides this process.
The last step is to predict target, Y (1=covid 19 cases who will be alive or 0=covid 19 cases who will die) based on a number of predictors X, new case, reprate, icu, and hosp using KNN model. Accuracy in prediction is measured by root mean squared error (rmse) for every number of class membership in K=1, 2, 3, ………., 20. The results are plotted in a graph of rmse on different K. The highest rmse occurs in K=1 that means each class has one member. The value of rmse is 0.49499639066447704. As K increases to K=7 then rmse decreases. The lowest rmse occurs in K=7, in which each class has seven members. The value of rmse is 0.4035386704306. When K=8 to K=20 rmse increases, except in K=11 rmse is lower than rmse in K=10. We select maximum number of K is equal to 20 in which rmse is 0.4115685931061294. We omit K=1 with the highest value of rmse because we do not want each class only has one member. In this study, it is better to select K=7 in order to obtain the lowest value of rmse. In this case each class has seven members, the optimum number of members that gives the lowest value of rmse or the lowest error in prediction for KNN model. In (Predicting KNN model 7) shows plot of rmse on various values of K. In the beginning when K=1 rmse is high then rmse decreases sharply until the lowest value of rmse that occurs when K is equal to 7. Then rmse increases gradually until K is equal to 20 (Figures 5-7).

Figure 5. Predicting KNN model.

Figure 6. Predicting KNN model (continued).

Figure 7. Plotting rsme on various K values.
Classification report and confusion matrix
In KNN model classification report, the results display accuracy, precision, recall, F1 score according to target is equal to 0 that means prediction of covid 19 cases will die and target is equal to 1 that means prediction of covid 19 cases will be alive given a number of predictors new case, reprate, icu, and hosp.(Figure 8 and 9) shows that in predicting covid 19 cases will die have precision, recall, and F1 score respectively 0.63, 0.63, and 0.63 while in predicting covid 19 cases will be alive have precision, recall, and F1 score respectively 0.81, 0.81, and 0.81. Calculating the average of target, each of precision, recall, and F1 score has value 0.72, while in calculating the weighted 10 average of target, each of precision, recall, and F1 score has value 0.75. Weighted average is calculated by considering the proportion of sample size in each class target (0,1). The average accuracy of KNN algorithm is 0.75 or 75%. It is obtained in K=7 and the smallest rmse 0.4035386704306. In predicting target or variable Y (covid 19 will be alive or will die) given predictors new case, reprate, icu, and hosp, KNN algorithm shows good performance with average accuracy 75%.

Figure 8. Process of classification report.

Figure 9. Accuracy, precision, recall, and F1 score.
K-Fold Cross-Validation for data sets with size 13,222
(Figure 10) explains that we need to prepare Pythom libraries such as Pandas, Numpy, and Skicit-learn. The next step we import csv formatted file, covid261121cvver13, csv from folder D of computer. Then we clean datasets from non a number (nan) as requirement for further analysis. The following step is to perform K-Fold Cross-Validation. In this step, first of all we define predictors, X and response variable, Y. Second, we build model K Neighbours Classifier. Third we define cross-validation method. (Figure 11) shows mean and standard deviation of accuracy are respectively 0.054 and 0.001. Mean of accuracy is too small although its standard deviation is too small. Small of standard deviation means accuracy across testing is stable. Mean of accuracy too small because the least populated class in response variable, Y has only one members, which is less than n_splits=2. We already have 13,223 records in original data sets. We try to increase the number of records almost 20 times to be 264,441 as replicated data sets. Then we cross-validate again. These are the results.

Figure 10. Preparing libraries, importing, cleaning non a number (nan), performing cross validation.

Figure 11. Mean and standard deviation of accuracy.
K-Fold Cross -Validation for data sets with size 264,441
(Figures 12 and 13) show that by increasing data set almost 20 times, the mean and standard deviation of accuracy respectively 0.998 and 0.000 by splitting data set into 2 parts. Then we split data into 3, 4, and 5 parts. The mean and standard deviation of accuracy are the same. By splitting data set into 2, 3, 4, and 5 parts, each accuracy is high with no variation.

Figure 12. Mean and standard deviation of accuracy for n_splits=2.

Figure 13. Mean and standard deviation of accuracy for n_splits=3, 4 and 5.
K-Nearest neighbours for data sets with size 264,441
The highest rmse occurs in K=1 that means each class has one member. The value of rmse is 0.28039074233295097. As K increases to K=12 t hen rmse decreases. The lowest rmse occurs in K=12, in which each class has twelve members. The value of rmse is 0.20697044925406405. Then K=13 to K=20 rmse increases. We select maximum number of K is equal to 20 in which rmse is 0.23044759082966193. We omit K=1 with the highest value of rmse because we do not want each class only has one member. In this study, it is better to select K=12 in order to obtain the lowest value of rmse. In this case each class has twelve members, the optimum number of members that gives the lowest value of rmse or the lowest error in prediction for KNN model (Figures 14 -16). Shows plot of rmse on various values of K. In the beginning when K=1 rmse is high then rmse decreases sharply until the lowest value of rmse that occurs when K is equal to 12. Then rmse increases gradually until K is equal to 20.

Figure 14. Preparing libraries, importing, standardizing, training - testing data set, and classifying.

Figure 15. Predicting KNN model.

Figure 16. Plotting rsme on various k values.
Classification report and confusion matrix
In KNN model classification report, the results display accuracy, precision, recall, F1 score according to target is equal to 0 that means prediction of covid 19 cases will die and target is equal to 1 that means prediction of covid 19 cases will be alive given a number of predictors new case, reprate, icu, and hosp. (Figures 17 and 18) show process of classification report (Figure 8). (Figure 18) shows that in predicting covid 19 cases will die have precision, recall, and F1 score respectively 0.89, 0.89, 0.89. These values are higher than the values in (Figure 9). These values increase when size of data sets increases. Moreover, predicting covid 19 cases will be alive has precision, recall, and F1 score respectively 0.94, 0.94, 0.94. Again, these values are higher than the values in (Figure 19). These values increase when size of data sets increases. Calculating the average of target, each of precision, recall, and F1 score has value 0.91, while in calculating the weighted average of target, each of precision, recall, and F1 score has value 0.92. Weighted average is calculated by considering the proportion of sample size in each class target (0, 1). Compared to original data sets, replicated data sets gives higher average accuracy (92% vs. 75%) more members of class (12 vs. 7), and less rmse (0.20697044925406405 vs. 0.4035386704306). Hence, increasing size of data sets will increase the performance of KNN algorithm in predicting target or variable Y.

Figure 17. Process of classification report.

Figure 18. Accuracy, precision, recall, and F1 score.

Figure 19. KNN and K-Fold cross-validation (Source: Scikit learn, 2021).
The K Fold Cross-Validation using replicated data sets compared to original data sets gives higher mean accuracy and lower standard deviation (0.998 and 0.000 vs. 0.054 and 0.001). The number of class to be splitted in replicated data sets is more than original data sets (2, 3, 4, 5 vs. only 2). Original data sets can only be splitted not more than 2. Original data sets will give smaller members in each class. When in a class has only one member which is less than minimum n_split=2, it will give less performance of K-Fold Cross-Validation indicated by smaller mean accuracy. However, K-Fold Cross- Validation as supervised machine learning still gives good performance in variability perspective indicated by small standar deviation. The KNN and K-Fold Cross-Validation algorithms do not give similar results although their performances are evaluated in the same data sets. However, the results of both algorithms are in line. In higher size of data sets both give in line performance in accuracy perspective. In KNN algorithm variable names such as new case, reprate, icu and hosp to be included in data sets and we should add class column for placing target to be predicted. In K-Fold Cross Validation algorithm variable names should be deleted so that size of data sets is reduced one and no additional class column [9,10].
Figure 19 shows the relationship between KNN and K-Fold Cross- Validation algorithms. As supervised machine learning, both algorithms work in their own ways that need partly the same Python libraries and partly the different Python libraries depending on the requirements. Functionally both algorithms have relationship in which K-Fold Cross-Validation reinforces KNN performance. Moreover, a best parameter obtained from K-Fold Cross- Validation is used to retrain the model. That means performance of both algorithms are in line. Better performance of K-Fold Cross-Validation will result in better performance of KNN. A challence for algorithm developers for merging both algorithms in one entity algorithm by considering strength and weakness of each algorithm.
Performance of KNN algorithm in original data sets shows good average accuracy 75%, while performance of KNN in replicated data sets shows better average accuracy 92%. The optimum class members using original data sets are K=7, while the optimum class members using replicated data sets are higher, K=12. Performance of K- Cross-Validation algorithm in original data sets shows very small mean accuracy 0.054, while performance of K-Cross- Validation in replicated data sets shows very high mean accuracy 0.998 and very small standard deviation accuracy 0.000. When using big data from various sources it is recommended to apply supervised machine learning with appropriate Python libraries which have high performance in eliminating non a number (nan) and messy data sets. It is recommended to develop combined and integrated KNN and K-Fold Cross-Validation algorithm which can reinforce the weakness of each algorithm.
Google Scholar, Crossref, Indexed at
Google Scholar, Crossref, Indexed at
Google Scholar, Crossref, Indexed at
Journal of Biometrics & Biostatistics received 3496 citations as per Google Scholar report


