Research Article - (2023) Volume 14, Issue 3
Received: 27-Apr-2023, Manuscript No. hycr-23-97153;
Editor assigned: 29-Apr-2023, Pre QC No. P-97153;
Reviewed: 11-May-2023, QC No. Q-97153;
Revised: 17-May-2023, Manuscript No. R-97153;
Published:
25-May-2023
, DOI: 10.37421/2157-7587.2023.14.457
Citation: Ebodé, Valentin Brice, Jean Guy Dzana, Etienne Merlin Salvador Mewassi Aboui and Raphael Onguéné, et al. “Hydrological Variability in a Forest Watershed Undergoing Accelerated Urbanization: The Case of Mefou (South Cameroon).” Hydrol Current Res 14 (2023): 457.
Copyright: © 2023 Ebodé VB, et al. This is an open-access article distributed under the terms of the Creative Commons Attribution License, which permits unrestricted use, distribution, and reproduction in any medium, provided the original author and source are credited.
Climate change and variability and anthropogenic forcings such as land use change are the main forcings of river discharge variability. However, understanding their simultaneous impact on river discharge remains limited in some parts of the world like in central Africa. To shed light on this issue, this article has as objective to investigate the impact of rainfall variability and land use changes on river discharge in the Mefou basin over the recent period (1963-2018). To achieve this goal, hydrometeorological data of this basin were analyzed using the Pettitt and Mann Kendall tests. Likewise, land use changes were also analyzed using supervised classifications of Landsat satellite images over the period (1973-2018). Average and extreme flows of Mefou river have increased since 1985-86, unlike the rainfall, which generally decreased for all seasons from the 1970s, apart from summer, where the reverse was observed. Changes in land use (increase impervious areas and a decrease in forest and water bodies) seem to be the main cause of the increase in runoff observed. The rainfall plays an essentially amplifying role in the increase in discharge in the seasons during which they occur. These results could be useful for the improvement of future simulations of the Mefou river flow.
Climate variability • Land use modes • Discharges • Anthropization • Mefou • South Cameroon
Changes in rivers generally result from interactions between climate variability/change and or anthropization [1]. It is however, recognized that their sensitivity to these factors also depends on the natural predispositions (size, slope system, type of soil, etc.) of their watersheds [2].
Most of time, changes in hydrological regimes are only examined through rainfall-discharges relationships [3,4]. Few authors in sub-Saharan Africa for example D'Orgeval and Polcher J, et al. [5] and Bodian A, et al. [6] have assessed the hydrological impacts of human-induced environmental changes. Likewise, studies that attempted to dissociate the latter from those arising from exclusively hydro-climatic fluctuations are quantitatively limited in Central Africa [7,4]. However, there is no doubt that anthropogenic actions through urbanization and industrial agriculture, which have resulted in largescale deforestation, have increased considerably over the past thirty years throughout Sub-Saharan Africa and even beyond.
The work devoted to investigating the impact of rainfall on discharge in sub-Saharan Africa, has been ongoing since the 1980s [8]. Studies correlating precipitation and discharge are based on the detection of ruptures in the hydrometeorological series. Results from those studies confirm in the case of West Africa that the 1970s appear to be the main period of discontinuity marking the onset of hydroclimatic drought in the region [9,10]. In Central Africa, fluctuations in river discharges and rainfall have been observed at seasonal [11] and annual [12] time scales. Liénou G, et al. [13] demonstrated in the case of three equatorial rivers Ntem, Nyong and Kienke that the most significant climatic variations leading to changes in river discharge result from variations in rainfall during the dry season. The authors explain the sensitivity of the studied basins to rainfall variability by the fact that their reduction induces a significant deficit in soil moisture and groundwater storage resulting in a decrease in river discharge. Conversely, an increase in soil moisture during the dry season therefore enhances discharge at the start of the rainy season. It appears that the variability of discharge regimes of equatorial rivers can be better appreciated when rainfall of these seasons is considered. Concerning the impact of land use change on river discharge, previous studies have used supervised classifications of satellite images using at least two dates, to assess the dynamics of land use and its impact on river dis-charge [4,14,15]. Their results confirm an increase in discharges following an increase in impervious surfaces (buildings, roads and cultivated areas).
Beyond the climate change that is currently raging throughout Central Africa [4], the studied basin (Mefou) has experienced accelerated and uncontrolled urbanization through an excessive spatial extension of the Yaounde city, whose population has multiplied by 10 in about thirty years, from 50 000 in 1957 to 1 500 000 in 2008. Today it is estimated at 2 500 000 inhabitants. Projections predict that it will exceed 3 000 000 by 2030 (BUCREP 2010). This population growth which has as corollary the increase in impervious areas, has probably caused a change in the rainfall-runoff relationship, which requires a new study of hydrological variability.
The main objective of this study is to investigate the impact of precipitation variability and land use change on the hydrological dynamics of the Mefou river. Considering that few studies have attempted to investigate the impact of rainfall variability and land use change on river regimes in Central Africa, this paper contributes to this debate by focusing our analysis on the Mefou river basin in South Cameroon, which is representative of Central African basins under the sub-equatorial Atlantic climate. It appears fundamental for this basin in which the political capital of the country is located and where many socio-environmental problems are observed, in this case, floods. Such a study has never been conducted in this basin before. In addition, the data and new entrants would help in the long-term planning of water demand and use as well as improve future simulations of the flow river.
Study area
The study focuses on Mefou watershed (428 km2). This basin is located in South Cameroon, within the Central African sub-region, between latitudes 3°43′ N and 3°58′ N, and longitudes 11°21′ E and 11°35′ E (Figure 1). It belongs to the sub-equatorial domain, with abundant annual precipitation (around 1600 mm/year), spread over four seasons of unequal importance. Two of them are dry (summer and winter) and two are rainy (spring and autumn). The studied basins are dissected by deep gullies cut into hills with convex slopes and wide marshy valleys. Their geological substratum is made up of a granito–gneissic base on which ferralitic soils (on the summits and slopes) and hydromorphic soils (in the shallows) develop. The vegetation in the area is a dense semi-deciduous forest, with Sterculiaceae and Ulmaceae, which is subject to anthropogenic pressure [16].

Figure 1. Location map of Mefou watershed at Nsimalen outlet.
Data sources
The rainfall data used in this work came from the Climate Research Unit (CRU) of the University of East Anglia in the United Kingdom. These data have been available since 1901, via the site https://climexp.knmi.nl/selectfield_obs2. cgi?id=2833fad3fef1bedc6761d5cba64775f0/ in NetCDF format, on a monthly time step and at a spatial resolution of 0.25° × 0.25°.
The Mefou flow series comes from the CRH (Hydrological Research Center). It was incomplete during the 1980s and 1990s. Indeed, after 1987, due to budgetary constraints, the hydrological service no longer guaranteed the continuity of observations. We then note the abandonment of most of stations observed, including that of the basin studied.
The spatial data used to analyze changes in land use in the Mefou basin are Landsat 8 satellite images from January 2018, Landsat TM (from January 1987 and 1999) and Landsat MSS from March 1973 (Table 1). These images are made available to the general public for free by the National Aeronautics and Space Administration (NASA), via the US Geological Survey site (https:// earthexplorer.usgs.gov/), in GeoTIFF format. Uploaded images taken during the dry winter season (December to mid-March) were preferred over the rainy seasons because they are less affected by cloud disturbances. The choice of Landsat images is due to the fact that they have a spatial resolution allowing the desired processing to be carried out, but also to the fact that they cover large areas. Moreover, unlike other satellites (SPOT, Sentinel, etc.), Landsat satellites have been producing images since the 1970s, which is an advantage in land use changes study.
| Spectral band | Wave length | Resolution | ||
|---|---|---|---|---|
| Landsat 8 | The spectral bands of the OLI instrument | Band 1 - Aerosols | 0.433 - 0.453 µm | 30 m |
| Band 2 - Blue | 0.450 - 0.515 µm | 30 m | ||
| Band 3 - Green | 0.525 - 0.600 µm | 30 m | ||
| Band 4 - Red | 0.630 - 0.680 µm | 30 m | ||
| Band 5 - Near Infrared | 0.845 - 0.885 µm | 30 m | ||
| Band 6 - Mid Infrared 1 | 1.560 - 1.660 µm | 30 m | ||
| Band 7 - Mid Infrared 2 | 2.100 - 2.300 µm | 30 m | ||
| Band 8 - Panchromatic | 0.500 - 0.680 µm | 15 m | ||
| Band 9 - Cirrus | 1.360 - 1.390 µm | 30 m | ||
| The spectral bands of the TIRS instrument | Band 10 - Mid Infrared1 | 10.30 - 11.30 µm | 100 m | |
| Band 11 - Mid Infrared2 | 11.50 - 12.50 µm | 100 m | ||
| Landsat TM | Band 1 - Blue | 0.45-0.52 µm | 30 m | |
| Band 2 - Green | 0.52-0.60 µm | 30 m | ||
| Band 3 - Red | 0.63-0.69 µm | 30 m | ||
| Band 4 - Near Infrared | 0.76-0.90 µm | 30 m | ||
| Band 5 - Mid Infrared 1 | 1.55-1.75 µm | 30 m | ||
| Band 6 - Thermal Infrared | 10.4-12.5 µm | 120 m | ||
| Band 6 - Mid Infrared 2 | 2.08-2.35 µm | 30 m | ||
| Landsat MSS | Band 4 - Green | 0.5 - 0.6 µm | 60 m | |
| Band 5 - Red | 0.6 - 0.7 µm | 60 m | ||
| Band 6 - Near Infrared 1 | 0.7 - 0.8 µm | 60 m | ||
| Band 7 - Near Infrared 2 | 0.8 - 1.1 µm | 60 m |
Data analysis
The analysis of average rainfall and flow was carried out using Pettitt [17] and modified Mann-Kendall [18,19] statistical tests at the 95% significance level. Following the application of autocorrelation (from the calculation of the R statistic) and seasonality (from the employment of the correlogram) tests to the rainfall and flow series used, it turned out that there is seasonality in the latter. It is why We chose to use the modified Mann Kendall test of Hirsch and Slack [18] to the detriment of the classic Mann Kendall test and other modified Mann Kendall tests.
The principle of the Pettitt test consists in dividing the series studied (of number N) into two sub-samples of sizes m and n respectively. We then calculate the sum of the ranks of the elements of each sub-sample in the total sample. A statistical study is then carried out from the two sums thus determined, then it is tested according to the hypothesis that the two subsamples do not belong to the same population. Pettitt's test is non-parametric and derives from Mann Whitney's test. The absence of a break in the series (Xi) of size N constitutes the null hypothesis. Its implementation assumes that for any time T between 1 and N, the time series (Xi) i -1 to t and t +1 to N belong to the same population. The variable to be tested is the maximum in the absolute value of the variable U t, N defined by:
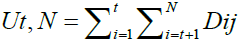
Where Dij=Sign (Xi – Xj) with: sign (x)=1 if x>0, 0 and -1 if x<0
If the null hypothesis is rejected, an estimate of the break date is given by the instant defining the maximum in absolute value of the variable Ut, N.
The Mann-Kendall test statistic for each season is calculated as follows:
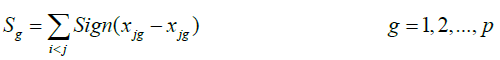
The seasonal Kendall statistic is calculated as follow:
There is no significant trend in the series analyzed when the calculated p-Value is above the chosen significance level. More details on the modified version of the Mann-Kendall test can be found in the relevant literature [18].
To assess the behavior of extreme flows, the Indicators of Hydrologic Alteration (IHA) tool, version 7.1, developed by The Nature Conservancy was used. This tool offers the possibility of comparing the parameters characterizing the flow regimes under different conditions [20]. It uses daily discharge values and produces several important statistics. Only four of them were considered essential for this study, among which are the average, the coefficient of variation (CV) of extreme discharge and the Julian date of the annual minimum and maximum. By dividing the series of values in the period before and after the discontinuity, the tool calculates the change that occurred in the evolution of each of these parameters after the discontinuity. We can thus analyze not only the sign of change between the two periods but also the magnitude of this difference.
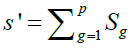
Landsat images were classified using the supervised maximum likelihood classification, using the software Sentinel Application Platform (SNAP) which is made available to the general public free by the European Space Agency (ESA), via the site https://step.esa.int/main/download/snap-download/. This enabled us to perform a diachronic analysis of the evolution of land-use in the basin studied. This operation was preceded by operations of preprocessing and recognition of objects in the field by photography and GPS (Global Positioning System). Satellite images preprocessing refer to all the process applied to raw data to correct geometric and radiometric errors that characterize certain satellite images. These errors are generally due to technical problems with the satellites and interactions between outgoing electromagnetic radiation and atmospheric aerosols, also called “atmospheric noise”. The atmospheric disturbances are influenced by various factors that are present on the day of acquisition, including weather, fires, and other human activities. They affect all the images acquired by passive satellites including Landsat 4, 5,7 and 8. The downloaded Landsat images being orthorectified, the preprocessing involved atmospheric correction of the images and reprojection into the local system (WGS_84_UTM_Zone_33N). For this, neo-channels were created, to increase the readability of the data by enhancing certain properties less obvious in the original image, thus showing more clearly the elements of the scene. Three indices are therefore created, namely: the Normalized Difference Vegetation Index (NDVI, equation 1), the brightness index (BI, equation 2) and the Normalized Difference Water index (NDWI, equation 3) [4]. These indices respectively highlight vegetated surfaces, sterile (non-chlorophyllin) elements such as urban areas and water bodies. The formulae used in creating these indices are:
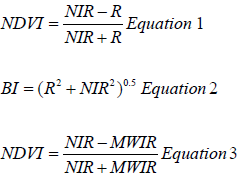
Where NIR: ground reflectance of the surface in the near-infrared channel; R: ground reflectance of the surface in the red channel and MWIR: ground reflectance of the surface in the mid-wave infrared channel. The use of Google Earth, as well as the spaces sampled from the GPS, made it possible to identify with certainty the impervious areas (buildings, savannas, bare soils, and crops), water bodies (large rivers, lakes and ponds) and forest (secondary, degraded, non-degraded and swampy) of each mosaic. Before the classification, the separability of the spectral signatures of the sampled objects to avoid interclass confusion was assessed by calculating the “transformed divergence” index. The value of this index is between 0 and 2. A value >1.8 indicates a good separability between two given classes. The different classes used in this study show good separability between them, irrespective of the image considered, with indices >1.9. The validation of the classifications obtained was carried out using the confusion matrix, making it possible to obtain treatment details to validate the choice of training plots. After validating the land-use/land cover maps, the statistical and spatial differences of each class between studied periods were evaluated.
The main trends in hydrological variability reported here are those identified for the mean (annual and seasonal) and extreme (maximum and minimum) flows.
Average flows
The Pettitt and Mann Kendall tests applied to the series of annual and seasonal modules of the Mefou detected significant trends. A major upward break has been highlighted by the Pettitt test in the different cases during the hydrological year 1985-86 (Figure 2). The resulting rates of change are between +27.8% (autumn) and +66.4% (spring). The analysis of decadal deviations also reveals an increase in Mefou flows since the 1980s, although a slight drop is observed during the 2010s (Table 2). A comparison made with other equatorial rivers such as the Ntem and the Ogooue or even with the Nyong, whose time series were analyzed using the same approach [3], reveals opposite evolutions. First of all, the statistically significant rupture which was detected marks, in the case studied, the beginning of a wet hydrological phase, whereas it is an evolution in the opposite direction on the aroused rivers. It then appears that this is later on the Mefou (1985-86); conversely, it occurred much earlier on the three other rivers being compared, more precisely in 1977 on the Ogooue at Fougamou, in 1971 on the Ntem at Ngoazik and in 1973 on the Nyong at Mbalmayo.

Figure 2. Evolution of precipitations, discharges and runoff coefficients (Ke) of the studied basin at annual and seasonal time steps, according to the Pettitt and Mann Kendall tests. Vertical dashed lines indicate the rupture year, and the corresponding rates of change appear on their right sides. Oblique dashed lines indicate trends.
| Variables | Decades | Decadal deviations | ||||
|---|---|---|---|---|---|---|
| Annual | Spring | Summer | Autumn | Winter | ||
| Rainfall | 1950 | 3.1 | 7.5 | -27.1 | 3.9 | 20.4 |
| 1960 | 8 | 4.8 | -5 | 10.5 | 38.4 | |
| 1970 | -3 | 3.5 | -24.7 | -7.7 | 20.8 | |
| 1980 | 4.7 | 2.9 | 30.2 | 4.7 | -30.6 | |
| 1990 | -9.7 | -19.4 | 19.3 | -5.6 | -19.5 | |
| 2000 | 5.7 | 8.4 | 18.1 | 0.4 | -1.2 | |
| 2010 | -12.6 | -11.2 | -15.1 | -9 | -41.2 | |
| Discharges | 1960 | -18.7 | -29.8 | -35.7 | -10.4 | -11.7 |
| 1970 | -30.4 | -33.5 | -38.8 | -18.2 | -29.3 | |
| 1980 | 26.7 | 9.3 | 48.3 | 28.2 | 24.5 | |
| 1990 | - | - | - | - | - | |
| 2000 | 23.6 | 28.5 | 24.8 | 12.4 | 17.3 | |
| 2010 | 14.8 | 21.8 | 7.2 | 9.7 | 0.3 | |
| Ke | 1960 | -55.7 | -29.4 | -40.8 | -18.2 | -61.8 |
| 1970 | -65.4 | -35.7 | -7 | -1 | -76.9 | |
| 1980 | -2.1 | -10.2 | -25.6 | 0.3 | -0.2 | |
| 1990 | - | - | - | - | - | |
| 2000 | -4.4 | 24.6 | 17.3 | 6.8 | -8.9 | |
| 2010 | 137.2 | 43.7 | 41.2 | 10.7 | 161.2 | |
Extreme flows
Concerning extreme discharges, we noted an increase in all the ranges of minimums and maximums after the break (Figure 3). The minimums increased at rates ranging from +57.1% (90-day minimum) to 82.3% (7-day minimum) (Table 3). The variability of all minimum flow ranges also increased slightly after the break. Increases in maximums range from 31.2% (7-day maximum) to 46.5% (90-day maximum). While an upward trend was observed for a flood, this was not the case for the coefficients of variation and the maximum dates of occurrence. The coefficients of variation of the various ranges of maximum flow rates decreased by more than 10% after the break. On the other hand, the dates of appearance of the annual maximums and minimums decreased after the break. They respectively went from 302 to 180 and from 88 to 87 (Table 3). All this reflects a greater sensitivity of the watershed to seasonal precipitation capable of producing rapid flood flows on the slopes and leading to a quick response of the river at the outlet. Urbanization effects on flows have already been demonstrated in a larger basin in the region studied, in this case, that of the Nyong [4]. These are reflected not only in the maintenance of the maximums, while the rainfall that generate them decrease, but also in a precocity in their average appearance date over time.

Figure 3. Comparison of 1 to 90-day minimum and maximum flows between the dry and wet phase from statistical detection tests. The broken lines indicate the mean and the solid lines the standard deviation.
| IHA Parameters | Mean (m3/s) | Coefficient de variation (%) | Variation | ||||
|---|---|---|---|---|---|---|---|
| Before break | After break | Before break | After break | m3/s | % | ||
| Débits minimums | 1-day minimum | 1.5 | 2.6 | 0.33 | 0.34 | +1.1 | +73.3 |
| 3-day minimum | 1.6 | 2.9 | 0.27 | 0.31 | +1.3 | +81.2 | |
| 7-day minimum | 1.7 | 3.1 | 0.25 | 0.29 | +1.4 | +82.3 | |
| 30-day minimum | 2.3 | 3.9 | 0.27 | 0.28 | +1.6 | +69.5 | |
| 90-day minimum jours | 3.5 | 5.5 | 0.27 | 0.22 | +2 | +57.1 | |
| Débits maximum | 1-day maximum | 16.4 | 23.1 | 0.31 | 0.19 | +6.7 | +40.8 |
| 3-day maximum | 15.3 | 20.3 | 0.31 | 0.13 | +5 | +32.6 | |
| 7-day maximum | 14.1 | 18.5 | 0.32 | 0.12 | +4.4 | +31.2 | |
| 30-day maximum jours | 11.7 | 15.8 | 0.35 | 0.14 | +4.1 | +35 | |
| 90-day maximum | 8.8 | 12.9 | 0.34 | 0.19 | +4.1 | +46.5 | |
| Average Julian date of | minimum | 88 | 71 | ||||
| maximum | 302 | 180 | |||||
The difference in evolution between the discharges of the Mefou and those of most other equatorial rivers require explanations which can be found by examining the hydrological modifications observed in the light of the climatic and environmental changes observed in the basin over the same period.
Hydrological alterations incorporating the effects of changes in land use modes
A change detection analysis performed under SNAP, by diachronic comparison of the results of supervised classifications from Landsat images, shows significant changes in land use modes in the Mefou basin. These changes mainly concern the Mfoundi sub-basin (Figure 4). There is an increase in impervious areas (buildings, roads, crops, etc.). Between 1973 and 2018, built and roads increased by 676.9%. On the same interval, bare soils and farmlands increased by 300.4% (Table 4). These increases are to the detriment of swampy forest, continental forest and water bodies, which decreased respectively by -363.1%, 115.8% and -22.2% respectively (Table 4). The greatest increase in built and roads occurred between 1987 and 1999. Over this interval, these spaces increased by +60.6 km2 (Table 3). In the case of bare soils and farm lands, the most significant increase was noted between 1999 and 2018 (+60.3 km2) (Table 4). In Central Africa [15,4], West Africa [21,22] and elsewhere [23,24] similar observations have made relating to changes in land use in these sub-regions.

Figure 4. Changes in the spatial distribution of the main land use modes in the Mefou basin between 1973 and 2018.
| Land use modes | Area occupied in the basin (km2) | Change | ||||||||||
|---|---|---|---|---|---|---|---|---|---|---|---|---|
| 1973 | 1987 | 1999 | 2018 | 1973-1987 | 1987-1999 | 1999-2018 | 1973-2018 | |||||
| km2 | % | km2 | % | km2 | % | km2 | % | |||||
| Built and roads | 21.6 | 57 | 117.6 | 167.8 | 35.4 | 164.3 | 60.6 | 106.3 | 50.2 | 42.6 | +146.2 | +676.9 |
| Swampy forest | 61.6 | 52.4 | 24.6 | 13.3 | -9.2 | -14.9 | -27.8 | 53 | -11.3 | -45.9 | -48.3 | -363.1 |
| Continental forest | 319.2 | 298 | 247 | 147.9 | -21.2 | -6.6 | -51 | -17.1 | -99.1 | -40.1 | -173.3 | -115.8 |
| Water | 1.1 | 1.1 | 1 | 0.9 | 0 | 0 | -0.1 | 11.1 | -0.1 | -11.1 | -0.2 | -22.2 |
| Bare soils and farm lands | 24.5 | 19.7 | 37.8 | 98.1 | -4.8 | -19.5 | 18.1 | 94.7 | 60.3 | 159.5 | +73.6 | +300.4 |
Changes of this type and such magnitude can only induce hydrological alterations. The most noticeable in the case studied are the increase in average and extreme discharges and the precocity in the observation of maximums. Concerning the increase in discharges, in a context where the precipitation of the rainy seasons that generate the maximum discharges decreased (Table 2 and Figure 2), the most logical thing would have been to see their drop, which is not the case. The urbanization of this basin seems to be the most relevant factor to justify this trend. In this case, the decrease in precipitation seems to have been compensated by the increase in runoff. The average annual runoff coefficients of this basin have indeed increased significantly since the 1980s (Table 2 and Figure 2), following a phase of accelerated urbanization in the western part of this basin (Yaounde region) from the 1980s, following the subdivision operations undertaken since the end of the 1970s by the municipal authorities [7]. In the case of the earliness of the maximums, the changes in surface conditions observed reduce the duration necessary for their appearance by accentuating the runoff they cause. Thresholds of impermeable surfaces beyond which urbanization is supposed to have, at the basin scale, a statistically significant influence on river discharge are proposed in literature, although the figures put forward by the various authors are somewhat dissimilar. Booth and Jackson thus place this threshold at 10%. Brun and Band (2000) at 20%, while for Yang G, et al. [25], this threshold is between 3 and 5%. In all cases, it appears that, this threshold exceed 40% in the studied basin. Under these conditions, it is logical that hydrological alterations such as those highlighted occur. Studies in sub-Saharan Africa [4,26,27] and elsewhere [28,29] have already reported the impact of urbanization on runoff. This work has shown an increase in average flows, following an increase in impervious areas in the studied basins.
The amplifying role of precipitation variations in observed hydrological fluctuations
Summer rainfall is the only ones that increased significantly in the Mefou basin. The noted surplus after the break of 1979-80 is +42.8% (Figure 1). Although summer precipitations have increased significantly since the 1980s, a significant drop has been observed in their evolution during the 2010s (Table 2). Annual rainfall and that of other seasons decrease [30,31]. Statistically significant decreases were noted for autumn (in 1972-73) and winter (in 1978- 79) rainfall. The deficits recorded after the break in these two cases are -11% and -39% (Figure 1).
The different cases where a downward break was highlighted (autumn and winter) are also those for which the increases in flows are the least significant after the common rupture of 1985-86. On the other hand, the most significant increases in discharges were observed in cases where there is an upward break (summer) or no break (spring) [32-34]. Similarly, the 2010s, characterized by a significant drop in precipitation, is also the one for which the surpluses observed since the 1980s are generally the lowest, apart from the spring for which the excedent remains relatively high (Table 2).
The objective of this study was both to characterize, over the recent period, the hydrological variability in the Mefou basin, and also to look for the key factors explaining the observed hydrological fluctuations. Between 1973 and 2018, the Mefou watershed experienced changes in land use modes, mainly marked by a significant increase in impervious areas (+530%) to the detriment of forest areas (-52.9%) and water bodies (-80.4%). These changes caused a significant increase in the average and extreme flows of the Mefou river from 1985-86. They are also at the origin of the precocity in the maximum appearance. The rainfall trends observed in this basin have contributed to amplifying this increase in some cases and reducing it in others. The summer and spring, whose rainfall respectively recorded an upward break and no break, are also the seasons for which the increases in runoff are the most significant. Conversely, autumn and winter, which recorded significant decreases in rainfall, experienced the weakest increases. Although this study provides useful information on the general behavior of flows in the Mefou watershed, it nevertheless leaves some uncertainties related to the gaps in the observed flow series. Other information that could have been obtained in the absence of these gaps has probably remained latent. Regular measurements of the flows of the Mefou river are therefore essential to solve this problem.
Data cannot be made publicly available; readers should contact the corresponding author for details.
None.
The authors declare no conflict of interest.
Google Scholar, Crossref, Indexed at
Google Scholar, Crossref, Indexed at
Google Scholar, Crossref, Indexed at
Google Scholar, Crossref, Indexed at
Google Scholar, Crossref, Indexed at
Google Scholar, Crossref, Indexed at
Google Scholar, Crossref, Indexed at
Google Scholar, Crossref, Indexed at
Google Scholar, Crossref, Indexed at
Google Scholar, Crossref, Indexed at
Google Scholar, Crossref, Indexed at
Google Scholar, Crossref, Indexed at
Google Scholar, Crossref, Indexed at
Google Scholar, Crossref, Indexed at
Google Scholar, Crossref, Indexed at
Google Scholar, Crossref, Indexed at
Google Scholar, Crossref, Indexed at
Google Scholar, Crossref, Indexed at
Google Scholar, Crossref, Indexed at
Google Scholar, Crossref, Indexed at
Google Scholar, Crossref, Indexed at
Google Scholar, Crossref, Indexed at
Google Scholar, Crossref, Indexed at
Google Scholar, Crossref, Indexed at
Google Scholar, Crossref, Indexed at
Google Scholar, Crossref, Indexed at
Google Scholar, Crossref, Indexed at
Google Scholar, Crossref, Indexed at
Google Scholar, Crossref, Indexed at
Hydrology: Current Research received 2843 citations as per Google Scholar report