Research - (2021) Volume 5, Issue 4
Received: 11-May-2021
Published:
09-Jul-2021
, DOI: 10.37421/2684-4923.2021.5.146
Copyright: ©2021 Yayiru Tibara, et al. This is an open-access article distributed under the terms of the Creative Commons Attribution License, which permits unrestricted use, distribution, and reproduction in any medium, provided the original author and source are credited.
On a global basis, there is evidence that the number of people affected by floods are on the rise. This research study assessed the level of community exposure, sensitivity and resilience and the households’ risks perceptions to floods in Kilembe. The research design for this study involved an index-based approach. The primary data was obtained using a semi-structured questionnaire, 194 households were purposefully selected. The study revealed that the community was highly exposed to floods. About 43.3% of the households were found living less than two kilometres from the flooding river. The households were also found highly susceptible to flood hazards with 78.9% of the households had a monthly average income of about US$52. However, the community had high capacities to cope with the effects of flood hazards. Only 17.0% of the households surveyed had gone to the local authority for assistance in the last 1 year. About 98.5% of the households thought that the frequency of occurrence and impacts of flooding had increased during the last decade, and 74.4% of the households felt very worried about the floods. The government should install early warning system, ensure active participation of the local communities, and timely and adequately respond to floods.
Flood hazard • Flood vulnerability • Resilience • Exposure • Uganda
The world is witnessing a rapidly increasing impact of disasters which constantly threatens peoples’ lives and livelihoods [1-3] and, therefore, a great concern to man. Globally, in terms of occurrences, climate-related disasters have dominated. Between 1998 and 2017, global climate-related disasters (including floods) accounted for 91% of all 7,255 recorded events (CRED and UNISDR, 2017). Within the same period, disasters accounted for direct economic losses valued at US$ 2,908 billion, of which climate-related disasters caused 77% of the total direct economic losses (CRED and UNISDR, 2017).
In Uganda extreme weather and climate events such as floods and droughts are also common. Previous years in Uganda have seen erratic arrivals and endings of rainfall seasons, and individual rainfalls have been heavier and more violent [4]. In Uganda, floods are seasonal and usually occur in periods of intense rainfall and el-Niño phenomena. Floods may increase the spread of malaria especially during and after the flood event, and hence compounding the community vulnerability to health hazards [5]. Floods cause physical damage by washing away structures, destroying farmlands, submerging human settlements, displacing people and causing loss of lives (DDPM and OPM, 2011). For instance, in 1997, floods affected 153,500 people, killing 100 in Uganda, and in 2007 it also affected 718,045 people. In Uganda, internal displacement of persons over the periods between 1998 and 2008 due to hazards including flooding was about 1,800,000 people (DDPM and OPM, 2011). Jacobs et al. (2017) further indicated that over the past 50 years, at least seven major flash floods have affected catchments of the Rwenzori Mountains including Kilembe. The Rwenzori mountains are not only subject to flash floods, but also to forest fires, earthquakes and landslides [6]. One of the most devastating events occurred on 1st May, 2013 in the Nyamwamba catchment in which Kilembe is situated [6]. The International Federation of Red Cross and Red Crescent, IFRC (2013) reported that this flash flood happened after heavy rains that lasted for over six hours causing the River Nyamwamba to burst its banks and flooded several areas including Kilembe (IFRC, 2013). Eight people were confirmed dead, and several households affected (IFRC, 2013). The flood caused widespread destruction of houses, crops and facilities such as bridges, roads and power lines. Major infrastructures such as hospitals and sewage treatment unit were also damaged (IFRC, 2013). Similarly on 7th May, 2020, Kilembe experienced another devastating flood event that left a trail of destruction (KDLG, 2020). Floods are also expected to increase in frequency and severity triggered by climate change Environment [4]. The increased exposure of floods to these communities increases community’s vulnerabilities to disasters and changes the community’s lifestyles and hence affecting their capacities to respond (KDLG, 2017).
Managing floods with the aim of safety and wellbeing of people and their environment can be done through vulnerability reduction and increasing resilience [7]. Communities must identify exposure to hazard impacts to proactively address emergency response, disaster recovery, and hazard mitigation, and incorporate sustainable development practices into comprehensive planning [8]. Adelekan (2011) adds that the sources of vulnerability are also associated with societies’ patterns of development, and small investments in reducing risk can have disproportionately large positive impacts in protecting communities from harm. Social developments such as risk perception is also considered a crucial aspect in the context of flood risk management [9]. Regions with low levels of flood risk perception and low degree of preparedness for coping with flood events tend to experience flood damage levels above average [10]. The paper assessed the community vulnerability and perceptions to floods which provided site-sensitive information to decision-makers and communities towards disaster risk management. The Government of Uganda has a target to increase the capacity to cope with the increasing impacts of climate change such as frequent floods in a bid to reduce the level of vulnerability envisaged in the Uganda vision 2040 [11].
Profile of the study area
The study was undertaken in Kilembe subcounty, Kasese district, Western region of Uganda. Kilembe lies approximately along latitude 0012ꞌ17ꞌꞌN and longitude 3000ꞌ59ꞌꞌE. Kilembe neighbours greater Bugoye subcounty in the East, Kyonde subcounty in the West and Mahango and Kyarumba subcounties in the south (Figure 1). Kasese district is one of the rural districts of Uganda with its headquarters located approximately 360 kilometres west of Kampala the Capital City of Uganda [12]. Kasese district experiences a bimodal rainfall pattern. The first rains are short but fall with high intensity and occur during March-May season, and the longer rains from August-November with a low intensity. Annual rainfall ranges from 800mm to 1600mm, and is greatly influenced by altitude [13]. The soils in the district are organic, ferrosols, podsols/eutrophic, and hydromorphic. The dominant soil type is clay-loams and contains high reserve of weatherable minerals on alluvial deposits [12].

Figure 1. Location of Kilembe Sub-county Source: Prepared by the author.
Kasese district is comprised of principally three topographical features, namely the mountainous areas, which consist of rugged mountain relief, the undulating region at the foothills, and the lowland flat areas in the South and South- Eastern part of the district [12].
The research design for this study involved a cross sectional survey. An index-based approach was employed to assess the level of community exposure, sensitivity and resilience to flood hazards in Kilembe Sub-county. The study also assessed the perception of households to floods. Primary data was obtained using a semi-structured questionnaire, key informant interviews and physical observations on the selected indicators, and perceptions of households to floods. Households within the same geographical area are always equally exposed to a stressor, but the levels of sensitivity vary from one household to another [14]. People have different ideas and notions about environmental quality and their perception of a spectrum of environmental problems needs to be assessed [15]. To get acquainted with the study area, a reconnaissance was first undertaken. A reconnaissance was initially done with a view of establishing the main climate risks that are common in the area and the livelihood issues that could constitute the indicators selected under exposure, sensitivity and resilience. This was to validate the indicators that had been identified from the literature (Figure 1).
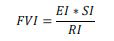
To establish the flood vulnerability level, flood vulnerability index (FVI) was used where E means Exposure, (S) Susceptibility, and (R) Resilience [16]. The indicators of exposure and susceptibility are multiplied and then divided by the resilience indicators, because indicators representing exposure and susceptibility increase flood vulnerability and are, therefore placed in the numerator. The resilience indicators decrease flood vulnerability and are thus part of the denominator [17].
Further, to be able to use this expression of flood vulnerability index, firstly, operational indicators for exposure, sensitivity and capacity/resilience were identified. This was followed by data collection, allocation of weights to different classes of phenomenon under each indicator, computation of exposure, sensitivity and capacity/resilience index of flood-prone areas, and lastly, interpretation of results (Table 1).
| Socio-economic characteristics | Frequency | Percentage (%) |
|---|---|---|
| Sex | ||
| Male | 111 | 57.2 |
| Female | 83 | 42.8 |
| Age | ||
| 18-29 | 68 | 35.1 |
| 30- 39 | 70 | 36.1 |
| 40-49 | 32 | 16.5 |
| 50-59 | 23 | 11.8 |
| >60 | 1 | 0.5 |
| Marital status | ||
| Single | 64 | 33 |
| Married | 102 | 52.6 |
| Separated/Divorced | 17 | 8.8 |
| Widowed | 11 | 5.6 |
| Education qualification | ||
| No formal Education | 59 | 30.5 |
| Primary Education | 40 | 20.6 |
| Secondary Education | 66 | 34 |
| Tertiary Education | 29 | 14.9 |
| Occupation | ||
| Civil servant | 15 | 7.7 |
| Private/ professional | 23 | 11.9 |
| Trader | 35 | 18 |
| Farming | 115 | 59.3 |
| Others | 6 | 3.1 |
Table 1. Socio-economic characteristics of the respondent.
The indicators for the study (Table 2, Table 3 and Table 4) were selected widely through literature review [18,19] and were selected based on their suitability and usefulness. They were then customised to Kilembe during the pretesting of the questionnaire and validated by the key informants. The variables or indicators were further divided into classes depending on their individual characteristics into two or more different classes (for instance, nature of response: yes or no), three classes, four classes and five classes. These classes were formulated to illustrate the degree of variation possible in that variable. Weights were assigned to each class within an indicator, based on vulnerability level following standard normalisation procedures [20]. In most of the cases, highest vulnerable classes were assigned with the weight value 1, while the least vulnerable 0. In situation of yes and no response, the weights varied between 0 and 1. For indicators with three levels of phenomena, the weights were assigned as 0.33, 0.67 and 1. Similarly for four classes of phenomena, the weights were 0.25, 0.50, 0.75 and 1, and for five classes of phenomena, the weights were 0.2, 0.4, 0.6, 0.8 and 1.
| S/n | Indicator | Class | Frequency | Percentage frequency | Weights allocated to classes |
|---|---|---|---|---|---|
| 1 | Type of house | Brick walls with iron/tiles sheet roof | 152 | 78.4 | 0.33 |
| Mud walls with iron/tiles sheet roof | 37 | 19.1 | 0.67 | ||
| Mud walls with thatched roof | 5 | 2.5 | 1 | ||
| 2 | Distance of house from the river | Less than 1km | 7 | 3.6 | 1 |
| Between 1 and 2km | 84 | 43.3 | 0.67 | ||
| More than 2km | 103 | 53.1 | 0.33 | ||
| 3 | Households with injury/ death in previous floods | Yes | 52 | 26.8 | 1 |
| No | 142 | 73.2 | 0 | ||
| 4 | Type of family | Joint/ extended family | 24 | 12.4 | 0.33 |
| Nuclear | 129 | 66.5 | 0.67 | ||
| Size of household | Single | 41 | 21.1 | 1 | |
| Less than 5 persons | 84 | 43.3 | 0.33 | ||
| 5 | Between 5 and 10 | 86 | 44.3 | 0.67 | |
| Greater than 10 | 24 | 12.4 | 1 |
Table 2. Selected indicators and weights allocated under exposure.
| S/n. | Indicator | Class | Frequency | Percentage frequency | Weights allocated to classes |
|---|---|---|---|---|---|
| 1 | Households with means of transportation | Yes | 42 | 21.6 | 0 |
| No | 152 | 78.4 | 1 | ||
| 2 | Households with a mobile telephone | Yes | 155 | 79.9 | 0 |
| No | 39 | 20.1 | 1 | ||
| 3 | Households with a television or radio | Yes | 113 | 58.2 | 0 |
| No | 81 | 41.8 | 1 | ||
| 4 | Households with access to electricity |
Yes | 38 | 19.6 | 0 |
| No | 156 | 80.4 | 1 | ||
| 5 | Households with access to improved sanitation | Yes | 55 | 28.4 | 0 |
| No | 139 | 71.6 | 1 | ||
| 6 | Households with access to clean/safe water | Yes | 82 | 42.3 | 0 |
| No | 112 | 57.7 | 1 | ||
| 7 | Distance to the nearest health facility (kilometres) | Less than 1km | 51 | 26.3 | 0.25 |
| Between 1 and 5km | 85 | 43.8 | 0.5 | ||
| between 5 and 10km | 50 | 25.8 | 0.75 | ||
| More than 10km | 8 | 4.1 | 1 | ||
| 8 | Households who have borrowed money for flood related matter in the last 10 years | Yes | 46 | 23.7 | 1 |
| No | 148 | 76.3 | 0 | ||
| 9 | Household's main occupation | Civil servant | 16 | 8.2 | 0.25 |
| Private/Professional | 16 | 8.2 | 0.5 | ||
| Trader | 15 | 7.7 | 0.75 | ||
| Farmer | 147 | 75.8 | 1 | ||
| 10 | Household's monthly average 9 income (In Uganda shillings, Ugx) | 50,000-190,000 | 153 | 78.5 | 1 |
| 200,000-340,000 | 32 | 16.5 | 0.75 | ||
| 350,000-490,000 | 7 | 3.6 | 0.5 | ||
| >500,000 | 2 | 1 | 0.25 | ||
| 11 | Households living in community (years) | <8 | 60 | 30.9 | 1 |
| 16-Aug | 64 | 33 | 0.8 | ||
| 16-24 | 33 | 17 | 0.6 | ||
| 24-32 | 21 | 10.8 | 0.4 | ||
| >32 | 16 | 8.2 | 0.2 | ||
| 12 | Households with family 11 members having chronic illness/ disability (Number) |
0 | 3 | 1.5 | 0 |
| 1 | 141 | 72.7 | 0.33 | ||
| 2 | 36 | 18.6 | 0.67 | ||
| >2 | 14 | 7.2 | 1 | ||
| 13 | Dependence ratio | 0 | 96 | 49.5 | 0 |
| 0.08-0.31 | 37 | 19.1 | 0.25 | ||
| 0.31-0.54 | 31 | 16 | 0.5 | ||
| 0.54-0.77 | 26 | 13.4 | 0.75 | ||
| 0.77-1.00 | 4 | 2.1 | 1 |
Table 3. Selected indicators and weights allocated under sensitivity.
| S/n. | Indicator | Class | Frequency | Percentage frequency | Weights allocated to classes |
|---|---|---|---|---|---|
| 1 | Households that had gone to any local authority for any assistance in the last 1 year | Yes | 33 | 17 | 0 |
| No | 161 | 83 | 1 | ||
| 2 | Household's relationship with the community | Poor | 7 | 3.6 | 0.33 |
| Moderate | 66 | 34 | 0.67 | ||
| Good | 121 | 62.4 | 1 | ||
| 3 | Households with relatives employed outside the community | Yes | 132 | 68 | 1 |
| No | 62 | 32 | 0 | ||
| 4 | Households with relatives outside the community | Yes | 165 | 85.1 | 1 |
| No | 29 | 14.9 | 0 | ||
| 5 | Households having at least land or house in the community | Yes | 113 | 58.2 | 1 |
| No | 81 | 41.8 | 0 | ||
| 6 | Households with any form of saving | Yes | 133 | 68.6 | 1 |
| No | 61 | 31.4 | 0 | ||
| 7 | Households with family members earning (in number) | >2 | 7 | 3.6 | 1 |
| 2 | 40 | 20.6 | 0.67 | ||
| 1 | 121 | 62.4 | 0.33 | ||
| 0 | 26 | 13.4 | 0 | ||
| 8 | Households' number of sources of income | >2 | 1 | 0.5 | 1 |
| 2 | 28 | 14.4 | 0.67 | ||
| 1 | 143 | 73.7 | 0.33 | ||
| 0 | 22 | 11.3 | 0 | ||
| 9 | Households with family members having training and a first aid kit | Yes | 22 | 11.3 | 1 |
| No | 172 | 88.7 | 0 | ||
| 10 | Households with previous experience with floods | Yes | 102 | 52.6 | 1 |
| No | 92 | 47.4 | 0 | ||
| 11 | Highest level of education of the household head | No formal education | 62 | 32 | 0.25 |
| Primary education | 35 | 18 | 0.5 | ||
| Secondary education | 66 | 34 | 0.75 | ||
| Tertiary education | 31 | 16 | 1 |
Table 4. Selected indicators and weights allocated under resilience.
After proper weights allocation to classes of phenomenon for each indicator, the index for each component was calculated, i.e., the composite index for exposure, sensitivity and resilience were computed independently from:
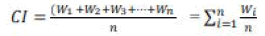
Where CI is the composite index, W1 to Wn are respective weights assigned to indicators, and n is the number of indicators used for computing the composite index.
Vulnerability index was then computed from the formula provided by [15,16,18].
The indices obtained were also compared with the values <0.01, 0.01- 0.25, 0.25-0.50, 0.50-0.75 and 0.75-1 for very small vulnerability to floods, small vulnerability to floods, vulnerable to floods, high vulnerability to floods and very high vulnerability to floods respectively [21].
To obtain information on the household’s perception to flood risk, data were collected through the administration of a purposely designed questionnaire. The data included socio-economic characteristics of the respondent, households’ past flood experience and concern and perception of flood risk in their area of residence. The questionnaire data (inclusive of the perception to floods) were coded directly into IBM Statistical Package for Social Sciences (SPSS) version 20 after data cleaning and analysed using quantitative methods involving descriptive statistics.
Sample Size
According to the Uganda National Population and Housing Census 2014, Kilembe subcounty had 13,632 households. The representative sample size for the
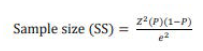
study was obtained using Cochran (1977) sample size determination method;
where Z is confidence level ( ± 1.96 at 95%), p is percentage picking choice expressed as decimal (0.5 is used for sample size needed), and e is the precision value (0.07 = ± 7). Therefore, 194 households were obtained from the sampling method. The May 2013 flood disaster event affected 441 households in Kilembe [22]. The 194 households sampled was an equivalent of 44% of affected households and 1.4% of the total households in Kilembe subcounty.
Kilembe subcounty has four parishes. Two parishes that had at least experienced floods in the last decade were selected. Two villages were purposefully selected from each parish. From each parish, 97 households were selected using a systematic random sampling procedure. The study targeted the heads of the households as respondents. The household survey was conducted between 21st June and 2nd July, 2020. The survey was conducted from Monday to Sunday between 8am and 6:30 pm by two trained local field assistants in order to capture information from households that work during week days. Respondents’ consents were sought and obtained to participate in the interview and were assured of the confidentiality of responses.
The concept of vulnerability to flood hazard is an integral part of integrated flood risk assessment and management. The study revealed that, the households in the area were generally highly exposed and susceptible to flood hazards. Therefore, with a projected increase in heavy precipitation events, the frequency of rainfall-triggered flash floods is likely to increase and hence increasing further the exposure of these households. Households were largely of low-income level and had high dependence ratio and took long period to recover from the effects of previous flood events. However, households had generally high resilience or capacities to resist, absorb and cope with the effects of flood hazards. Overall, households were found highly vulnerable to flood hazards. The households’ perceptions to flood hazards were also found generally low and this may hinder them from pursuing precautionary and mitigation measures against and appreciate government responses towards flood disaster risk management.
Residents indicated that, the area may be unhabitable in the future if no actions are taken by government towards flood disaster risk management. To reduce the community’s vulnerability, the local government with support from central government should put more efforts in installing the flood early warning system, ensure active participation of the local communities, raise public awareness and educate and disseminate right information about flood disaster risk management. Further, the household capacity level can be increased by providing employment and livelihood diversification opportunities to improve the household income and savings. The households should also take voluntary precautionary measures to protect their houses and other properties from floods since the local government alone cannot effectively protect flood prone communities in the view of limited resources. The local government should timely and adequately respond to flood affected communities in order to save lives, ensure public safety and meet the basic subsistence needs of the people affected.
This paper was prepared based on the MSc thesis submitted by the first author to the Pan African University Institute of Life and Earth Sciences at the University of Ibadan, Nigeria and funded by the African Union Commission.
Journal of Environmental Hazards received 51 citations as per Google Scholar report