Research Article - (2019) Volume 9, Issue 1
Received: 27-Oct-2018
Published:
25-Mar-2019
Citation: Mikaili MA, Ebadi T, Bahmanib F (2019) Dechlorination Kinetics of PCBs
Contaminated Transformer Oils by Stabilized Nanoscale Fe. J Civil Environ Eng 9:
333.
Copyright: © 2019 Mikaili MA, et al. This is an open-access article distributed under the terms of the Creative Commons Attribution License, which permits unrestricted use, distribution, and reproduction in any medium, provided the original author and
source are credited.
Yet a careful study of dechlorination kinetics on polychlorinated biphenyls (PCBs) congeners in transformer oil has not been investigated. 29 PCBs congeners were identified in transformer oil. Two sets of experiments were developed to study the effect of starch stabilized iron nano particles (NPs) concentration and temperature on the dechlorination of total PCBs. The experiments initiated with special initial concentration and lasted for an hour. The first order rate constant (k) were slightly influenced by the initial concentration of NPs. The k value changed from 0.0202 ± 0.004 to 0.0456 ± 0.0023 min-1 with an initial concentration range between 0.1 gL-1 and 0.5 gL-1 of NPs. The apparent activation energy for dechlorination was 17.712 kJmol-1 in a temperature ranging from 35°C to 75°C. The reduction rate and extent of dechlorination were remarkably under the effect of higher temperature. Dehalogenation order of PCBs indicate that in high chlorinated biphenyls the chlorine situated at the following discipline Para(P)P(para)P_(higher) ortho(CP)_(lower) (meta)M have slightly more reactivity compared with PP_ (lower)CP_(higher) M > P_ CP_M > -_CP_M.
PCBs; Modified Fe nano particles; Dechlorination order; Kinetics
Polychlorinated biphenyls (PCBs) which are not produced in the United States anymore are some synthetic chemicals which can be still found in the environment. Previously, they used to be used as transformer oil. Being stable at high temperatures and having excellent electrical insulating are among the most important features of transformer oil, and they are widely used in transformers, capacitors, and other electrical equipment as coolants and lubricants. The reason for this is that they are good insulators, and, as a result, they do not burn easily. Because of their environmental toxicity and being classified as persistent organic pollutants, the manufacturing of PCBs was halted in the United States in 1977. In order to destroy PCBs, it is necessary to use thermal and chemical energy so as to break molecular links. Nanoscale zero valent iron (nZVI) has unique features and properties, such as large surface area, high reactivity, and low cost, and they have become popular and attracted a lot of attention for degradation of PCBs [1-3]. Since late 1990s, nanoparticles have become valuable materials for their environmental remediation abilities [3,4-6]. Nanoparticles have a number of functions, such as attaching to the contaminated zone, reacting with the unwanted contaminants, and decreasing their mobility and toxicity [4]. As iron nanoparticles have high surface activity, the remediation process can be accelerated by them. In this case, contaminants are completely transformed by nanometals, and the final product of this cycle, which is usually called flocs or sludge, are easily removed by using some magnetic techniques [3,7,8]. In aquatic environments, two techniques, known as aggregation and sedimentation, change the movement of nanoparticles, and this will lead to a reduction in the efficacy of these nanoparticles being used for remediation purposes [9,10]. Therefore, it is of importance to increase the stability of the suspension of nanoparticles and to minimize aggregation. To this end, electrostatic stabilization and steric hindrance are the two approaches which are commonly used [11]. Surface modification of nanoparticles by polyelectrolytes, polymers and surfactants, providing steric and electrostatic stabilization against the particle-particle attractive forces, significantly improves its transport in porous media [12]. Attempts have been made by many researchers to modify the surface properties of nanoparticles by using various surfactants/dispersants [13-16]. According to some reports, water-soluble polysaccharides have been known to be the best stabilizer among others as they are cost effective and compatible with the environment [1]. Starch as a stabilizer comprising a carbohydrate bound to the nanoparticles and modify their surface properties, enhance their reactivity, and improve their field deployment and delivery capabilities [16-19]. From a theoretical standpoint, out of 209 PCBs congeners that exist, only 130 congeners can be found in products with commercial purposes. Based on the final use of PCBs, the PCBs that are now commercialized in the world are produced from congeners that have been chlorinated to different degrees. As far as we have done research on this topic, the kinetic effects of iron nanoparticles concentration and temperature on mixture of PCBs exist in transformer oil have not been systemically investigated. The objective here was to study the effects of nanoparticles concentration and temperature on the dechlorination of 29 PCBs congeners. These congeners were identified in askarel oil from Razi Petrochemical, Mahshahr, Khoozestan. Moreover, dechlorination kinetics of all congeners was investigated to identify PCBs degradation order.
Materials
Iron (III) chloride hexahydrate (FeCl3.6H2O), sodium borohydride (NaBH4), H2SO4, acetone, ethanol, starch, askarel oil from Razi Petrochemical, Mahshahr, Khoozestan, HCL, methanol. All chemicals were Merk.
Synthesis of stabilized nZVI
Prior to impregnation with nZVI, the starch was firstly dissolved in water at 80°C, and a volume of 5 ml HCL was added to this solution and boiled. The solution was cooled to the ambient temperature and filtered. Separately, 25 ml of NaBH4 1.84 M was added drop-wise into 50 ml of Fe3+0.18 M solution containing 2.5%V of the starch solution. At the time of the reaction, the flask was shaken by hands. It is advisable not to use magnetic stirring because the magnetically induced aggregation of the resultant iron particles should be reduced during the reaction. Based on the following reaction stoichiometry, borohydride was used to reduce ferric iron [20].
Fe(H2O)6 3+ + 3BH4− + 3H2O→Feo+10½H2+3B(OH)3
To make sure that the reducing agent BH4 - was used efficiently, the whole reactor system worked under inert conditions through continuous vacuuming. The stabilized black-colored nZVI particles were then twice washed with deionized (DI) water and ethanol before being used or stored in water containing 5% ethanol [7,14].
Characterization of nZVI
X-ray diffraction analysis of iron nanoparticles (XRD): The freshly prepared nZVI particles were separated by a 50 nm filter (Sartorius, Germany) which connect to a vacuum pump and then washed by ethanol and deionized water. Afterwards, this powder was freeze-dried ((by freeze dryer Alpha 1-2 LD, Germany) under vacuum to remove the water. Finally, it was analyzed by XRD (Philips, Germany). Data was collected at 2θ from ~10° to 90°.
Dynamic light scattering analysis (DLS): Dynamic light scattering analysis (DLS) (DTS4.20, MALVERN) was used to measure nanoparticle size. The analyzing time, conducted by disposable zeta cell, was 60 seconds. The refractive indices of dispersant (water) and particles (nZVI nanoparticles) were chosen 1.33 and 1.59, respectively. The count rate for DLS measurement was 144.8 kcps, and the temperature was about room temperature. DLS measurement results were displayed as a plot of the intensity of the light absorbed by particles versus size distribution. All the samples were sonicated for 30 minutes before analysis.
SEM analysis of iron nanoparticles: The morphological features and surface characteristics of zero-valent iron nanoparticles were obtained by scanning electron microscope (SEM) (LEO1455VT, 10.0 kV, England). nZVI powder particles were prepared by the same method as that of XRD. These samples were coated with gold and observed by SEM.
Batch dechlorination experiments
A certain amount of methanol was used to extract PCBs from transformer oil. For this purpose, 100 ml methanol and 200 ml transformer oil were both added to a 500 ml volume balloon. A mixer with the constant shaking rate of 250 rpm was placed in the balloon for 5 minutes. After mixing, the sample was placed in a centrifuge (Hettich EBA21, Germany) at 1000 rpm for 15 minutes to separate oil and methanol phases [21].
Batch experiments were conducted in 100 mL three neck flask with stopper caps for one hour. Experiments were performed in 20 identical flasks for dechlorination under different conditions, including different temperatures and different nZVI concentrations. Each reaction was initiated by injecting 40 mL solution per flask containing certain amounts of PCBs solution and Fe° nanoparticles. The flasks were purged with purified N2 to remove oxygen or dissolved oxygen (DO). The initial concentration of PCBs was 13 ppm in all treatments. pH of solutions was adjusted to 4. The flasks were mixed by a mechanical blade at 30 rpm. The temperature was set in a range between 35°C and 75°C in a water bath with the nZVI content of 0.1 g. The solutions which contained different nZVI content that varied from 0.1 to 0.5 g worked at 75°C. After 10 minutes, 5 mL of the aqueous sample was withdrawn for the analysis of PCBs dechlorination efficiency. The solutions in the vials were centrifuged at 1500 rpm to separate the phases. A magnetic bar was used to attract and keep Fe particles at the bottom of the vials. The same amounts of Fe particles were consistently deposited to each flask after sampling. PCBs in the filtrate were analyzed by Agilent 6890N(England) gas chromatography (GC) equipped with an electron capture detector (ECD) and a HP-5 capillary column. The gas chromatograph was equipped with a 5% Phenyl methyl Siloxane capillary column. Neon served as the carrier gas with the flow rate of 1 mLmin-1. The initial column temperature was 70°C. The temperature increased at the rate of 3°C min-1 to 102 the final temperature of 260°C and was maintained at this temperature for 2 minutes. The injection port and detector temperatures were 250°C and 300°C, respectively. All experimental points were duplicated to ensure data precision.
Synthesis of starch Fe nanoparticles
During Fe synthesis, starch as a stabilizer prevents some side reactions such as reaction between BH4− and water and hinders the prepared NPs from agglomeration. Necked Fe nanoparticles as their aggregative nature were promptly deposited, while stabilized nanoparticles remained suspended after 48 hours of synthesis. It is likely that Fe3+ ions during reduction were trapped inside starch templates. The hydroxyl groups of starch deactivate the contacts and cause the stabilization of NPs inside the starch skeleton [22].
Characterization of synthesized iron nanoparticle
The XRD patterns of the non-stabilized and stabilized Fe-NPs are shown in Figure 1. The Feo peaks of stabilized Fe-NPs (2θ=44.75°,65.78°, and 82.14°) could be observed, indicating the crystal structure of Fe- NPs is of a regular bcc α-Fe crystalline state. However, another peak was observed for pristine Fe-NPs, at 35.1°, indicating that the Fe-NPs in the absence of starch had been oxidized. Therefore, as D. Zhao [8,20]. mentioned, it might be concluded that the starch can improve the antioxidant capacity of modified Fe-NPs. Particle size was measured by Zetasizer using DLS. The mean hydrodynamic diameter of nanoparticles was 82 nm. Figure 2 shows the surface morphologies of bare-nZVI and starch-nZVI. Figure 2a indicate that bare-nZVI has a chain-like structure with severe spherical aggregation. In contrast, the stabilized nZVI particles are detached because of minor magnetic force between iron nano particles. Results of GC chromatogram on transformer oil are summarized in Table 1. There were 29 PCBs congeners in transformer oil. These congeners were dechlorinated by modified Fe nano particles. Total concentration of PCBs was measured according to API method. It should be mentioned that during the process of dechlorination some other chlorinated compounds and intermediate by-products were produced. These products were not identified because of low sensitivity of GC-ECD to these compounds.

Figure 1. XRD patterns of Fe NPs: (a) Necked-Fe NPs, (b) Starch- Fe NPs.

Figure 2. SEM images of Necked (a) and Starch (b) iron particles.
| Congener Number | IUPAC Name | Descriptors | Kobs(min-1) starch nZVI(gL-1)=0.1 T=75°C | R2 |
|---|---|---|---|---|
| PCB 8 | 2,4'-Dichlorobiphenyl | P_2Cl_CP1_-- | 0.0489 ± 0.0012 | 0.9268 |
| PCB 37 | 3,4,4'- Trichlorobiphenyl | PP_3Cl _-- _M | 0.0787 ± 0.0027 | 0.8493 |
| PCB 28 | 2,4,4'- Trichlorobiphenyl | PP _3Cl_ CP1_-- | 0.0968 ± 0.0021 | 0.9678 |
| PCB 52 | 2,2',5,5'- Tetrachlorobiphenyl | -- _4CL_CP2_2M | 0.0907 ± 0.0013 | 0.9709 |
| PCB 44 | 2,2',3,5'- Tetrachlorobiphenyl | -- _4CL_CP2_2M | 0.1008 ± 0.0032 | 0.9577 |
| PCB 70 | 2,3',4',5- Tetrachlorobiphenyl | P_4CL_CP1_2M | 0.1022 ± 0.0025 | 0.9263 |
| PCB 77 | 3,3',4,4'- Tetrachlorobiphenyl | PP_4CL_ ---_2M | 0.1076 ± 0.0024 | 0.9829 |
| PCB 66 | 2,3',4,4'- Tetrachlorobiphenyl | PP _4CL_CP1_M | 0.1080 ± 0.0025 | 0.9888 |
| PCB 49 | 2,2',4,5'- Tetrachlorobiphenyl | P_ 4CL_CP2_M | 0.10860 ± 0.0031 | 0.9477 |
| PCB 60 | 2,3,4,4'- Tetrachlorobiphenyl | PP _4CL_CP1_M | 0.1210 ± 0.0023 | 0.9971 |
| PCB 74 | 2,4,4',5- Tetrachlorobiphenyl | PP _4CL_CP1_M | 0.1270 ± 0.0034 | 0.9595 |
| PCB 87 | 2,2',3,4,5'- Pentachlorobiphenyl | P_5CL_CP2_2M | 0.1285 ± 0.0031 | 0.9873 |
| PCB 82 | 2,2',3,3',4- Pentachlorobiphenyl | P_5CL_CP2_2M | 0.1298 ± 0.0052 | 0.943 |
| PCB 101 | 2,2',4,5,5'- Pentachlorobiphenyl | P_5CL_CP2_2M | 0.1320 ± 0.0031 | 0.9832 |
| PCB 118 | 2,3',4,4',5- Pentachlorobiphenyl | PP_5CL_CP1_2M | 0.1340 ± 0.0018 | 0.9964 |
| PCB 126 | 3,3',4,4',5- Pentachlorobiphenyl | PP_5CL_---- _3M | 0.1359 ± 0.0035 | 0.9059 |
| PCB 105 | 2,3,3',4,4'- Pentachlorobiphenyl | PP_5CL_CP1_2M | 0.1364 ± 0.0042 | 0.9959 |
| PCB 114 | 2,3,4,4',5- Pentachlorobiphenyl | PP_5CL_CP1_2M | 0.1406 ± 0.0024 | 0.9902 |
| PCB 99 | 2,2',4,4',5- Pentachlorobiphenyl | PP_5CL_CP2_M | 0.1485 ± 0.0036 | 0.9229 |
| PCB 156 | 2,3,3',4,4',5- Hexachlorobiphenyl | PP_6CL_CP1_3M | 0.1490 ± 0.0033 | 0.904 |
| PCB 153 | 2,2',4,4',5,5'- Hexachlorobiphenyl | PP_6CL_CP2_2M | 0.1522 ± 0.0015 | 0.9718 |
| PCB 158 | 2,3,3',4,4',6- Hexachlorobiphenyl | PP_6CL_CP2_2M | 0.1525 ± 0.0016 | 0.9349 |
| PCB 138 | 2,2',3,4,4',5'- Hexachlorobiphenyl | PP_6CL_CP2_2M | 0.1586 ± 0.0041 | 0.9427 |
| PCB 128 | 2,2',3,3',4,4'- Hexachlorobiphenyl | PP_6CL_CP2_2M | 0.1697 ± 0.0027 | 0.9904 |
| PCB 179 | 2,2',3,3',5,6,6'- Heptachlorobiphenyl | --_7CL_CP4_3M | 0.1448 ± 0.0017 | 0.9685 |
| PCB 183 | 2,2',3,4,4',5',6- Heptachlorobiphenyl | PP_7CL_CP3_2M | 0.1713 ± 0.0037 | 0.9714 |
| PCB 189 | 2,3,3',4,4',5,5'- Heptachlorobiphenyl | PP_7CL_CP1_4M | 0.1745 ± 0.0013 | 0.992 |
| PCB 180 | 2,2',3,4,4',5,5'- Heptachlorobiphenyl | PP_7CL_CP2_3M | 0.1828 ± 0.0025 | 0.9371 |
| PCB 170 | 2,2',3,3',4,4',5- Heptachlorobiphenyl | PP_7CL_CP2_3M | 0.2183 ± 0.0034 | 0.9747 |
Effect of stabilized Fe concentration
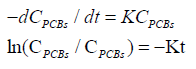
Catalytic dechlorination of PCBs was investigated with various modified nZVI content from 0.1 gL-1 to 0.5 gL-1. As is shown in Figure 3, the highest dechlorination efficiency was obtained at nZVI dosage of 0.5 gL-1. Previous research has shown that large amount of Fe particles increased the active surface area for dechlorination activities [23]. Eq. 1 shows a pseudo-first-order equation that describes the rate of PCBs degradation [24,25].
 (1,2)
(1,2)

Figure 3. Effect of starch nZVI content on the removal of PCBs. C0=13 mgL- 1, T=75°C, initial pH=4.
Where CPCBs express concentration of PCBs, CPCBs0 is the initial concentration of contaminants, t is the reaction time, and K is observed rate constant of pseudo-first-order reaction. The rate constants can be calculated by logarithmic regression of concentration versus time according to the Eq. 2. Table 2 shows the results of kinetic study of PCBs remediation with different modified Feo concentration. The reaction rate slightly grows as the NPs’ content increases in the solution.
| Starch Fe (gL-1) | Kobs(min-1) T=75°C | R2 | Temperature (°C) | Kobs(min-1) starch Fe (gL-1)=0.1 | R2 |
|---|---|---|---|---|---|
| 0.1 | 0.0202 ± 0.0040 |
0.9989 | 35 | 0.0092 ± 0.0026 |
0.9819 |
| 0.2 | 0.0258 ± 0.0032 |
0.9933 | 45 | 0.0105 ± 0.0033 |
0.9879 |
| 0.3 | 0.0298 ± 0.0041 |
0.9889 | 55 | 0.0132 ± 0.0031 |
0.9849 |
| 0.4 | 0.0370 ± 0.0025 |
0.9931 | 65 | 0.0160 ± 0.0025 |
0.9913 |
| 0.5 | 0.0456 ± 0.0023 |
0.9926 | 75 | 0.0202 ± 0.0017 |
0.9989 |
Temperature effect
The results of total PCBs degradation at different temperatures were shown in Figure 4. Dechlorination of PCBs using modified Fe is facilitate at higher temperatures which causes an increase in degradation efficiency from 40.76 to 70%, Figure 5. Table 2 summarizes the variation of Kobs with temperature. The linearized form of the Arrhenius equation describes the relation between the temperature and Kobs:
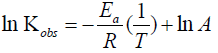
Where Ea is the activation energy (kJmol-1), R is the ideal gas constant (kJmol-lK-1), T is the temperature given in Kelvin, and A is the frequency factor. Figure 6 shows liner graph of Kobs versus T-1 for degradation of PCBs. Ea/R was calculated from the slope of this graph. The apparent activation energy which provides insight into the binding process of PCBs to the Fe-NPs was 17.712 kJmol-1 between 35°C and 75°C. The activation energy can be used to clarify the mechanism of PCBs binding to the Nano particles. Physiosorption and chemiosorption are the two possible mechanism of binding. Physiosorption generally has activation energy below 40 kJmol-1, while chemiosorption requires more energy which is above 40 kJmol-1 for a chemical attraction. The activation energy data from experiments elucidates that the binding process of PCBs to the Fe-NPs happens through physiosorption as the activation energy is 17.712 kJmol-1 [4].

Figure 4. Temperature effect on the dechlorination of total PCBs. C0=13 mgL-1, C (nano)=0.1gL-1, initial pH=4.

Figure 5. Effect of temperature on dechlorination efficiency by modified NPs, PCBs; C0=13 mgL-1, C (nano)=0.1gL-1, initial pH=4.

Figure 6. Estimation of activation energy by Arrhenius Eq: PCBs dechlorination by modified Fe NPs.
Kinetics for PCBs congeners dechlorination
Chlorinated biphenyls were reduced while iron oxidized in the solution. Hydrogenolysis is the most possible reductive pathway through which hydrogen atoms replace chlorine atoms [26,27]. The major equation for hydrogenolysis of chlorinated Compound is as follow Figure 7.

Figure 7. Equation for hydrogenolysis of chlorinated compound.
Twenty-nine PCBs congeners were reduced by the modified nano particles. The result of kinetic studies of parent congeners was shown in Table 1. Previous investigations have shown that para position chlorines at each of the phenyl rings are easier to remove compared with ortho and meta positions. Also, the ortho position tends to be released more rapidly than that at the meta position [28]. The oxidation rate constants for most of the congeners decreases in the order of PP_ (higher)CP_(lower) M > PP_ (lower)CP_(higher) M > P_ CP_M > --_CP_M in this study. PCBs 66, 77, 118, 183 did not follow this order, and the reason was not obvious. Remediation reactions were influenced by the total number of chlorine atoms. As shown in Table 1, the dechlorination rate constant raised as the number of chlorine atoms increased, and heptachlorobiphenyls had the highest amount of kinetic constants. In the case of PCBs 179 (7Cl), 52 (4Cl) with the non para position chlorine, they have shown the lower reaction rate compared with the hexachlorobiphenyls, trichlorobiphenyls, respectively [28-30].
Chemical bonds between starch hydroxyl groups and Fe Ion prevents the agglomeration of Fe-NPs and causes the higher active surface area of NPs. The average size of stabilized Np was 82 nm. Therefore, starch as a cost effective and an environmentally friendly modifier was used to increase the reaction rate and also enhance the percentage of PCBs dechlorination. Increasing the concentration of Fe-NPs in the solution from 0.1 gL-1 to 0.5 gL-1 nearly doubles the rate of PCBs dehalogenation. Temperature plays a significant role in dechlorination efficiency. As the temperature increases from 35°C to 75°C, the degradation efficiency grows from 40.76 to 70%. The activation energy for this progress was 17.712 kJmol-1 which clarifies that the binding process of PCBs to the NPs is controlled by physiosorption. It was thought that hydrogenalysis is the most possible pathway for dechlorination of PCBs. The kinetic constant for most of the 29 congeners decreased according to the following order: PP_ (higher)CP_(lower) M > PP_ (lower)CP_(higher) M > P_ CP_M > --_CP_M.
• CPx: These congeners include chlorine substitution at only one (CP1, mono-ortho) or more of the ortho positions (CPx) of the 2, 2', 6, or 6' chlorinated.
• yCL: These congeners have a total of two or more chlorine substituents (regardless of position).
• P/PP: These congeners have one para position (P), these congeners have both para positions (PP) of the (4 and 4') chlorinated.
• xM: These congeners have one meta position (M) or more of the meta positions (xM) of the (3, 3', 5, and 5') chlorinated.
• R2 is the linearity of the data fitting.
• 95% confidence interval was provided for all the values of first- order rate constant.
The first author would like to thank Powercontrol Eng. Co for financial assistance and providing lab space. Cooperation and scientific aids provided by professor Morteza Sohrabi is sincerely acknowledged.
Journal of Civil and Environmental Engineering received 1798 citations as per Google Scholar report


