Short Communication - (2023) Volume 11, Issue 3
Received: 02-Mar-2023, Manuscript No. jaat-23-92657;
Editor assigned: 03-Mar-2023, Pre QC No. P-92657;
Reviewed: 16-Mar-2023, QC No. Q-92657;
Revised: 21-Mar-2023, Manuscript No. R-92657;
Published:
28-Mar-2023
, DOI: 10.37421/2329-6542.2023.11.257
Citation: Lignell, Antti. “Astrophysical Data Exploration and
Analysis in Virtual Reality.” J Astrophys Aerospace Technol 11 (2023): 257.
Copyright: © 2023 Lignell A. This is an open-access article distributed under the terms of the Creative Commons Attribution License, which permits unrestricted use, distribution, and reproduction in any medium, provided the original author and source are credited.
In the analysis and dissemination of scientific data, which is becoming increasingly complex and large in volume, data visualization plays an important role. Computers, both hardware and software, which are our primary tools of the trade, may, in many ways, ease the scientist's burden of data "reduction" as they perform the calculations that turn raw data into refined products and meta information. However, the most crucial step in the scientific method, analysis (and subsequent interpretation), cannot be performed solely by computers or automated algorithms, such as machine-learning tools. These tools are only as good as the programming and input (“truth”) knowledge that drives them. As a result, the critical breakthroughs that are hidden or obscured by the multi-dimensional dependencies cannot be achieved solely by computers or automated algorithms. Typically, there are not many of these discoveries. It is through representation and basic investigation that disclosures of fundamental and nuanced information and understanding are made; In the context of neuralnetwork algorithms and machine learning, visualisation is often the most reliable method for pruning training sets and can be used to comprehend the intricate systems involved in mapping these networks [1].
In order to sort and analyze datasets of ever-increasing volume and complexity, scientists in all fields increasingly rely on machine learning algorithms. Although it is simple to extract trends and outliers, it will still be necessary to examine the data carefully and closely in order to investigate and decipher intricate behavior, as well as to identify systematics and false positives. As a result, we must incorporate new technologies to make scientific research and analysis easier. The spatial-kinematic dimensions serve as the foundation for both observations and simulations in astrophysical data, which is multi-parameter by definition. Scientists are now able to use VR headsets and GPUs, as well as a variety of game development tools, to efficiently query and interact with complex data thanks to the widespread availability of these technologies [1].
The research on galaxy evolution, cosmic large-scale structure, galaxy– galaxy interactions, and gas/kinematics of nearby galaxies in survey and targeted observations informs and drives the development and results of our custom-built interactive VR tools, which we refer to as the iDaVIE suite, which are presented in this paper. We believe that a paradigm shift to new software, technology, and methods that exploit the power of visual perception will play an increasingly important role in bridging the gap between statistical metrics and new discovery in the new era of Big Data ushered in by major facilities like the SKA and LSST. The iDaVIE software system has a beta version that is free and available to the public [2].
It is this step, investigation and approval of the information, for which we bring to bear our generally human of devices - instinct and innovativeness - that is to a great extent informed by graphical representation, taking advantage of the human visual impression of the real world. Multi-color histograms, charts, imaging, 3D (volumes), and dynamic rendering (i.e., videos) are all examples of graphic types. All are made to work best with how humans process information through visual representations. This is typically done by looking at a flat, twodimensional computer screen, which actually hinders human visual development; notably, the capacity to assimilate and perceive in our natural three-dimensional space and, of course, the dynamic fourth dimension of time using all of our vision. When 3D and multi-dimensional data sets are projected onto a flat screen, this becomes especially difficult. Fortunately, our graphics can now move past this limitation thanks to modern technology [3].
Immersion technology has made it much easier and more natural to visualize complex data, whether it comes from an instrument experiment or computer models and simulations, thanks to the development of graphical processing units (GPUs). Curved monitors and screens provide immersion, and the most recent digital projection planetariums are being used for scientific visualization in an increasing number of cases. Immersion and virtual reality technologies, such as headsets, walls, and cylinders (such as CAVE) and full-dome (digital 360 degree planetarium) facilities, showed promise in early efforts to visualize and conduct research with astrophysical data. One of the most promising technologies is socalled "virtual reality," which we will now refer to as "VR." It places a person and their data in an artificial, three-dimensional environment, or "game," since VR was originally developed for gaming; essentially, a three-dimensional "monitor" that surrounds the user. Instead of being constrained by 2D projections, the scientist is now able to move within, interact with, and manipulate the data with natural gestures [4].
VR and its use with astrophysical data are the primary topics of this investigation. Due to this feature of immersion, any multi-dimensional data, including the majority of scientific research data, lend themselves well to the VR environment. An excellent illustration is astronomy; Astronomers investigate in depth the inner structures of galaxies, nebulae, stars, and the universe as a whole (such as the cosmic large scale structure or the Cosmic Web). All of these are dynamic in three dimensions (time dimension) and have traditionally been analyzed in sliced or projected two dimensions. This greatly simplifies but also restricts our ability to comprehend the intricate systems we are attempting to unravel. Vivid innovation opens up such countless potential outcomes and new roads to investigate our rich - and dramatically extending - multi-faceted informational collections [2].
The creation of interactive software tools is the next step in this evolutionary process as the GPU and VR hardware advance. According to Baracaglia and Vogt's summary, to quote: We conclude that, similar to a ds9-VR, the creation of a robust, universal application devoted to the exploration and visualization of 3D observational datasets is most likely the path forward for virtual reality in astrophysics research. In fact, the primary goal of our research is to develop virtual reality tools that enable interaction with scientific data. We designed the IVL to fully utilize immersive technology in light of the prospect of conducting research in the Big Data era of the SKA and other major next-generation telescopes and surveys, particularly the LSST. The following were five guiding principles in this regard: 1) multidisciplinary adaptability; 2) collaborative platforms; 3) revolutionary and transformative; 4) cloud-based interface; and 5) advocacy and engagement with our peers and the general public who are interested. Largeformat "wall" screens, curved and full-domed facilities, and finally VR stations were used in our visualisation lab [5].
It is well known that virtual reality holds promise: It is the most natural way to interact with data, combining discovery and (through software tools) quantitative analytics and it is best suited to multi-dimensional data sets with particles and volumes. When compared to standard 2D rendering, 3D rendering makes it possible to convey significantly more information and opens up new avenues for data analysis and exploration. The final point has barely been utilized, but its potential is nearly limitless. Optimizing code for multi-thread GPU programming and working within the constraints of rendering (or "gaming") engines, in addition to the specialized equipment and underlying system software required, is challenging.
None.
None.
Google Scholar, Crossref, Indexed at
Google Scholar, Crossref, Indexed at
Google Scholar, Crossref, Indexed at
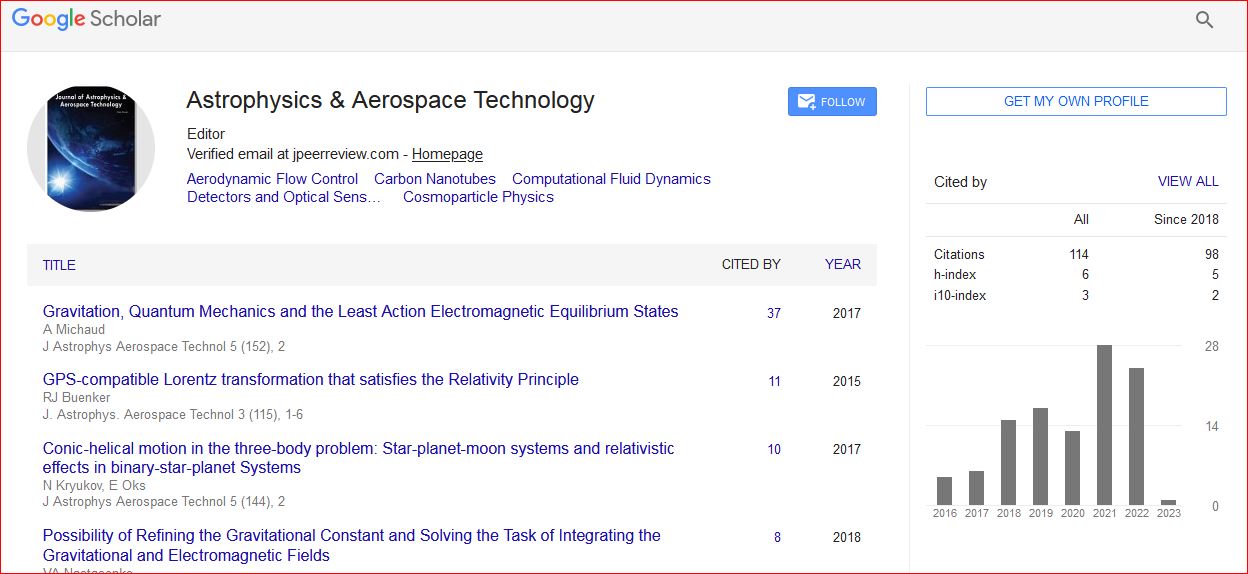
Astrophysics & Aerospace Technology received 114 citations as per Google Scholar report