Research - (2021) Volume 10, Issue 4
Received: 22-Dec-2020
Published:
19-Jan-2021
Citation: Awoke Seyoum Tegegne, Getu Degu Alene. "Sociodemographic
and Clinical Predictors of Hypertension and Type2 Diabetes
among adults Under treatment at FelegeHiwot Teaching and Specialized
Hospital, North-western Ethiopia." J Hypertens (Los Angel) 10 (2021): 279.
Copyright: © 2021 Awoke Seyoum Tegegne. This is an open-access article
distributed under the terms of the Creative Commons Attribution License, which
permits unrestricted use, distribution, and reproduction in any medium, provided
the original author and source are credited.
Background: One of the chronic diseases all over the world due to its significant contribution for the existence of the other health problems is hypertension. It is known that hypertensive patients also exposed to diabetes. The objective of current investigation was to identify socio- demographic and clinical predictors for the variation of hypertension and type2 diabetes for adults under treatments.
Methods: In current investigation, a random sample of 748 hypertensive and type2 diabetic patients was selected randomly. A retrospective longitudinal study design was conducted on the selected patients who were receiving treatments for both hypertension and type2 diabetes.
Results: The current investigation revealed that age and weight of patients were positively and significantly associated with existence of hypertension and type2 diabetes whereas; visiting times were negatively associated the variables of interests. Rural patients, patients who are smoking, drinking alcohols and patients with family disease history were joint predictors for existence of the variables of interests. The interactions of visiting times with sex, visiting times with residence area and age with sex of patients were also statistically significant factors for the existence of response variables. Hypertensive patients living in rural areas and those who are drinking and smoking were highly affected by the existence of type2 diabetes.
Conclusion: Awareness should be created to those hypertensive and type2 diabetic patients to attend properly their medication as prescribed by the health staff. Patients should also be advised to checkup their hypertension (systolic/ diastolic) and diabetes of type2 regularly.
Joint Modeling, Longitudinal Data Analysis,hypertensive, Systolic, diastolic, type2 diabetes, Mixed Model
Hypertensive and type2 diabetes are two general conditions that have significant impacts on the health care systems in both the developed and developing world [1]. The existence of type2 diabetes(the amount of fasting glucose concentration in the blood) is about 2.5 times more likely to be occurred in hypertensive patients as compared to the others [2]. The two associated and co-infected diseases often co-exist and lead to series problems in cardiovascular prognosis [3]. Majority of the adult population who are affected with hypertension are also exposed to stroke, a series heart disease and the like [4]. Effective strategies to prevent type2 diabetes in people with hypertension are urgently needed, especially in countries with a high population prevalence of hypertension [5].
Hypertension is one of the source and risk factor for the growth of a number of disease progression [6,7]. Progression of hypertension is also associated with cardiac and vascular abnormalities. This further becomes harmful for other parts of the body like heart, kidney brain and other organs of the body [1]. The progress of hypertension is used to diagnoses whether or not a person is experiencing systolic and diastolic blood pressure [8].
A hypertensive and type2 diabetic patient visits a hospital frequently in order to follow up the progression of the two diseases. For hypertensive patients, the average systolic reading is higher than 140 mm Hg and the average diastolic reading is greater than 90 mm Hg[8]. For such patients, the small blood vessels are mostly affected over time. These blood vessels become toughened, less elastic and this further leads to organ injure.Therefore, maintaining a normal blood pressure is a very important component of reducing the risk of a heart attack, stroke or organ injure.
The existence of very high value for both top and bottom reading indicates that a person is in a situation of hypertension and is related with other diseases such as coronary heart disease, diabetes of type2, etc. Socio-demographic and clinical covariates can affect for the development of hypertension and existence of type2 diabetes for individuals affected by two diseases.
Previously, separate studies were conducted to identify factors influenced only systolic blood pressure(SBP) and diastolic blood pressures(DBP) [9, 10]. A joint modelling of continuous or discrete responses with time to event are also commonly conducted for each response[11]. However, there are controversies about the predictor covariates from the findings obtained from the previous studies [10, 11]. The joint modelling of two longitudinal responses with fixed and random-effects are more flexible to identify association between hypertension and type2 diabetes [12-14].
Therefore, the objective of current investigation was to identify joint predictors of hypertension (systolic/diastolic) and type2 diabetes for patients under treatment at FelegeHiwot Teaching and Specialized Hospital, north western Ethiopia. To the best of our knowledge, there is a scarcity of previous studies conducted to identify joint predictors of two longitudinal and inter related outcomes in the study area.
Previous researchers recommended that, joint modeling gives more efficient inference than separate analyses given that the interest is drawing joint inference about the similar or different outcomes [15,16]. It is also our firm belief that statistically significant interaction effects of the two outcomes obtained in current investigation have practical contribution by giving insight to complex and advanced theories with the application to one of the critical problems in life science and public health practitioners.
Study Design:A prospective cohort study design was conducted on 748 hypertensive and diabetic type 2 patients at FelegeHiwot teaching and specialized hospital, North-west Ethiopia.
Source of data: The data used for current investigation were secondary data obtained at FelegeHiwot Specialized and Teaching Hospital with original purpose of follow up/ check-up the amount of blood pressure and fasting glucose concentration in the blood.
Sample size and sampling procedure: A total of 748 patients who met the eligibility criteria and who had repeated measures of hypertension and type2 diabetes were included in current investigation. The data were recorded at every follow time by the health staff prospectively using the format developed by the ministry of health. In data collection procedures, a sample of data and variables were collected in the medical chart of each selected patient by the health staff after orientation about the variables needed for current investigation.
Measurements: The diagnosis of type 2 diabetes was conducted by the endocrinologists in the hospital according to the fasting venous blood glucose concentration (tested with Glucose Oxidize Method) and was leveled based on the 1999 World Health Organization criteria [11]. The hypertension reading was also tested and recorded by qualified health staff at each visiting time of patients.
Eligibility Criterion: Both hypertensive and diabetic type 2 adult patients whose follow ups were between September 2015 and August 2017 with a minimum of three follow ups were eligible for this study.
Variables under current investigation: The hypertension reading and amount of fasting glucose concentration in the blood of a patient measured repeatedly at each follow up visit were considered as response variables.
Age in years, weight in kg, smoking status (yes, no), drinking status(yes, no), frequent use of meat (yes, no), frequent use of vegetables (yes, no), physical exercise (yes, no), residence area (rural, urban), sex (male, female), family disease history for hypertension or type 2 diabetes (yes, no), follow ups visits, marital status(living with partner, living without partner), level of education(non-educated, educated), and chewing chat(yes, no) were considered as covariates.
Formulation of Joint Modeling: Suppose a sequence of longitudinal measurements yijk, j = 1, 2, …, nij, i = 1, 2, …,n and k = 1,2 which represent the jth observation, from the ith subject, for the kth response variable. The linear mixed-effects model for each response variable on subject i taken at time t can be defined as:
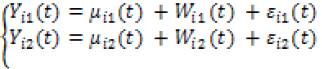
where  represent for the average result,ai1 and ai2 and bi1(t) and bi2(t) represent individual/subject specific random intercepts and random slopes respectively. These components can describe how the subject specific profiles deviate from the average profile for the two outcomes. εik (t), where k = 1,2 is error term.
The baseline characteristics of patients are indicated in Table 1. Table 1 shows that 362 (44.4%) of the patients were females, 225 (30.1%) were lived in rural area, 236 (31.6%) were living without partner. Among the patients, 145 (19.4%) were smokers, 215 (28.7%) were chewing chat. About 327 (43.7%) of the respondents were drinking alcohol. Regarding physical exercise, among the patients, 252 (33.7%) did not make any physical exercise. Table 1 also indicates that, the majority of the patients, 693 (92.6%) were frequently meat eaters and the majority of them were not vegetarians. Regarding the family disease history, 503 (67.2%) had family disease history for any one of the two diseases.
As it is indicated in Table 1, continuous predictors were also recorded and the average age of patients was 45 years old, average weight of all patients was 64 kg and the average height of patients was 1.5 meter. The baseline characteristics of dependent variables were registered and indicated in Table 1. Table 1 indicates that the average hypertension value was 146/95 mmHg and average fasting glucose concentration was 132 mg/dL.
| Characteristics | Average | Category | Frequency (n) | Percent (%) |
|---|---|---|---|---|
| Age in years | 45 years | |||
| Weight in kg | 64 kg | |||
| Height in meters | 1.5m | |||
| Baseline high blood pressure | 146/105 | |||
| Sex | Female Male | 362 386 | 48.4 51.6 | |
| Education level | illiterate primary Secondary and above | 125 368 255 | 16.7 49.2 34.1 | |
| Residence | Rural Urban | 225 523 | 30.1 69.9 | |
| Marital Status | Living with partner Living without partner | 512 236 | 68.4 31.6 | |
| Education | Illiterate Primary Secondary and above | 58 37 19 | 39.19 25 12.84 | |
| Smoking | No Yes | 145 603 | 19.4 80.6 | |
| Chewing | No Yes | 533 215 | 71.3 28.7 | |
| Alcohol | No Yes | 421 327 | 56.3 43.7 | |
| Physical exercise | Never Rarely frequently | 252 296 200 | 33.7 39.6 26.7 | |
| Consumption of meat | Never Rarely frequently | 55 335 358 | 7.4 44.8 47.9 | |
| Consumption of vegetation | Never Rarely frequently | 35 435 278 | 4.7 58.2 37.2 | |
| Family disease history (Diabetes or hypertensive) | No Yes | 245 503 | 32.8 67.2 |
Both the fixed and random components of the model were selected using Akakai Information Criteria (AIC) and Bayesian Information Criteria (BIC). Among the random effects, fixed effect + random intercept and random slope had the smallest AIC and BIC; hence, it has been selected as a random effect that should be included for current investigation.
In current investigation, model building was started from single covariate analysis approach. To do this, first a single covariate analysis was conducted to screen out potentially significant variables in the multi covariate model.
The joint model was conducted to hypertension and type2 diabetes. In order to fit the joint model of the two response variables namely, hypertension and type 2 diabetes, linear mixed effect models were considered separately for parameter estimation of marginal models as shown in Table 2 and then conditional random effects model (combined the separate models of hypertension and type 2 diabetes) was developed as inTable 3. Table 3 also shows the joint multivariate distribution of random effects of the variables of interests. Finally, parameter estimation of hypertension and type 2 diabetes considering hypertension as a linear predictor was constructed as shown in Table4. The main and significant interaction effects of the joint model of two outcomes are also indicated in Table 4.
The univariate separate model in Table 2 indicates that; age, weight, sex, residence area, smoking status, drinking status and visiting times statistically affected the two response variables. Similarly, among the interaction effects; visiting time with sex of patients, Age with sex of patients, visiting time with residence area significantly affected the variable of interests.
| Parameter | Hypertension | Type2 diabetes | ||||
|---|---|---|---|---|---|---|
| Effect | Std. deviation | P- Value | Effect | Std. deviation | P- Value | |
| Intercept | 134.82/91.4 | 1.66 | <.001 | 121 | 6.69 | 0.33 |
| Age | 0.18 | 0.16 | 0.04* | 0.65 | 0.81 | 0.02* |
| Weight | 0.52 | 0.15 | <0.01* | 0.71 | 0.38 | <.01* |
| Physical exercise (Ref.= frequently) | ||||||
| Never | 6.85 | 2.69 | 0.23 | 27.33 | 2.80 | 0.75 |
| rarely | 2.23 | 0.23 | 0.14 | 5.32 | 1.52 | 0.15 |
| Sex (Ref.=Male) | ||||||
| Female | -1.97 | 3.47 | 0.01* | - 4.36 | 2.34 | 0.02* |
| Residence (Ref.=Urban) | ||||||
| Rural | -1.09 | 2.4230 | 0.04* | -1.79 | 2.50 | <0.01* |
| Marital Status(ref.=Single) | ||||||
| Divorce | -14.51 | 7.95 | 0.08 | -8.67 | 4.76 | 0.02 |
| Married | -15.07 | 5.01 | 0.01 | -9.90 | 3.85 | <0.01 |
| Smoking (Ref.=Yes) | ||||||
| No | -0.65 | 1.61 | 0.03* | -1.39 | 6.26 | 0.04* |
| Chewing Chat (Ref.=Yes) | ||||||
| No | -3.93 | 2.91 | 0.31 | -1.65 | 3.73 | 0.96 |
| Drinking alcohol (Ref.=Yes) | ||||||
| No | -3.98 | 2.54 | 0.02* | -5.75 | 2.17 | 0.03* |
| Level of Education (Ref.=Tertiary) | ||||||
| Illiterate | 6.62 | 4.60 | 0.24 | -9.42 | 2.29 | 0.72 |
| Primary | 5.71 | 4.34 | 0.28 | 13.27 | 2.14 | 0.59 |
| Secondary | 4.13 | 5.89 | 0.48 | -5.06 | 2.08 | 0.85 |
| Visiting time | -0.08 | 0.11 | 0.041* | -0.38 | 0.18 | 0.03* |
| Visiting time *sex (Ref.=Male) | ||||||
| Female | -1.97 | 3.47 | <0.01* | 0.36 | 1.34 | 0.01* |
| Age* sex Ref.=Male) | ||||||
| Female | -1.27 | 4.47 | 0.01* | 1.34 | 1.24 | 0.01* |
| Visiting time *Residence area (Ref.=Urban) | ||||||
| Rural | -0.27 | 3.47 | <0.01* | -0..26 | 1.34 | 0.02* |
The SAS procedure using identity link function allowed us to impose the joint distribution on the random effects from the two separate models.
The conditional independence random intercept model in Table 3 indicates that age, weight, physical exercise, family disease history, smoking status, drinking alcohol status, and visiting times were statistically significant for the two responses. On the other hand, the interactions effects like visiting time with sex, age with sex, and the interaction of visiting time with residence area significantly affected the variable of interests.
In Table 3, the same sign in parameter estimation indicates for positive correlation between the two responses. The conditional independence assumption in Table 3 was too restrictive in introducing estimation errors and the parameter estimation is not reliable. During this time relaxation of conditional independence by re-fitting the joint random intercepts model with possible correlated errors is important. However, the relaxation of conditional independence approach in Table 3 lacked to be converged. In this condition, it is important to introduce conditional dependence of one response in terms of the other using linear predictor [17] which validates the observed correlation between the two responses arising from the association of random intercepts. This was done using generalized linear mixed effect model for type 2 diabetes as a response and hypertension as a linear predictor. The generalized linear mixed effect model of type 2 considering hypertension as linear predictor is indicated in Table 4.
| Parameter | Hypertension | Type2 diabetes | ||||
|---|---|---|---|---|---|---|
| effect | Std. deviation | P- Value | effect | Std. deviation | P- Value | |
| Intercept | 135/92 | 1.66 | <.001 | 125.95 | 6.69 | 0.33 |
| Age | 0.18 | 0.16 | 0.04* | 0.65 | 0.81 | 0.02* |
| Weight | 0.52 | 0.15 | <0.01* | 0.71 | 0.38 | <.01* |
| Physical exercise (Ref.= frequently) | ||||||
| Never | 6.85 | 2.69 | 0.023* | 27.33 | 2.80 | 0.75 |
| rarely | 2.23 | 0.23 | 0.014* | 5.32 | 1.52 | 0.15 |
| Sex (Ref.=Male) | ||||||
| Female | -1.97 | 3.47 | 0.010* | - 4.36 | 2.34 | 0.02* |
| Residence (Ref.=Urban) | ||||||
| Rural | -1.09 | 2.4230 | 0.064 | -1.79 | 2.50 | <0.051 |
| Family disease history for hypertension or diabetes (Ref.=yes) | ||||||
| No | -4.25 | 1.45 | 0.023* | -2.62 | 1.52 | 0.020* |
| Marital Status (ref.= living without partner) | ||||||
| Living with partner | -14.51 | 7.95 | 0.08 | -8.67 | 4.76 | 0.02 |
| Smoking (Ref.=yes) | ||||||
| No | -0.65 | 1.61 | 0.03* | -1.39 | 6.26 | 0.04* |
| Chewing Chat (Ref.=yes) | ||||||
| No | -3.93 | 2.91 | 0.31 | -1.65 | 3.73 | 0.96 |
| Drinking alcohol (Ref.=yes) | ||||||
| No | -3.98 | 2.54 | 0.02* | -5.75 | 2.17 | 0.03* |
| Level of Education (Ref.=Tertiary) | ||||||
| Illiterate | 6.62 | 4.60 | 0.24 | -9.42 | 2.29 | 0.72 |
| Primary | 5.71 | 4.34 | 0.28 | 13.27 | 2.14 | 0.59 |
| Secondary | 4.13 | 5.89 | 0.48 | -5.06 | 2.08 | 0.85 |
| Visiting time | -0.08 | 0.11 | 0.041* | -0.38 | 0.18 | 0.03* |
| Visiting time *sex (Ref.=Male) | ||||||
| Female | -1.97 | 3.47 | <0.01* | 0.36 | 1.34 | 0.01* |
| Age* sex (Ref.=Male) | ||||||
| Female | -1.27 | 4.47 | 0.01* | 1.34 | 1.24 | 0.01* |
| Visiting time *Residence area (Ref.=Urban) | ||||||
| Rural | -0.27 | 3.47 | <0.01* | -0..26 | 1.34 | 0.02* |
As shown in Table4, age, hypertension, weight, physical exercise, sex, residence area, family disease history, smoking status, drinking status, marital status, chewing chat and visiting times significantly affected the progression rate of type2 diabetes. Hence, as age of a patient increased by one year, the amount of fasting glucose concentration in the blood was increased by 0.65 mg/dL (95% CI: (0.03, 0.98), p-value < 0.01) keeping the other variables constant. As weight of a patient increased by one kg, the amount of fasting glucose concentration in the blood also increased by 0.71 mg/dL (95% CI: (0.04, 0.99), p-value < 0.01) keeping the other variables in the model constant.
Similarly, as patients’ hypertension increased by one unit, the amount of fasting glucose concentration in blood also increased by 0.67 mg/dL (95% CI :( 0.03, 0.95), p-value < 0.01). As visiting time of a patient increased by one unite, the amount of fasting glucose concentration in blood of patients decreased by 0.38 mg/dL (95% CI: (-3.45, -0.54), p-value = 0.03).
Comparing female patients with males, the amount of fasting glucose concentration in the blood of female patients was decreased by 2.36 (95% CI: (-4.43, -0.65), p-value=0.02) as compared to male patients keeping the other variables constant.
The amount of fasting glucose concentration in the blood of rural patients was decreased by 1.79(95% CI: (-3.98, -0.87), p-value<0.01) as compared to that of urban patients. Comparing smokers with that of non-smokers, the amount of fasting glucose concentration in the blood of non-smokers was decreased by 1.39 (95% CI: (-3.24, -0.45), p-value=0.04) as compared to smokers. Similarly, the average amount of fasting glucose concentration in the blood of non- alcoholic consumers were decreased by 3.75 (95% CI: (-6.25, -0.53) as compared to non- alcoholic consumers keeping the factors constant.
Similar to main effects, some interaction effects were also significant in Table4. Some of the significant interaction effects are the following.
Interaction Effects between visiting time and sex of patients:The results in Table3 and Figure1 indicated that as visiting time increased by one unit, the amount of fasting glucose concentration in the blood of female patients decreased by 0.36 mg/dL compared to male patients given the other variables constant. Therefore, the smaller variation gap in variable of interest between males and females observed at the beginning of the follow-up period, increased up the variation as the number of follow-up visits increased.
Interaction effect between visiting time and residence areas:Even though, rural patients had smaller amount of fasting glucose concentration in the blood at initial of the treatment, the rate of decrease for average amount of fasting glucose concentration for urban patients was greater than that of rural patients after initiation of treatment. Hence, as visiting time of patients increased, the average decreasing rate for urban patients was faster than that of rural patients keeping the other things constant
Interaction effect between age and sex of patients:Table 4 indicate that as age of a patient increased by one unit, the average amount of fasting glucose concentration also increased. Comparing females with male patients, the rate of increasing for the variable of interest on female patients was smaller than that of male patients.
The joint mixed effect model in Table 4 indicates that the variation of hypertension is also associated with the amount of fasting glucose concentration in the blood of patents. The association between the variable of interests increased as visiting time increased. In the current investigation, the variation between the random slopes for the variable of interests was positive and hence, the larger the value of random slope between the variables of interest indicates the positive strong association between the response variables.
| Parameter | Effect | Std. deviation | 95 % CI | P-Value | |
|---|---|---|---|---|---|
| Intercept | 126.95 | 6.69 | -2.54 | 9.87 | 0.33 |
| Age | 0.65 | 0.81 | 0.03 | 0.98 | 0.02* |
| Weight | 0.71 | 0.38 | 0.04 | 0.99 | <0.01* |
| Hypertension | 0.67 | 0.52 | 0.03 | 0.95 | <0.01* |
| Visiting time | -0.38 | 0.18 | -3.45 | -0.54 | 0.03* |
| Physical exercise (Ref.= frequently) | |||||
| Never | 2.33 | 0.80 | 0.87 | 4.15 | < 0.01* |
| rarely | 1.32 | 0.52 | 0.98 | 3.83 | 0.03* |
| Sex (Ref.=Male) | |||||
| Female | - 2.36 | 2.34 | -4.43 | - 0.65 | 0.02* |
| Residence (Ref.=Urban) | |||||
| Rural | -1.79 | 2.50 | -3.98 | -0.87 | < 0.01* |
| Family disease history for hypertension or diabetes (Ref.=yes) | |||||
| No | -2.34 | 0.56 | -4.45 | -0.04 | <0.01* |
| Marital Status (ref.= living without partner) | |||||
| Living with partner | -2.90 | 3.85 | -4.23 | - 0.75 | <0.01* |
| Smoking (Ref.=Yes) | |||||
| No | -1.39 | 6.26 | -3.24 | -0.45 | 0.04* |
| Chewing Chat (Ref.=Yes) | |||||
| No | -1.65 | 3.73 | -3.56 | -0.45 | 0.03* |
| Drinking alcohol (Ref.=Yes) | |||||
| No | -3.75 | 2.17 | -6.25 | -0.53 | 0.03* |
| Level of Education (Ref.=educated) | |||||
| Non-educated | 9.42 | 2.29 | -0.92 | 12.43 | 0.72 |
| Visiting time *sex (Ref.=Male) | |||||
| Female | -0.36 | 1.34 | -2.01 | -0.02 | 0.01* |
| Age* sex (Ref.=Male) | |||||
| Female | -1.34 | 1.24 | -4.43 | -0.54 | 0.01* |
| Visiting time *Residence area (Ref.=Urban) | |||||
| Rural | -1..26 | 1.34 | -4.24 | -0.45 | 0.02* |
In this research, certain covariates were significantly and jointly affected the two responses namely, hypertension and type2 diabetes. As age of a patient increased, the two responses were also increased but the rate of increase for female and male patients were different. Hence, as age increased by one year, the average increasing rate of hypertension and type2 diabetes for female patients were smaller as compared to male patients. This finding is agreed with the previously conducted researches [12,18].
Weight of patients affected the two responses jointly and positively and this result also agreed with previous research [19]. The potential reason for this may be the fact that patients who eat meat frequently are weighted as compared to vegetarian patients and such patients are exposed to hypertension and associated to disease like type2 diabetes. Patients who did not make physical exercises are also have more weight compared to those patients who did exercises. Hence, patients who did not make physical exercise are also exposed to hypertension and its correlated disease diabetes 2.
Male patients have more hypertension and diabetes2 reading as compared to females. The reason for this variation may be females are always busy in house work for child care and running here and there for cooking food which leads for more physical exercise and reduces the reading of both hypertension and diabetes 2. Females have good experience in taking pills for family planning and this might further leads for good adherence of medication for the variables of interests. This result is consistent with one of the previous research and contradicted by another study. Hence, this result needs further investigation in future.
The severity of both diseases is greater in urban patients as compared rural patients because of the nature of daily works for rural patients. Peasants are laborers for their daily life work as compared to urban patients and this leads for reducing the value of reading for two correlated diseases. This result is consistent with one of the previous research.
Alcohol consumed hypertensive and diabetic 2 patients are exposed for severity of the two diseases. Such patients may not be adherent after alcohol for medication described by health staff because of the interaction between alcohol and the drug toxicity problem. Hence, such patients may skip in taking pills after drinking alcohol and leads for inflation of reading the values of two diseases.
Similarly, the severity of the hypertension and diabetes of type2 for smokers become more complicated with other additional diseases such as cardiovascular disease and leads to be died as compared to non-smokers. Smoking has side effects for lungs of such patients and existence of such additional disease facilitate the severity of hypertension and its correlated disease type2 diabetes.
Patients living with their partners have less severity of the two co-infected diseases; partners may give proper care and encourage the patients to be adherent for the prescribed medication and also used as reminder when the pills to be taken and to visits the health institutions.
As visiting time of patients increased by one unit, the amount of the variables of interests decreased. The possible reason for this may be results of successive treatment reduce the amount of hypertension and type 2 diabetes. However, the rate of reduction for female patients is greater than that of male patients. The possible reason for this is the vaccination of child care at regular time and pills taken for family planning experience of females lead females to be adherent for medication of the two disease [20].
As visiting time of patients increased by one unit, the rate of reduction for urban patients was greater than rural patients. This result is similar to previous research [9]. One of the possible reasons for this might be the fact that urban patients might follow seriously their treatment given attention for their check up after initiation of adherence in better way as compared to rural patients [21]. Most of the time peasants go to health facilities whenever he/she become free from regular activities rather than the prescribed date by the health staff. Patients in rural areas move long distance to get health facilities for follow ups of their disease status.
This investigation indicates that the variable of interests on the average decreased as visiting time of patients increased. However, the rate of decrease for different groups such as residence area, sex, and marital status was different. Consequently, due attention should be given to address the specific needs of each group of patients. Patients with very high hypertension and type 2 diabetes in this long-term treatment program were at risk and should receive interventional treatment. Rural patients under treatment, nonvegetarian patients, patients who did not work physical excesses, addicted patients for alcohol and cigarette are risk groups identified for intervention.
The suggestions given for the interaction effect of certain characteristics of patients which is advantageous for future researchers to work in the area can be considered as strength of current investigations. The result obtained in current investigation helps for policy makes and health staffs for amendment of policy issues and proper intervention in reducing the severity of hypertensive and type 2 diabetic patients.
Ethical approval and consent for participate
Ethical approval certificate had been obtained from Bahir Dar University Ethical approval committee, Bahir Dar University, Ethiopia with reference number: RCS/1412/2012. In data collection, there was no written or verbal consent from participants because of use of secondary data.
Competing interests: There is no financial and non-financial competing interest between authors or between authors and institutions.
Funding: Not applicable
Consent for publication: This manuscript has not been published elsewhere and is not under consideration by any other journal. Authors agreed this manuscript to be submitted in this journal for publication.
Acknowledgement: Authors acknowledged the Felege Hiwot Teaching and Specialized Hospital, Ethiopia, for the data they supplied for the success of this investigation.
Journal of Hypertension: Open Access received 614 citations as per Google Scholar report