Research Article - (2023) Volume 12, Issue 5
Received: 21-Aug-2021, Manuscript No. IDSE-23-1435;
Editor assigned: 24-Aug-2021, Pre QC No. P-1435;
Reviewed: 22-Aug-2021, QC No. Q-1435;
Revised: 07-Sep-2023, Manuscript No. R-1435;
Published:
05-Oct-2023
, DOI: 10.37421/2168-9768.2023.12.390
Citation: Gidey, Gebre. "Performance Evaluation of Field
Level Water Use Efficiency at Serenta Irrigation Scheme, Tigray Region,
Ethiopia: From Farmers’ Practice." Irrigat Drainage Sys Eng 12 (2023): 390.
Copyright: © 2023 Gidey G. This is an open-access article distributed under the terms of the creative commons attribution license which permits unrestricted
use, distribution and reproduction in any medium, provided the original author and source are credited.
Many irrigation projects have been constructed in different corners of Ethiopia, with the aim of accelerating the overall economic growth through irrigation as a possible remedy to erratic rainfall and its subsequent hunger. But, they have below the targeted execution. Irrigation performance evaluation has got the highest priority in irrigation research to resolve the problems of irrigation management. The objective of this study was to evaluate performance of field level water use efficiency at Serenta irrigation scheme, Tigray region, Ethiopia. To evaluate it, stratified random sampling was done by stratifying the farmers as head, middle and tail-end users of the water source. Then, four farmers’ fields covered with single crop onion from each location water user of the irrigation scheme were selected. For every plot, water applied depth and soil moisture contentment before irrigation and after irrigation was made at all growth stages of the crop. The irrigation depths of water applied to fields were measured using Parshall flumes and the soil moisture contents before and after irrigation were determined using gravimetric method. The results from the field measurement revealed that, the amount of water applied depth during the onion growing season was more than the crop’s requirement. The average application efficiency of the selected fields from all growth stages of the crop was, 50.2%, 58.5% and 63.5%, with average deep percolation losses 49.8%, 41.5%, 36.5% for head, middle and tail-end water users, respectively. The average storage efficiency was, 87.5%, 80.5 % and 83.94%, and distribution uniformity efficiency was, 99.2%, 99.1% and 98.63% for head, middle and tail-end, respectively. The average water use productivity was 1.28 kg/m3, 1.78 kg/m3 and 2.04 kg/m3 for head, middle and tail-end users, respectively. It can be concluded that the irrigation efficiency can be improve by minimizing water losses and applying water according to crop water requirement.
Application efficiency • Storage efficiency • Distribution efficiency • Water use productivity
Ethiopia is naturally endowed with water, which could easily meet its domestic demand for irrigation. Accordingly, enhancing public and private investment in irrigation development has been distinguished as one of the core strategy to enable rural development and poverty reduction in the country. Many irrigation projects have been constructed in different corners of Ethiopia in general, and in Tigray regional state in particular, with the aim of accelerating the overall economic growth through irrigation as a possible remedy to erratic rainfall and its subsequent hunger. But, they have below the targeted execution, it is estimated to average 36% below design capacity and failed to significantly enhance the livelihoods of rural communities.
A large part of low performance is due to inadequate water management at field level. More than 40% of the water diverted for irrigation is wasted at field level through both/either deep percolation and/or surface runoff. This led to a range of problems and has reduced the benefits of irrigation investments. There have been conflicting opinions about the wisdom of investing further in new irrigation projects in the country, primarily due to the questions about the performance of existing projects. In recent years improving irrigation system performance is more preferable than developing new irrigation schemes due to the fact that investment in irrigation has failed to produce the expected result in many countries.
In line with this, the water resources in Ethiopia are huge and untapped, but the low economy of the country did not create much a need to develop new irrigation systems. Thus, improving the existing irrigation schemes followed by building additional new building additional new irrigation schemes is more preferable for sustainable development of the country. To address such issue, irrigation performance evaluation has got the highest priority in irrigation research among other researches needed to resolve the problems of irrigation development and management [1]. Irrigation performance evaluations are conducted to measure the gap between potential and real execution of irrigation systems. The result of evaluation provides the information required for advising irrigators on how to improve their systems and management practices with the view to minimize the water losses and increase productivity in irrigation systems. It plays a crucial role as an engine for further expansion of of agricultural production.
To achieve such issues, water use efficiency performance evaluation at field level is important to determine the right amount at the right time, to specific irrigated land and it provides direct solutions at field. The objective of this study was focused on evaluating the performance of field level water use efficiency; in terms of application efficiency, storage efficiency, distribution uniformity of the furrows and water use productivity in terms of water applied depth at Serenta irrigation scheme, North Western Tigray regional state, Northern Ethiopia.
Serenta irrigation scheme is one of the biggest newly constructed dams in North Western Zone of Tigray Regional State. The investment in this scheme is expected to bring significant impact on livelihoods of many of the farmers’ as well as the regional economy. To attain this, farmers are supposed to apply efficiently and practice sustainably the irrigation water. But, relating to water management at field level water losses and misuse are commonly observed. However, so far, there was no previously done research on the performance evaluation of the irrigation scheme.
Then, in order to put appropriate measures for water management of the scheme and to enhance farmers’ water use efficiency, evaluating field level water use efficiency performance of the irrigation scheme is needed. It is believed that this study will help the farmers at the irrigation scheme, for researchers, local and regional decision makers in developing appropriate strategies for enhance water use efficiency at field level of irrigation schemes.
Study site description
The study was conducted at Serenta irrigation scheme, Tselemti district, North Western zone of Tigray regional State, Northern Ethiopia. It lies between latitude of 13° 36'29"-13°34'18" N and 38°09'45"-38° 10'44" E longitude [2]. The elevation of the area ranges from1315 m (downstream end of the command) to 1388 m (highest point in the catchment) above sea level (Figure 1).

Figure 1. Location of the study area.
The climate in the study area is mainly hot semi-arid, with mean maximum 33.3°C and minimum 18.4°C temperature, and the annual average rainfall is 811.81 mm. Summer is the longest rainy season which starts early of May and ends in October. Rainy pattern is a monsoon model with a distinct peak in the period of June- September.
Serenta irrigation scheme is earthen embankment dam, which has 32.82 m height, 814.15 m length, and 8,435, 983.81 m3 reservoir volume capacities. The irrigation method commonly practiced by farmers is furrow type of surface irrigation method. The furrows are made traditionally by using oxen pulled ploughs [3]. Almost all of the farmers irrigate vegetable crops (onion and tomato), and maize and pepper as major irrigated crops. Of all, onion is the dominant irrigated crop in this irrigation scheme. The lengths of the commonly used furrows in the selected onion fields are generally short, while the longest was 6 m long.
Sampling procedure and techniques
To evaluate the irrigation water use efficiencies performance at field level; stratified random sampling was done by stratifying the farmers based on their location in the command area as head, middle and tail-end users of the water source. Then, four farmers’ fields covered with single crop onion (Red Bombay) from each position (head, middle and tail-end) water users of the irrigation scheme with equal size (0.25 ha) and similar in soil, furrows lay out and other management practices (such as weeding and insect protections, and fertilizer application)were selected using systematic sampling method (Figure 2).

Figure 2. Map of the sampled plots.
Then, for every plots water applied depth to field and soil moisture contentment before irrigation and after irrigation was made at each irrigation interval of all growth stages (initial, development, mid-season and late) of the crop (onion) [4]. The reason for selection criterion of farmers’ field on the positions (locations) were due to the assumption, the head users usually overirrigate their crop while the tail- end users are in short of supply of irrigation water when needed.
Data collection methods
Data were collected during the irrigation season, starting from November, 2017 to February, 2018. Both primary and secondary data were used. The primary data were soil samples collection, water application measurement and yield collection at fields while the secondary data was the climatic data of the study area from the nearest meteorological station (Maytsebri station).
Measurement of Water Applied Depth (WAD) to fields: Understanding water application depth, which is the amount of water applied to field in irrigation event, is important indicator for evaluation of water management in the irrigation scheme. To determine the amount of water applied by the irrigators to the fields at every growth stage (initial, developmental, mid and late stages) of the crop (onion), Parshall flumes (3 inch) were installed at the entrance of test plots every irrigation interval when the farmers are irrigating the test plots.
When the irrigator completed irrigating the test plot, the average depth of irrigation water passing through the flume, and the irrigation duration time (total flow time) were recorded for each test plot being irrigated. The discharges of the water applied were taken from the respective recommended discharge table [5]. Then, the depths of water applied to the fields were estimated by dividing the average total volume of water applied to the fields by the areas irrigated (0.25 ha).
Soil Sample collection and analysis: To determine the soil physical properties (soil texture, field capacity, permanent wilting point, bulk density , and soil moisture content) soil samples at two different depths 0-30 and 3060 cm were taken from the selected farmers’ field at each position(head, middle and tailend).
Soil textural class: to determine soil texture of each farmer’s field, a total six soil samples or two composite from each position (i.e. two composite samples at two different depths from each of head, middle and tail-end locations) were taken. The textural analysis was done using the hydrometric method.
Based on the percentage of composition, the soil textural class was determined by USDA soil textural triangle method.
Field Capacity (FC), Permanent Wilting Point (PWP) and Total available water (TAW): For the determination of soil moisture content at FC and PWP of the soils in the irrigation scheme; twelve undisturbed soil samples at two different depths (0-30 and 30 cm-60 cm) from all positions (head, middle and tail-end users) were taken and analyzed using pressure plate apparatus at 1/3 and 15 bars, respectively.
TAW which is an estimate of the amount of water, which a crop can use from the soil for the selected fields, was computed from the moisture content in volume percent at field capacity and permanent wilting point [6].
TAW (mm)=10 × (θFC-θPWP) × Zr (1)
Soil moisture: To determine the soil moisture content, soil samples were taken to the laboratory in every irrigation interval from each plot at every growth stage of the onion crop (initial, developmental, mid and late stages) before irrigation and 2 days after irrigation by considering field capacity of the soil at two depths (0-30 and 30 cm-60 cm) per test pit using core samplers to preserve moisture loss during travel.
It is presumed that this depth is the effective root zone of the irrigated vegetable crops. The maximum effective root zone of vegetables, like onion, is 0.6 m. The moisture content of the collected soil samples were determines using gravimetric method. The gravimetric moisture content of volume base was calculated using equation 2 as:
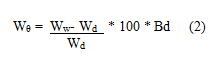
Where, Wθ is gravimetric soil moisture content (% volume bases), Ww is wet weight of the soil (g), Wd is dry weight of the soil (g), and Bd- soil bulk density (g/cm3).
Yield collection : To compare the water use productivity in terms of water applied depth of the farmers’ fields at the three positions (head, middle and tail-end) water users, the total yields (Bulbs) obtained from each of the selected fields (twelve plots) was collected with willingness and collaboration of the farmers.
Data analysis techniques
Determination of crop and gross irrigation water requirement: To estimate the crop water requirement and gross irrigation water requirement of the selected irrigated crop (onion) at field level the CROPWAT 8.0. Software was used. For the estimation model requires reference Crop Evapotranspiration (ETc) value using the available climatic data. The ten years mean climatic data of the study station (Maytsebri) was used, and calculated using the FAO Penman- Montieth equation [7]. Then, the result was compared with the farmers irrigation supply (application depth).
Potential and actual soil moisture storage depth determination: The Potential Moisture Storage (PMS) depth is the potential allowable depletion depth in the selected fields’ just before irrigation and it is the maximum amount of water which can be stored in the root zone at the moment of irrigation without deep percolation loss.
At the present study, the water needed in the root zone prior to irrigation was estimated by the soil moisture content at field capacity and soil moisture content before irrigation of the selected fields at two depth (0-30 and 30 cm-60 cm ), which was calculated using equation 3 as:

Where,
PMS=The depth of water in the root zone prior to irrigation (mm)
θFC and θBI are soil moisture content at field capacity and moisture content of the soil before irrigation in volume percent respectively, n is number of layers in the root zone and Di is the depth of soil profile in root zone (mm).
The Actual Moisture Storage (AMS) is moisture retention in root zone after actual irrigation application. The depth of water stored in the root zone of selected field was determined from the soil moisture content before and two days after irrigation by gravimetric method using equation 4:

Where,
AMS is depth of water retained into root zone (mm),
θAI and θBI are moisture content of the ith soil layers after and before irrigation on volume percent respectively, n is number of layers in the root zone, and Di is the depth of soil profile in root zone (mm).
Evaluation of field level water use efficiency performance
Application efficiency (Ea): Application efficiency measures the fraction of the total volume of water delivered to the field to that which is stored in the root zone to meet the crop water requirement [8]. After determining the depth of water actually applied to the fields using Parshall flumes and the depth of the water retained in the root zone of the soil based on the soil moisture contents of the soils before and after irrigation, the application efficiencies (Ea) of the irrigation at the selected fields were calculated using equation 5:

Where, AMS: Actual Moisture Storage WAD: Water Applied Depth
Soil moisture storage efficiency (Es): Soil moisture plays a critical role in crop growth. Storage efficiency is an index used to measure irrigation adequacy. It is the ratio of the quantity of water stored in the root zone during irrigation events to that intended to be stored in the root zone.
The storage efficiency was determined after determined the potential moisture storage depth and actual moisture stored depth at root zone of the selected crop by monitoring the soil moisture content before and after irrigation events [9]. Then, it was calculated using equation 6.
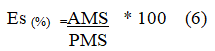
Where, AMS: Actual moisture storage PMS: Potential moisture storage
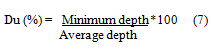
Distribution uniformity efficiency (Du): Distribution uniformity (Du) is a measure of how evenly water is applied during an irrigation application. Poor water distribution causes water stress in areas receiving relatively low amounts of water and oxygen stress in areas that are waterlogged.
To determine the distribution uniformity of irrigation water in the fields, soil samples were taken at regular interval distance of the furrows, starting from the head to the end of the selected furrows. At each selected point of the furrows, soil samples were collected at depth of 0 cm-60 cm and the moisture content of the soil was computed to determine the depth of water penetration. Then, the distribution uniformity efficiency was calculated using equation 7.
Water loss: The runoff ratio loss was considered as zero because the farmers are using closed furrows. Only the Deep Percolation Lose (DPL) was computed. Deep percolation is the fraction of applied water that runs through the soil to below the base zone, at which stage is then unavailable to the crop [10]. It can result from excess application of irrigation water and the nonuniformity of irrigation water over a field area. It was determined by the equation.
DPR (%)=100-Application efficiency (%) (8)
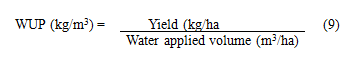
Water Use Productivity (WUP): Water use productivity defined as ratio between outputs derived from water use and the water volume applied (diverted) to the field, which is most important to individual farmer to evaluate whether the water has been used effectively or not.
After determining the water applied depth at all growth stages of the crop and collected the total yield of the crop from the selected fields, the water use productivity in terms of water applied depth was determined as:
Statistical analysis
The water applied depth variation and water use productivity in terms of water applied depth variation across the positions/locations (head, middle and tail-end users) were compared statistically using one way-ANOVA.
Materials used: For data collections, measurements and analysis at field level, various materials and software such as: Parshall flumes, soil auger, SPSS20.Software, ArcGIS10.4.Software, GPS, core samplers, CROPWAT 8.0. Software and sample bags were used.
Soil physical characteristics of the irrigation scheme
Texture (Particle size distribution): The soil textural class of the irrigation scheme was determined based on the particle size distribution. As a result, percent clay takes the highest proportion of the soil’s textural class followed by silt and sand [11]. Accordingly, the textural class was clay at all depths and positions or locations (Head, Middle and Tail-end) as presented in Table 1.
| Field location | Soil depth(cm) | Particle size distribution (%) | Textural class | ||
|---|---|---|---|---|---|
| Sand | Silt | Clay | (USDA) | ||
| Head | 0-30 | 24 | 24 | 54 | Clay |
| 30-60 | 14 | 30 | 56 | Clay | |
| Middle | 0-30 | 14 | 26 | 60 | Clay |
| 30-60 | 14 | 24 | 62 | Clay | |
| Tail-end | 0-30 | 12 | 22 | 66 | Clay |
| 30-60 | 12 | 22 | 66 | Clay | |
Note: USDA-United State Department of Agriculture
Table 1. Texture (Particle size distribution).
Field Capacity (FC), Permanent Wilting Point (PWP), Total Available Water (TAW) and average Bulk Density (BD)
The values of FC were in agreement with the result reported by, which ranges from 25%-40% by weight basis for clay soils. But, the values of PWP were somewhat above the range as compared to the report which ranges from 12%-20% by weight basis for clay soils (Table 2).
The value of Total Available Water (TAW) varied from 150.1 mm/m to 200.6 mm/m. It was almost in range with the reported by, which ranged from 160-300mm/m for clay soils. The average values of Bulk density (Bd) varied from 1. 02 g/cm3 to 1.1 g/ cm3 (Table 2), the value was within the range reported, which ranged from 1.0 g/cm3 to 1.5 g/cm3 for clay soils.
The analyzed results showed that the soil physical properties measured are not different to a great deal from each other with depth and across the positions (sampling locations), this indicate that the soils of the irrigation scheme is homogeneous (Table 2).
| Field location | Soil depth (cm) | FC (%wt.) | PWP (%wt.) | Bd (g/m3) | TAW (mm/m) |
|---|---|---|---|---|---|
| Head | 0-30 | 36.1 | 20.79 | 1.1 | 168.4 |
| 30-60 | 34.5 | 20.85 | 1.1 | 150.1 | |
| Middle | 0-30 | 38.17 | 20.73 | 1.1 | 200.6 |
| 30-60 | 38.93 | 21.02 | 10.2 | 182.6 | |
| Tail-end | 0-30 | 35.9 | 21.95 | 1.1 | 160.5 |
| 30-60 | 36 | 22 | 1.1 | 154 |
Note: FC-Field Capacity, PWP-Permanent Wilting Point, TAW-Total Available Water, Bd-soil bulk density
Table 2. FC, PWP, TAW and Bd.
Comparison between actual Water Applied Depth (WAD) and computed Gross Irrigation Requirement (GIR)
As calculated by the CropWat software program, the Gross Irrigation Water Requirement (GIR) of the onion crop per irrigation season in the study area was 620.2 mm (Figure 3) .This GIR value can be used for the whole farmers’ fields (head, middle and tail-end water users) to compare with actual water applied depth in growing season of the crop. The total amount of water applied in full growing season to each fields were 929.9 mm, 789 mm and 627 mm in head, middle and tail-end users, respectively in the irrigation season (Figure 3).
All the water user locations were found to irrigate above the optimum value obtained from the program. This showed that the irrigators had applied more water than the required which implied that, the amount of water applied in each irrigation events depends on the personal observation of individual farmers, not based on the required depth. This leads to low performance of irrigation system. Similarly, a research conducted in Gumselassa irrigation scheme (Northern Ethiopia) revealed that farmers applied water more than the required depth.
The water application depth in the growing season of the crop was varied among the locations (head, middle and tail-end water users), the head users applied (929.9 mm) more water than the middle and tail-end users, and the middle users applied (789 mm) more than tail-end users in the irrigation season [12]. This variation was due to the difference in amount of application per irrigation event and irrigation interval. The head users applied more water per irrigation event than the middle and tail-end users; because they are nearest to the water source they could divert the water to their fields, as they want as they like (they did not transfer to the next users at a time).
The result from the one way-ANOVA analysis also revealed that, statistically there was significant (p=0.02) variation at 5% significance level on water application depth across the positions (head, middle and tail-end users). Similarly, argue that, the farmers at the head of irrigation system apply more water than the middle and tail-end users.

Figure 3. Comparison between AWD and GIR.
Evaluation of field level water use efficiencies performance
Water application Efficiency performance (Ea): The average application efficiency of the selected fields from all growth stages of the crop (onion) was, 50.2%, 58.5% and 63.5% for head, middle and tail-end users, respectively with the overall mean (scheme level) value of 56.95% (Figure 4). These percentages of water application efficiency imply that, this much of the applied irrigation water is stored in the intended root zone of crop.
The average application efficiency results of the head, middle and tail-end, and overall mean (scheme level) in Serenta irrigation scheme agreed with the result recommended by which reported as 50%-90% application efficiency for furrow irrigation system. The values middle, tail-end users, and overall mean (scheme level) were within an acceptable range for surface furrow irrigation system, which is recommended as 54.7%-92%.
However, only the value of the tail-end water users agreed with the result reported 60%-75% attainable application efficiency for furrow irrigation. The average application efficiency of the tail-end users of the irrigation scheme was better than the head and middle users of the irrigation scheme. In other words, those who had less access to water (tail-end users) utilized water efficiently. While the head and middle users were less efficient by applying excess water to their fields.
Generally, no results in the present study were agreed with result reported, which is 90% application efficiency for a wellmanaged surface furrow irrigation system [13]. From the finding, it was clear that the farmers in the irrigation scheme applied more water to the field exceeding the requirement, which leads to the low application efficiency.

Figure 4. Average application efficiency.
Deep Percolation Loss (DPL): The average deep percolation losses were calculated from all growth stages of onion crop at farm level and overall mean (scheme level). The results were found to be 49.8%, 41.5%, 36.5% for head, middle and tail-end water users, respectively with overall mean (scheme level) value of 43.1% (Figure 5). These results reflect that, this much water applied to the fields percolates into the soil below the root zone.
When compared the three locations each other, higher deep percolation loss was observed at the head users; from those who applied more water to their fields with low application efficiency. However, at the tail-end users the deep percolation loss was low, where they apply low amount of water with high application efficiency [14]. This result indicated that losses are increasing as the accesses of getting water are increasing, and it is possible to conclude that high deep percolation loss value is indication of over irrigation. Similarly, an increase trend from head users to tail users deep percolation result found, 60.0%, 43.9% and 41.6% for upstream, middle stream and downstream test plots, respectively in Midhegdu irrigation scheme (Western Ethiopia).

Figure 5. Average deep percolation loss.
Soil moisture storage efficiency performance (Es): The evaluation of storage efficiency for selected fields was done based on the mean value of all growth stages of the crop irrigation events observed. The results show that the average storage efficiency was, 87.5%, 80.5% and 83.94% for head, middle and tail-end users respectively, with the overall mean (scheme level) value of 84% (Figure 6).
The obtained results in this study were below the results which ranges from 97.4% to 100% while reported 100% storage efficiency for the surface furrow irrigation system. This indicates that they were not irrigating their fields at the optimum irrigation interval targeting at bringing back the soil moisture capacity to field capacity of the soil and they were forced to extend time to get water, which leads to low storage efficiency. Only, the average storage efficiency value for head users was within acceptable range for furrow irrigation system regarding the recommendation as 87.5% and as 85%-100%.

Figure 6. Average storage efficiency.
Distribution uniformity efficiency (Du) performance
The average distribution uniformity efficiency at enter fields (Du) was, 99.2%, 99.1% and 98.63% in the head, middle and tail-end users, respectively, with scheme level efficiency 98.97% (Figure 7). Although the result indicated that not fully uniform (100%), it is within the acceptable value, which is (≥ 60%) indicated that the application is relatively uniform over the entire field [15]. And recommended that, distribution uniformity should be >80%.
Therefore, according to these references, the results of distribution efficiency obtained in Serenta irrigation scheme indicated that the water application was uniformly applied in the entire field. This could be due to the reason that the furrows lengths are commonly short (2-6 meter length) with closed ends.

Figure 7. Average distribution uniformity efficiency.
Water use productivity in terms of water applied depth
The water use productivity was found to be 1.28 kg/m3, 1.78 kg/m3 and 2.04 kg/m3 for the head, middle and tail-end users, respectively (Table 3). While comparing the three locations (head, middle and tail-end) the results indicated that, regardless of the water shortage when needed (timely) in the tail–end users, they had the highest return per unit of water applied (2.04 kg/ m3). This might be due to the application of irrigation water nearest to gross irrigation water requirement. This was 627 mm in full growing season of the crop (onion) which was almost as the gross irrigation water requirement (620.2 mm) as calculated by CROPWAT software program.
The result also indicated that, the head users who applied more water than the middle and tail-end users had the least water use productivity (1.28 kg per cubic meter of water applied). In other words, the result indicated that WUP has inverse relation with the amount of water applied, but it had direct proportionality with application efficiency. The tail-end user farmers who use the water somewhat efficiently than the head and middle users, with 63.5% application efficiency had high WUP. In line with this, found high WUP (2.03 Kg/m3) in tail users than the head and middle users in Midhegdu irrigation scheme.
| Location | Farm area (ha) | Water applied (m3) | Water applied (m3/ha) | Bulbs (Kg) | Bulbs (Kg/ha) | WUP (Kg/m3) |
|---|---|---|---|---|---|---|
| Head | 0.25 | 1599.39 | 6397.56 | 2042.5 | 8170 | 1.28 |
| Middle | 0.25 | 1357.26 | 5429.04 | 2417.7 | 9670.8 | 1.78 |
| Tail | 0.25 | 1078.74 | 4314.96 | 2202 | 8808 | 2.04 |
Table 3. WUP in terms of water applied.
For improvement of irrigation scheme and the irrigation practices, frequent performance evaluation is very important. This study was commenced to evaluate the field level water use efficiency in Serenta irrigation scheme and to identify the gaps. These results have shown the level of field level water use efficiency that requires improvements.
The amount of water applied depth during the onion crop growing season was more than the crop’s requirement, which indicated that much amount of water was being wasted due to poor irrigation water management practice with low application efficiency. From the results of water use productivity analysis, the highest value was obtained at the tail-enders followed by the middle and head users, since the water application of the tail-end users was near to gross irrigation requirement. From this, it can be concluded that the irrigation efficiency in general and, the water use productivity in particular can be improve by minimizing water losses and applying water according to crop water requirement. To achieve this, farmers should be given training on irrigation water use and management.
Irrigation & Drainage Systems Engineering received 835 citations as per Google Scholar report


