Research Article - (2021) Volume 11, Issue 1
Received: 23-Nov-2020
Published:
19-Jan-2021
, DOI: 10.37421/2165-784X.2021.11.372
Citation: Charan, Rajshree, Shrimali MK and Bhart SD. “Optimal Placement of Multi Actuators in Active Control of Building Frames.” Civil Environ Eng 11 (2021): 372.
Copyright: © 2021 Charan R, et al. This is an open-access article distributed under the terms of the Creative Commons Attribution License, which permits unrestricted use, distribution, and reproduction in any medium, provided the original author and source are credited.
The optimal placement of the actuator for obtaining the best possible reduction in responses was a topic of interest for researchers. Many optimization techniques were used for obtaining the optimal reduction in responses. Placement of more than three actuators in building frame in practice is difficult and cumbersome. As a result, number of actuators to be placed in the frame is generally restricted as three. For optimization problem, involving three actuators, many computational problems are involved, namely, numerical stability, convergence of the solution, possibility of dynamic instability and in some cases, amplification of some response quantities. The above problems are generally encountered in many standard optimization techniques which are used for optimization. Further, some constraints may have to be imposed in the algorithm for floors where actuators cannot be placed for practical reasons. Under such circumstances, optimal placement of actuator is best achieved using the trial or iterative method.
Active control • Earthquake • ANN • Base shear • Top storey displacement • Control force
The optimal placements of actuators in a ten storey building frame for a maximum number of three actuators are presented using the method of trail. Three cases of actuator placement are considered, namely, one actuator, two actuators and three actuators. The response quantities of interest are the top floor displacement, the maximum inter storey drift and the maximum base shear. The optimal reduction in responses for these quantities is obtained for four real earthquakes, namely, Kobe, Spitak, Elcentro and Bhuj. LQR algorithm is used to obtain the controlled responses.
The classical control theory is based on the frequency domain analysis employing transfer function approaches. A major limitation of the theory was the use of single-input single-output methods. Modern control theory is based on time domain analysis expressed by first order differential Equations utilizing state space representation [1].
Linear quadratic regulator (LQR)
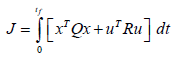
In classical linear optimal control, the control force is assumed to be a linear function of the state vector and the control of the responses is obtained by minimizing a quadratic performance function. Therefore, it is popularly known as a linear quadratic regulator (LQR) control. Assuming the state vector to be zero at time t = 0, the performance index is defined as
 (1.1)
(1.1)
In which, tf is the duration of the earthquake excitation; Q is a 2n X 2n semi-definite matrix and R is a n X m positive definite matrices. The matrices Q and R are termed weighting matrices. The relative values of the elements of the matrices are selected according to the importance attached to the different parameters of control. For example, large values of the elements of Q compared with those of R denote that reduction of response is given more weightage at the cost of control force. The opposite is indicated when the elements of R are relatively large. Similarly, in the Q matrix, relatively large values of the diagonal elements corresponding to the displacement response denote that the velocity response is penalized in the minimization procedure [2].
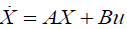
The LQR estimates the control force by minimizing the quadratic cost function. For a continuous-time linear system defined on t ∈ [t0, t1], the Equation of motion written in state space form is-
 (1.2)
(1.2)
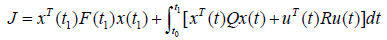
With a quadratic cost function defined as
 (1.3)
(1.3)
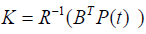
The feedback control law that minimizes the value of the cost is
 (1.4)
(1.4)
Where, K is given by
 (1.5)
(1.5)
And P is found by solving the continuous time Riccati differential Equation
 (1.6)
(1.6)
From Equation (1.4), it is clear that the time histories of controlled response and the control force are such that they provide a minimum value for the performance index J. Furthermore, the Equation (1.5) shows that the performance index J is in a way equivalent to the total energy of the system, including that of the external force over the entire duration of the excitation. Thus, the control algorithm in some sense obtains the control force by minimizing the total energy of the system over the duration of the excitation. This algorithm is known as a linear quadratic regulator (LQR) algorithm as the control force is a linear function of the state vector and the performance function is a quadratic function of the state variable and the control force. Figure 1 shows the Simulink block diagram for LQR.

Figure 1. LQR feedback model in Simulink.
To investigate the effectiveness of the control system for different excitations, four time histories of ground motion are selected for numerical simulations, namely, Bhuj, Elcentro, Spitak and Kobe (Table 1).
| S. No. | Year | Earthquake | Recording Station | PGA (m/s2) |
|---|---|---|---|---|
| 1 | 1940 | El-Cento (California) | Imperial valley | 3.1276 |
| 2 | 1988 | Spitak (Armenia) | Gukasian | 1.9521 |
| 3 | 1995 | Kobe (Japan) | Nishi â?? Akashi | 4.9320 |
| 4 | 2001 | Bhuj | Ahmedabad | 1.0382 |
The control and uncontrolled responses of the frame are obtained for each earthquake. The peak control force required for obtaining the optimal response is recorded and shown along with the percentage reduction of responses. The method of trail consists of placing the actuator at different floors and plotting the percentage reduction in each case [3].
The optimum control with one actuator
The percentage reduction in the maximum base shear (B.S.), the peak top floor displacement (TFD) and the maximum interstory drift (DRIFT) for different placements of the actuator are observed. The results are presented in the form of three types of plots, namely,
i. The variation of the percentage of reduction in the response quantities of interest with the position of the actuator;
ii. The variation of R factor with the position of the actuator and
iii. The variation of normalized maximum control force with the position of the actuator.
‘R’ is defined as the ratio of the percentage reduction in the response quantity of interest per unit peak control force, expressed as a percentage of the total building weight. The variations are shown for four different earthquakes, i.e., Bhuj, Elcentro, Kobe and Spitak.
It is seen from the figures that the variation of the percentage reductions in the peak top storey displacement and the maximum interstory drift increase as the actuator is placed on higher floors. The maximum percentage reductions for the two responses are 57% and 50% for Bhuj earthquake; 48% and 41% for Kobe earthquake; 73% and 66% for Elcentro earthquake and 63% and 55% for Spitak earthquake [4].
The response reduction with two actuators
In the case of optimal control with two actuators, different combinations of placement of actuators are attempted. The combinations are shown in Table 2.
| S. No. | Location (Floor Wise) |
|---|---|
| 1 | 1-2 |
| 2 | 1-3 |
| 3 | 1-7 |
| 4 | 2-8 |
| 5 | 2-9 |
| 6 | 1-10 |
| 7 | 3-5 |
| 8 | 3-8 |
| 9 | 4-9 |
| 10 | 6-10 |
The response reduction with three actuators
In the case of optimal control with three actuators, different combinations for placement of actuators are attempted. The combinations are shown in Table 3 below.
| S. No. | Earthquake | Actuator Positions (Floor Number) | ||
|---|---|---|---|---|
| Base shear | Top floor displacement | Drift | ||
| 1 | Kobe (PGA=0.4 g) | 1 -2 (46%) | 6-10 (69%) | 6-10 (62%) |
| 2 | Elcentro (PGA=0.32 g) | 1-2 (66%) | 6-10 (83%) | 6-10 (79%) |
| 3 | Spitak (PGA=0.2 g) | 1-2 (58%) | 6-10 (75%) | 6-10 (72%) |
| 4 | Bhuj (PGA=0.106 g) | 1-2 (62%) | 6-10 (69%) | 6-10 (65%) |
Eight combinations are attempted for investing the optimum percentage reduction in response expressed as a factor R i.e., percentage reduction per unit control force. The variation in the value of R with the different combinations of three actuator position shows a similar trend as that of a single actuator and two actuators for the combinations considered in the study of the different earthquakes. However, when the variation of the percentage reduction in response quantities with different combinations of actuator placement is plotted separately, without any consideration to the peak control force, the variations are different than the variation of R factor with the actuator combination as can be seen from the following figures [5].
The peak control forces required for three cases of actuator placement, one actuator, two actuators and three actuators are shown in Table 4 below.
| S. No. | Earthquake | Actuator Position/(Floor Number) | ||
|---|---|---|---|---|
| Base shear | Top floor displacement | Drift | ||
| 1 | Kobe (PGA=0.4 g) | 1 (0.79) | 10 (1.39) | 10 (1.21) |
| 2 | Elcentro (PGA=0.32 g) | 1 (2.21) | 10 (3.65) | 10 (3.3) |
| 3 | Spitak (PGA=0.2 g) | 1 (3.33) | 10 (5.47.) | 10 (4.82) |
| 4 | Bhuj (PGA=0.106 g) | 10 (13.1) | 10 (18.13) | 10 (16.5) |
It is seen from the Table 5 that peak control force requirement does not significantly differ with the number of actuators used. However, there is a significant change in percentage reduction of responses. Further, it may be noted that peak control force increases with the increase in peak ground acceleration of an earthquake, as expected [6-9] (Tables 6-8).
| S. No. | Location (Floor Wise) |
|---|---|
| 1 | 1--2--10 |
| 2 | 1--3--10 |
| 3 | 1--4--10 |
| 4 | 1--5--10 |
| 5 | 1--6--10 |
| 6 | 1--7--10 |
| 7 | 1--8--10 |
| 8 | 1--9--10 |
| S. No. | Earthquake | Actuator Position (Floor Number) | ||
|---|---|---|---|---|
| Base shear | Top floor displacement | Drift | ||
| 1 | Kobe (PGA = 0.4 g) | 1 -2-10 (54%) | 1-9-10 (70%) | 1-9-10 (67%) |
| 2 | Elcentro (PGA= 0.32 g) | 1-2-10 (72%) | 1-9-10 (89%) | 1-9-10 (85%) |
| 3 | Spitak (PGA = 0.2 g) | 1-2-10 (65%) | 1-9-10 (81%) | 1-9-10 (79%) |
| 4 | Bhuj (PGA = 0.106 g) | 1-2-10 (70%) | 1-9-10 (77%) | 1-9-10 (74%) |
| S. No. | Earthquake | Actuator placement (floor number) | ||
|---|---|---|---|---|
| Base shear | Top floor displacement | Drift | ||
| 1 | Kobe (PGA=0.4 g) | 1 (1.14) | 10 (1.51) | 10 (1.45) |
| 2 | Elcentro (PGA=0.32 g) | 1 (2.91) | 10 (3.65) | 10 (3.61) |
| 3 | Spitak (PGA=0.2 g) | 1 (4.51) | 10 (6.1.) | 10 (5.92) |
| 4 | Bhuj (PGA=0.106 g) | 10 (14.74) | 10 (17.44) | 10 (16.74) |
| S. No. | Earthquake | One actuator | Two actuators | Three actuators |
|---|---|---|---|---|
| Kobe (PGA = 0.4 g) | 0.39 | 0.439 | 0.47 | |
| 1 | Elcentro (PGA = 0.32 g) | 0.239 | 0.242 | 0.247 |
| 2 | Spitak (PGA = 0.2 g) | 0.138 | 0.14 | 0.144 |
| 3 | Bhuj (PGA = 0.106 g) | 0.052 | 0.057 | 0.06 |
Optimal placement of actuators in 10 storey building frame is investigated using a trial approach for 4 real earthquakes having different peak ground acceleration values. 3 cases are studied, namely,
i. Placement of only one actuator
ii. A combination of two actuators placed at two different floors and
iii. A combination of three actuators placed on three different floors.
The optimal placements are selected based on the percentage reduction of three response quantities, namely, peak top floor displacement, maximum inter-storey drift and maximum base shear. Control responses are obtained using LQR algorithm. Optimal positions are investigated by considering
i. Percentage reduction in response alone
ii. Percentage reduction / unit peak control force, R factor and
iii. By specifying an upper limit for the peak control force that can be accommodated in actuator.
The numerical study leads to the following conclusions:
1. For the single actuator, peak top floor displacement and max inter storey drift increase as the actuator is placed at higher floor. The max reductions are achieved when the actuator is placed on the 10th floor.
2. For the base shear, the pattern of variation is opposite to those of max top floor displacement and max inters storey drift.
3. The variation of peak control force has the same trend as that of percentage reduction in base shear.
4. The variation of the R factor (percentage reduction/unit control force.) is of the same nature as that of percentage reduction in responses for peak top floor displacement and max base shear. However, this variation of base shear is different from the percentage reduction of responses, in the case of Bhuj earthquake.
5. Therefore, it shows that optimal positions of the actuator may be different for different criteria used. Here, they are decided based on a percentage reduction of response alone and percentage reduction per unit control force.
6. In the case of two actuators and three actuators placed in the frame, the trend of results remains the same as that of single actuator.
7. Higher percentage reduction in responses can be achieved by increasing the number of actuators to control, as expected. However, considerable reduction in response can be achieved with single actuator also.
8. The max control force required to control the responses increases with increase in PGA level of the earthquake. The max control force does not change significantly with the number of actuators used. However, percentage reduction in responses changes significantly with the number of actuators used.
Journal of Civil and Environmental Engineering received 1798 citations as per Google Scholar report


