Research Article - (2025) Volume 15, Issue 3
Received: 25-Sep-2024, Manuscript No. JCDE-24-148828;
Editor assigned: 30-Sep-2024, Pre QC No. JCDE-24-148828 (PQ);
Reviewed: 15-Oct-2024, QC No. JCDE-24-148828;
Revised: 12-Jun-2025, Manuscript No. JCDE-24-148828 (R);
Published:
19-Jun-2025
, DOI: 10.37421/2165-784X.2025.15.602
Citation: Tekolla, Ashenafi. "Measuring Connectivity Level of Area around Addis Ababa LRT Station and its Impact for Transit Oriented Development (TOD) Success." J Civil Environ Eng 15 (2025): 602.
Copyright: © 2025 Tekolla A. This is an open-access article distributed under the terms of the creative commons attribution license which permits unrestricted use, distribution and reproduction in any medium, provided the original author and source are credited.
Well-connected design of the areas around transit station is one of the pillar principles of sustainable urban development concept such as Transit Oriented Development (TOD). TOD integrates land use and public transport to create vibrant communities that depend on walking, cycling and use public transit for commute than depending on private vehicle. Assessing the presence of existing TOD characteristics involves measuring the connectivity level of area around transit stations. The objective of this research is to quantify the connectivity level area around 800-meter radius of the Addis Ababa LRT station by integrating Analytic Hierarchy Process (AHP) with GIS. The method clusters the area into three different categories based on their connectivity level and represent them with different colors. The analysis result of four stations located in the central old part of Addis Ababa revealed that approximately 59% of the study area falls under the category of moderately connected, followed by 32.2% with higher connectivity and the remaining 8.76% of the area indicates low level of connectivity. The result can be used as a guideline to identify areas that require intervention to improve connectivity by urban planner and policymaker to promote sustainable urban model like TOD.
Analytic Hierarchy Process (AHP) • Connectivity level • Geographical information system • Transit Oriented Development (TOD)
High density, diversified land use and well-connected street design has become a topic of interest among res advocates of sustainable urban development concept Cervero, et al. such as TOD [1]. The connectivity of area is one of main feature that influence the success of TOD projects since it increases accessibility, walkablity, cycling, and use of public transport Lee et al., in urban environment [2]. Victory Transport Policy Institute defined connectivity as density of street networks; directness of paths that creates many short links and minimal dead ends [3]. Connectivity relates to the density of road network, number of intersection along the segment and how an area is connected to public services, commercial areas, transit stations and entertainment places. Connectivity in urban form improves livability of communities by enabling easy access to service locations, shortening travel distance and time, reduce traffic congestion [4].
The significance of connectivity related to TOD has been mentioned in numerous studies such as [5]. Measuring connectivity levels of area has been profound in shaping urban planning and transportation policy and enables city planners to identify key areas for improvement, optimize transit routes, and enhance the overall efficiency of transportation networks. This will lead to a more sustainable and resilient urban environment, with reduced carbon emissions, improved air quality, and increased accessibility. By improving connectivity around transit stations, cities can bridge the gap between various neighborhoods and promote inclusivity and diversity. Therefore, to have the understanding whether an area is well connected or not, the connectivity level of area has to be measured analyzing the level of influencing variables such as accessibility, density of intersection, density of street network and block density.
Therefore, the objective of this research is to measure the relative connectivity level of the area around AA-LRT stations by integrating Analytic Hierarchal Process (AHP) and Geographical Information System (GIS) using weighted overlay analysis tool in GIS software. AHP enables to analyze multi variable such as (street density, intersection density and block size) in hierarchal manner while GIS allows visualizing and analyzing spatial data that helps to come up with comprehensive result and illustrative map.
The methodology involves the identification of performance indicators that influence connectivity, prioritize the identified variables according to their significance for connectivity and combine the results from the AHP with GIS to perform a weighted overlay analysis. The result cluster areas with similar connectivity levels into the same categories and represent them with different colors. This approach makes the analysis process easier to identify areas that require intervention to improve connectivity level.
Therefore, the research is guided by the following research questions:
• What are the performance indicators (main variables) that influence the connectivity of urban form in the context of Addis Ababa?
• What is the significance of these indicators (variables) in influencing connectivity levels?
• What is the connectivity level of areas around 800 meters’ radius of the Addis Ababa LRT stations?
To address these research questions, the following specific objectives are pursued:
• Identify performance indicators (variables) for connectivity of area.
• Prioritize these indicators based on their significance for connectivity in the context of Addis Ababa.
• Measure the connectivity of area around four selected station by combing the results of the AHP in GIS using weighted overlay analysis.
Connectivity is a crucial factor to support TOD by determining how urban blocks are connected, thus facilitating accessibility, walkability and overall sustainability of urban form [6]. It also plays a vital role in the success of TOD projects, as it is closely linked to other vital TOD criteria such as walking, cycling, compactness, and accessibility. For successful TOD the road layout should be short, direct, attractive, well-connected, and easy to navigate within the built up environment in order to make mobility convenient for residents and visitors.
The benefits of connectivity for TOD success
Connectivity of area plays significant role for successful implementation of TOD directly or indirectly. It has direct influence to increases easy access to various destinations, such as transit stations, commercial areas, public services, and recreational areas. Indirectly it is also an effective strategy for promoting pedestrian friendly and cycling environment providing shortcuts to overcome network barriers. A well-connected street network helps balance traffic distribution, improves accessibility, and enhances mobility [7]. Some studies have shown that street network connectivity is one of the key independent variables influencing pedestrian volume [8].
The indicators of connectivity
In measuring the connectivity of area identification of performance indicator (influencing variables) is crucial step. Various researches investigated connectivity using different indicators based on objectives and availability of important data for the analysis. In studies such as Ewing and Cervero, et al. street network density, intersection density, average block length, block size and percentage of four way intersections are mentioned as an indicator of connectivity. In the research by Fathy Alagamy, et al., analyzing connectivity of Atria in Cairo, mentioned blocks size and permeability to adjacent neighborhoods physically as well as visually as indicators for connectivity. Many studies also pointed that smaller blocks and finer-grained urban street network may promote higher walking rates [9]. The four variables mentioned by Mohamad and Said, are accessibility, least angle, crossing density and street density. In assessing the structural connectivity of urban green space in Hong Kong focused on structural connectivity of urban green space using resistance weight, structural connectivity index, and ecological barrier. However, there is no standardized suitable block size that provides better connectivity. TOD standard in ITDP pointed that block size of about one hectare and block face about 100 m is optimum block size. Smaller block size increases the connectivity allow easy movement in many directions, and ease access to ultimate destination. Leadership in Environmental and Energy Design certification program for Neighborhood Development (LEED-ND) took intersection density as the main criteria to measure connectivity level of area. However, Stangl and Guinn critiqued LEED-ND pilot program for its assessment of street connectivity considering the importance of both topological and weighted properties.
Method of measuring connectivity
The other main focus in measuring connectivity of area is the methods used by previous studies to quantify connectivity of urban built up environments. Different method proposed by researchers to measure connectivity level of built up area [10]. Ahmed younes Saleh, et al. used map algebra tool in GIS software to result Total Connectivity Index [11]. Used space –Syntax to demonstrate the topological configuration of physical network. Lin, Wu and Li used generic algorithm to search for optimal weights of combination that represent connectivity level of area [12]. Used GIS to measure street connectivity of four districts of Golsar, Iran and to rank the district according to their connectivity level. By reviewing variable of urban streets connectivity stated that space syntax and GIS are suitable tools to analyze the four variables relating to measuring the connectivity level of a city. In the research entitled “Urban Network Analysis” Sevtsuk and Mekonnen introduced Urban Network Analysis (UNA) in GIS to measure urban street and building network. In measuring equity in transit provision of Greater Copenhagen Area Kaplan et al., used GIS representation of the network and transit assignment to effectively calculate location based potential accessibility measures and Gini coefficients of inequality. In proposing framework to measure connectivity Mishra et al., used graph theoretic approach [13].
Integration of AHP and GIS to measure connectivity
AHP is a multi-variables decision making technique structuring variable in hierarchal manner to prioritize the variable according to their significance. GIS is also a powerful tool to visualize and analyze spatial data. The integration of AHP and GIS to measure the connectivity level of area around transit station enables to analyze multiple influencing variables according to their importance to alter connectivity and visualize the result on spatial map. In perspectives of improving connectivity level of multi-modal transportation system Mishra, Welch and Jha, used AHP to emphasize the need for a systemic approach to develop measures that can prioritize funding allocation for public transit connectivity. In identifying optimal transit alignments between Salt Lake and airport in Honolulu Brunner, Kim and Yamashita used AHP and GIS. In a research, connectivity used to measure equity of transit provision highlighted the importance of considering multiple variables by integrating AHP and GIS [14].
Methods
The connectivity of an area around a transit station plays a crucial role for success of TOD directly or indirectly by facilitating walkability, cycling, accessibility, economic vibrancy and the overall sustainability. Therefore, in measuring the connectivity level of area the above facts should be taken into consideration. The methodology used in this research integrates AHP and GIS to measure connectivity by considering various performance indicators such as street network density, intersection density and block size. Spatial data suitable to evaluate indicators extracted from the geospatial database of the study area as a vector file converted to raster layer and reclassified to common range of (1, 2, and 3).
On the other hand, the identified performance indicators are weighted and ranked according to their importance in determining the connectivity level using AHP. The result from AHP integrated to (GIS) using weighted overlay tool. This process multiply the cell values in each raster layer with percentage importance obtained from AHP analysis and provide new raster layer with amalgamated raster map. Finally, spatial data can be analyzed and visualized to generate a comprehensive assessment of the connectivity around the transit station.
The result of the analysis clusters the areas with similar level of connectivity and represents them with different color in the spatial map. This enables for a systematic and objective evaluation of the connectivity level, providing valuable insights for urban planners and policymakers in making informed decisions regarding transportation infrastructure development and improvement on connectivity.
Schematic flow diagram of methodology is shown in Figure 1.
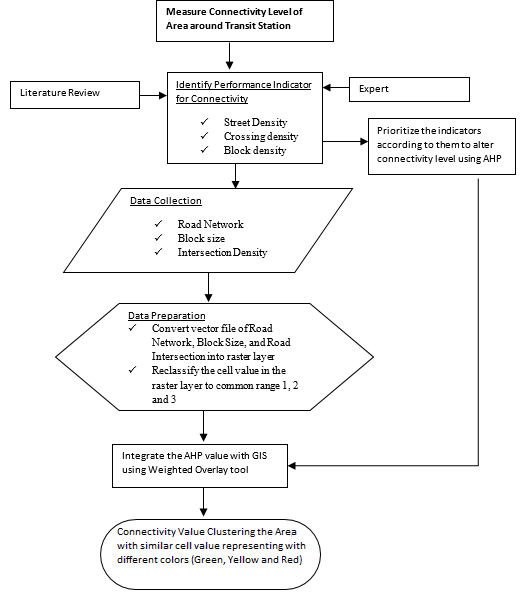
Figure 1. Schematic representation of research methodology.
Study area
Addis Ababa is economic, political, commercial capital of Ethiopia, hosting estimated population of 2.7 million according to 2007 census with growth rate 3.8%. The current political boundary of Addis Ababa is estimated to be 572 kilometer square. The city is one of rapidly growing city in Africa and challenged by urban sprawling, traffic congestion, environmental pollution and the likes. Addis Ababa LRT implemented to deal with crumbling transportation in the city, connecting four corner of the city with the Central Business District (CBD). It started transport service since 2015 and played significant role in easing the transportation problem in the city. However, at its infant age of operation the LRT has face with a challenge that questions its sustainability. One of the main challenges is being the shortage of finance to run operation and maintenance. Currently about half of LRT trains are grounded due to lack of ordinary spare parts.
To deal with the financial shortage the Ethiopian Railway Corporation (ERC) together with city administration planned to implement Transit Oriented Development (TOD) along the LRT routes. Steering committee organized including all relevant stakeholders to overseer planning and implementation of TOD. Feasibility study has been conducted to identify suitable LRT stations and selected 10 stations of 39 LRT station. Out of the 10 stations narrow down to 4 stations for first phase potential TOD implementation. These four stations are Legare station, St Lideta station, Autobus Tera station and Menelik 2nd square station. These stations are primarily located at the old central part of the where the settlement is characterized as unplanned and haphazard lacking the very basic sanitation facilities. These areas are in need of renovation and redevelopment. In the resent research these four stations are chosen as a study area to illustrate the method used (Figure 2).
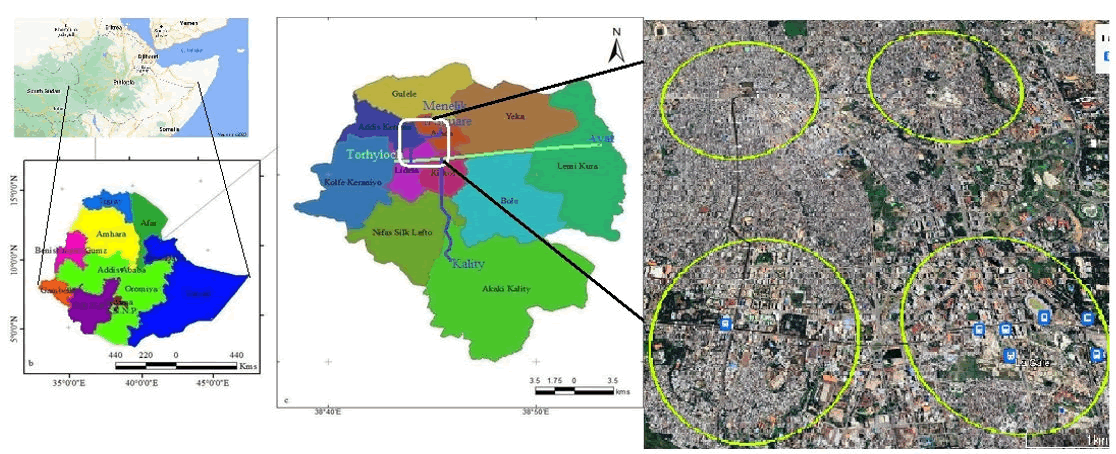
Figure 2. The study area located at the older part of Addis Ababa.
Data collection
In this research primary and secondary data used to analyze the connectivity level of the study area. The primary data has been collected using questioners. 30 experts from relevant field interviewed to give their perspectives about the significance of indicators to alter the connectivity level in the context of Addis Ababa. This data has been summarized and used to weight he significance of the identified performance indicator using AHP. The secondary data are extracted from the geospatial data of the study area. It includes the vector layer of road network, road intersection, and block size. During preparation of data the vector layer are converted into raster layer and reclassified into common range of 1, 2 and 3 as shown in the Figure 3.
In the below Table 1 higher number of intersection density and higher number of block indicates higher connectivity level in the area.
| Stations | Intersection density | Number of blocks | Max block size in (hectare) | Average size (hectare) |
| Legare | 230 | 91 | 21.5 | 1.8 |
| St. Lideta | 511 | 154 | 14.7 | 1.14 |
| Autobus Tera | 714 | 253 | 4.1 | 0.66 |
| Menelik 2nd square | 364 | 131 | 4.91 | 1.18 |
Table 1. Intersection density, number of block, maximum block size and average block size of the study area as an indicator for connectivity.
Identification definition and computation of indicators
In measuring the connectivity level of area around transit station identifying key performance indicator of connectivity is essential. The identified three key performance indicators to measure the connectivity level of area around Addis Ababa LRT, within walking distance from transit station are intersection density, block density and street density.
Street density: Street density refers to measure of length of road network in unit area. The higher street density indicates more links and more connectivity [15]. Street density in this study computed using road network (shape file) in GIS. The shape file of line converted to raster layer using line density tool in GIS software, and the reclassified into normalized value of 3, 2 and 1 representing higher, moderate and low street density respectively as shown in Figure 3A.
Intersection density: Intersection density refers to the density of connection nodes per unit area [16]. The higher intersection density results higher connectivity level of an area. To compute Intersection Density (ID) in GIS software the shape file of road intersection (crossing) converted to raster layer using Point Density tool. Then reclassify the raster cell value to three categories 1, 2, and 3 as shown in Figure 3B. 1 representing low intersection density, 2 refers medium level intersection density and 3 representing higher level intersection density.
Block density: Block density refers the total number of blocks in district divided by district area. The smaller block size signifies higher block density and higher connectivity level [17]. And bigger block size signifies less block density and connectivity level of an area. To compute the block density in GIS shape file of block size (polygon) converted to raster using convert tool in GIS software, and reclassify into normalized value of 3, 2 and 1 representing higher block density, moderate block density and low block density respectively as shown Figure 3C.
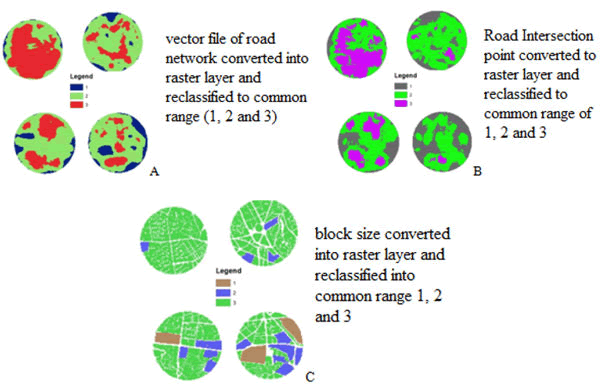
Figure 3. Spatial data converted from vector to raster layer and reclassified into common range.
Weighting performance indicators
Weighting indicators according to their importance to alter the connectivity level has been undertaken using Analytic Hierarchal Process (AHP). AHP is a multi-criteria decision making method that uses hierarchical structures to prioritize performance indicators (criteria) according to their significance based on expert judgment. In this particular research the main indicators identified are street network density, intersection density (road crossing density), block density and. The significance of those indicators for the purpose of altering the connectivity level and consequently increase the TOD level of an area. Prioritization of the above mentioned indicators is based on Addis Ababa context.
The critical steps in Analytic Hierarchy Process (AHP) are building hierarchy from the main goat to criteria, establishing pair-wise comparison matrix summarizing the judgments of expert, computing the priority vector and finally check the consistency of judgments (Figure 4).
Step 1: Building hierarchy from the Indicators (criteria) to intended goal.
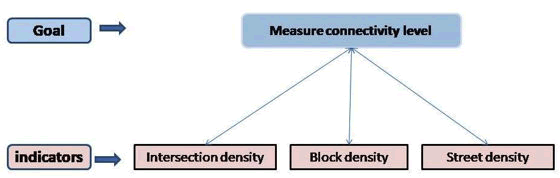
Figure 4. Hierarchal schematics of the main goal and indicators to prioritize indicators according to their significance for connectivity level of an area.
Step 2: Established the comparative pair-wise matrix by summarized judgment of experts according to Saaty Book Analytical Hierarchal Process (AHP) as shown in the Table 2. The judgment contributed through favoring the importance and intensity of one indicator over another, using numerical scale from 1 to 9.
| ID | BD | SD | |
| ID | 1 | 2 | 1 |
| BD | 0.5 | 1 | 2 |
| SD | 1 | 0.5 | 1 |
| Note: ID: Intersection density; BD: Block density; SD: Street Density | |||
Table 2. Pair-wise matrix of performance indicator for effective land use mix, based on the context of Addis Ababa city.
The upper triangle of diagonal matrix is filled with the value of comparison criteria set by Saaty pointed in Liberatore whereas the lower triangle of the pair-wise matrix represents the reciprocal values the upper diagonal.
Step 3: Computing the priority vector is determined by normalizing the Eigen-value to 1 according to Saaty. Using the formula
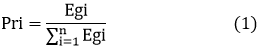
Where Egi=Eiegen-value for the row i

The maximum Eigen-value or Lambda is calculated using the following formula;

Where aij is the summation of the criteria in each column in the 3 × 3 matrix and Wj is the criteria weight value, which is equal to priority vector in the matrix according to Saaty.
Step 4: To check the consistency of judgments.
To calculate the consistency index CI of judgment matrix (Equation 1), and get the consistency ratio CR using the following (Equation 2).

Where CI is the consistency index, λmax is Eigen value or Lambda and n is the number of indicator. CI provides a measure of severity pair-wise matrix.
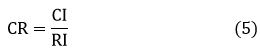
Where CR is consistency ratio and RI is the random index (Table 3).
| n | 1 | 2 | 3 | 4 | 5 | 6 | 7 | 8 | 9 |
| RI | 0 | 0 | 0.58 | 0.89 | 1.12 | 1.24 | 1.32 | 1.41 | 1.46 |
Table 3. Saaty's random ratio for different value of n.
Eigen value (Lambda max) is calculated to be 3.05, consistency index equals to 0.026 and consistency ratio equals to 0.046 which is 1%. Since the consistency ratio is less than 4.6% threshold, the pair wise comparison is consistent (Table 4).
| Indicators and description | Symbol | Priority rank |
| Intersection density | ID | 41.30% |
| Block density | BD | 32.70% |
| Street density | SD | 26.00% |
Table 4. Priority of performance indicators for land use mix.
Method to measure connectivity level by integrating AHP Result with GIS using weighted overlay analysis
Weighted overlay analysis is a technique that integrates AHP with GIS to create a consolidated spatial map. It allows the calculation of a multi-criteria analysis of several raster layers. The cell value in each raster layers have assigned percentage of significance resulted from AHP calculation. The cell values of the raster layers are multiplied by the percentage of significance. Then the results are added together to create a new output raster map. The integration of AHP and GIS enables the determination of the importance of different performance indicators and provides a platform to analyze spatial data.
Weighted overlay tracks the following steps for the analysis:
• Vector layer have to be converted to raster layer and reclassified to suitable common scale.
• Each raster layer is assigned a weight according to AHP analysis.
• New raster layer is generated multiplying each raster layer cell value with their corresponding weight resulted from AHP using Equation 6 totaling to derive a connectivity level (Figure 5).
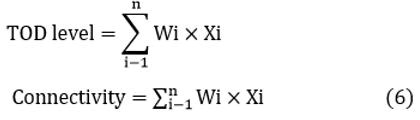
Where: Wi is weight assigned for each performance indicator, Xi is the cell value in raster file of spatial data. The spatial data used includes street network density, intersection density and block density. All spatial data extracted from Geospatial database of the study area, converted to raster data and reclassified to normalized common scale 1, 2 and 3.
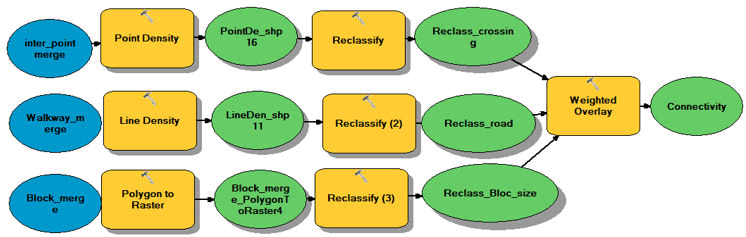
Figure 5. GIS model of weighted overlay analysis to measure connectivity of area around transit station.
The objective of the present research is to assess the level of connectivity of area around Addis Ababa LRT station in the course of checking the existing TOD characteristics. The study is useful to have the understanding, what needs to improve in order to make the area more oriented to transit station in advance of implementing TOD in the area. The methodology in this research comprises three main steps. First step is identification of performance indicators (variables) of connectivity in the context of Addis Ababa using literature review and expert consultation in the relevant field [18,19]. The identified indicators to define connectivity level of the area are intersection density, block density and street network density. Second prioritization the identified performance indicators (variables) according to their significance to alter the level of connectivity using AHP. According to AHP analysis intersection density gained higher priority with 41.3%followed by block density with 32.7% and street density ranked third with 26.0% priority. And finally measure connectivity level of area around transit station by integrating the result from AHP with GIS using weighted overlay analysis tool in GIS software. Weighted overlay analysis multiply the reclassified cell value in the raster layers with their respective priority value obtained from AHP analysis and sum up to find amalgamated value representing the connectivity level of the area. The method clusters areas with similar level of connectivity in the same categories representing them with different colors on the spatial map (high connectivity (green), moderate connectivity (yellow) and low connectivity (red)) level [20]. According to the analysis, majority of the study area, accounting 59% are under the category of moderate connectivity level followed by higher connectivity covering about 32.2% of the study area. Low level of connectivity recognized in 8.76% of the study area.
When evaluating the study area according to the level of connectivity, higher level of connectivity noticed mainly concentrating around Autobus Tera station as it can be noticed in the Figure 6. The area around Autobus Tera station have well connected grid network than areas around other stations. Vibrant business activity in the neighborhood due to the presence of the largest market in the city (Merkato) might have played significant role for higher level of connectivity. Higher level of connectivity is also recognized at area around St Lideta station, at the immediate north of the St Lideta station.
This area is dominated by mixed residential and commercial building. The recent redevelopment effects taken by city administration might have played critical role for higher connectivity level.
Large portion of low level connectivity is recognized at the area around Legare LRT station and St. Lideta stations. These areas are mainly dominated by government institutions, industrial areas and urban slums. The areas are also characterized as bigger block size, mainly fenced around which restricts movement from the outside. For example, the area occupied by Addis Ababa University, Lideta Campus and the court surrounded by fences that restricts penetration of movement within and reduced connectivity level of the area as shown in the Figure 6.
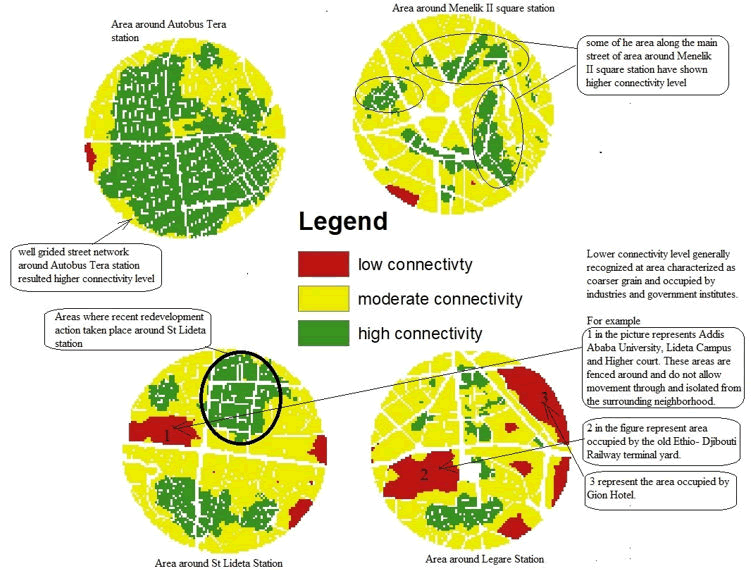
Figure 6. The analysis result showing high, moderate and low level of connectivity in the study area.
At the eastern end of Legare station, the area occupied by Gion Hotel and other institutions nearby also showed low level of connectivity. Large portion of land is occupied by the Hotel and isolated from the neighborhood by the river flowing to the South. At the western end on the Legare station, the area occupied by old Ethio- Djibouti railway terminal station revealed lsow connectivity level. The current activities by real-estate developer at this particular area are expected to improve the connectivity level significantly in the future.
This research was carried out to measure the connectivity level of area around Addis Ababa LRT stations and its impact on TOD level by combing AHP and GIS. AHP is a multi–criteria decision-making method that helps prioritize influencing variables according to their significance on connectivity and at the same time as GIS is a powerful tool to visualize and analyze spatial data and display on graphical illustrative map. The result clusters areas with similar level of connectivity in the same categories and represent them with different colors (high connectivity (green), moderate connectivity (yellow) and low connectivity (red)) level. The analysis result of the area around four stations along Addis Ababa LRT station revealed that about 59% of the study area clustered under the category of moderate connectivity level followed by higher connectivity covering about 32.2% of the study area. Low connectivity level recognized at 8.76% of the study area. This reveals that improvement actions are required to improve connectivity of the area to make the area more oriented to public transit. This result enables urban planner and decision maker to easily identify locations that require improvement action to increase connectivity. The method is a valuable tool to assess the efficiency of transportation networks, improve accessibility for commuters, and promote sustainable urban form such as TOD. Moreover, as technology continues to advance and new data analysis methods emerge, the field of measuring connectivity levels is poised to play a crucial role in shaping the future of urban mobility and creating more vibrant and resilient cities for all residents.
[Crossref] [Google Scholar] [PubMed]
[Crossref] [Google Scholar] [PubMed]
[Crossref] [Google Scholar] [PubMed]
[Crossref] [Google Scholar] [PubMed]
Journal of Civil and Environmental Engineering received 1798 citations as per Google Scholar report