Research Article - (2024) Volume 11, Issue 3
Received: 11-Sep-2019, Manuscript No. JLOP-19-2394;
Editor assigned: 16-Sep-2019, Pre QC No. JLOP-19-2394;
Reviewed: 30-Sep-2019, QC No. JLOP-19-2394;
Revised: 02-Dec-2022, Manuscript No. JLOP-19-2394;
Published:
30-Dec-2022
, DOI: 10.37421/2469-410X.2022.9.46
, QI Number: JLOP-19-2394
Citation: Yaseen, Hira, S Bashir, H Z Batool and
S Shaheenb, et al. "Laser Induced Breakdown Spectroscopy for
the Detection and Quantitative Analysis of Toxic and Non-Toxic Elements in
Toys." J Lasers Opt Photonics 9 (2022): 46.
Copyright: © 2022 Yaseen H. This is an open-access article distributed under the terms of the creative commons attribution license which permits unrestricted use,
distribution and reproduction in any medium, provided the original author and source are credited.
Toys of different brands were analyzed by Laser Induced Breakdown Spectroscopy (LIBS) technique employed for the analysis of toxic and nontoxic elements. All samples were irradiated without sample preparation treated under the ambient environment of argon gas. The analysis of emitted spectra reveals the presence of different elements in the samples which was verified by the National Institute of Standard and Technology (NIST) database. Both toxic and non-toxic elements like lead, tin, mercury, potassium and magnesium are found indifferent concentrations. The concentration of heavy metals like lead, mercury and tin in different toys were in the range of 897.2 ppm-320.5 ppm, 88.2 ppm-140.4 ppm and 8.4 ppm-10.2 ppm respectively which is much higher than the permissible value set by US Environmental Protection Agency (US EPA), US Food and Drug Administration (US FDA) and other regulatory authorities. The concentration of non-toxic elements like magnesium and potassium are within safe permissible limits.
Paints • Non-toxic elements • Spectroscopy • Environment
It is well known that toys are integral part of children developmental process. Besides providing entertainment to children, these toys can damage their health by exposing harmful elements. The chewing and licking behavior is a major source of exposure to the elements present in the toy. The toys are mostly made up of vinyl chloride (A monomer) and are frequently used in marketplace. The coloring agents in toys are the major source of lead and cadmium. Laser Induced Breakdown Spectroscopy (LIBS) is a technique which is useful for the multi elemental qualitative and quantitative analysis, determines the composition of material. In various field LIBS provides real time, multi elemental measurement capability. LIBS measurements are straightforward and are useful for detection of toxic materials. Today LIBS is commercially available for laboratory and industrial applications [1].
Toys of different brands contain various amounts of lead, chromium and mercury. The digestive system of a child absorbs up to 50% of lead and according to physicians even 0.99% of lead is not safe or normal in the blood. In this work, LIBS is using for detection of trace elements in different toys used by children below 3 years of age. The toys containing lead, tin and mercury can cause chain of reactions in children’s health. The spectrum obtained from LIBS instrumentation reveals the presence of lead, mercury, tin and other toxic elements in toys of different brands. The high concentration was found in the samples which were collected from the market in Pakistan.
A substantial work is reported in which LIBS is employed as an analytical technique for detection and analysis of toxic and non-toxic elements in toys. Chinese made toys to determine the levels of heavy metals (Pb, Cd, Ni, Cu, Zn, Cr, Co and Mn) in the products. Concentrations of heavy metals in the toys ranged from 2.50-1445.00, 0.50-373.33, 31.17-119.67, 12.00-93.67, 266.67-2043.33, 5.00-191.67, 1.00-73.33 and 6.17-36.67 μgg-1, for Pb, Cd, Ni, Cu, Zn, Cr, Co and M respectively. The application of LIBS for the detection of lead and other toxic elements in toys. The quality control of toys for avoiding children exposure to potentially toxic elements which is a common requirement in national and/or international norms for health and safety reason.
Taking into account the risks associated with the presence of hazardous elements in toys, the main motivation of this work is to investigate and quantify the trace elements like lead, magnesium, tin, potassium and mercury. A radiation source Nd: YAG laser at its fundamental wavelength of 1064 nm was employed to generate a plasma plume. By collecting the atomic emission spectra, the elemental composition and concentration of different toys was determined. The concentration of toxic and non-toxic elements were verified with the permissible value set by regulatory authorities within the uncertainty [2].
Sample preparation
The 4 local and branded toy samples (Kidco nipple, shield nipple, tether and plastic block) were chosen from the market in Pakistan. The samples were in the form of solid so they did not need any treatment before experiment. Therefore, the samples were fit into the sample holder directly.
Instrumentation
A Q-switched Nd: YAG laser (Quantel brilliant) with wavelength 1064 nm, energy 200 mJ, pulse duration 10 ns, repetition rate 1 Hz-10 Hz was applied to irradiate the sample. The sample was clamped in x-y translation stage installed in the UHV stainless steel chamber which was evacuated by a rotary pump to a base pressure of 10 torr-3 torr. The laser was operated at 10 Hz and focused on the target at the angle of 90° to the target surface with the help of quartzfocusing lens of 50 cm focal length. The 200 mJ laser energy was utilized in this experiment, calibrated by energy meter (Ophir model). The solid target was mounted on the rotating sample holder to prevent a deep dug in the sample and for fresh and smooth surface. To avoid breakdown of ambient gas in front of the target, the lens to sample distance was about 1 cm before the focus. In order to enhance the emission intensity, the chamber was filled with Argon gas at a fixed pressure of 20 torr for all the samples. A 2.5 μm gated delay was applied for all samples which is the delay between the laser shot and the opening of camera shutter for data acquisition. A very short gate width will not allow enough signals to be processed across the detector also a very long gate width will allow too much ambient light to enter the detector (Figure 1).

Figure 1. The schematic diagram of experimental setup.
The line emission spectra were collected by LIBS 2500 plus (Ocean optics) detection system in conjunction with an optical fiber placed at right angles to the direction of plasma plume. The uncertainties in the measurements are ≈ 0.03 nm. The LIBS 2500 plus has seven spectrometer modules to detect the spectrum in the range of 200 nm-980 nm wavelengths with resolution of 0.1 nm. The detector has a CCD camera with 14,336 pixels. Finally, OOLIBS software identified by the spectra and hence the concentration of elements was measured [3-5].
Spectral analysis
The spectrum of trace elements of four various kinds of selected toys. By NIST atomic database, the presence of trace elements and their concentration was investigated. During the lifetime of the plasma plume, the emitted radiations retrieved the quantitative and qualitative information about the elemental composition of the material. At the high temperatures during the early plasma state, the ablated material dissociates into excited ionic and atomic species and the plasma emits the continuum radiation. By hitting the target with a single shot laser bright luminous plasma is generated. As the plasma expands at supersonic velocities and cools down, it emits the characteristic atomic emission lines of the elements present in the material. The emission spectra of this plasma are evaluated by OOLIBS system. The identification of atomic lines is verified with NIST database. The selected fingerprint wavelengths for the identification of elements are between 720 nm-820 nm regions (Figure 2) [6,7].

Figure 2. LIBS spectra of plastic block in the region of 720 nm to 860 nm recorded for delay time of 2.5 μs.

Figure 3. LIBS spectra of kidco nipple in the region of 720 nm to 860 nm recorded for delay time of 2.5 μs.

Figure 4. LIBS spectra of shield nipple in the region of 720 nm to 860 nm recorded for delay time of 2.5 μs.

Figure 5. LIBS spectra of tether in the region of 720 nm to 860 nm recorded for delay time of 2.5 μs.
From output data, five strong neutral lines of Lead (Pb), Magnesium (Mg), Mercury (Hg), Tin (Sn) and Potassium (K) are identified at wavelengths of 763.2 nm, 738.7 nm, 794.4 nm, 811.4 nm and 842.0 nm respectively are chosen for quantitative analysis of elements [15]. The concentration is measured in parts per million and compared with permissible values given by authorities.
Calculation method for concentration of both toxic and non-toxic elements
The concentration of the elements was measured by applying the Beer lamberts law. Table 1 shows the extinction coefficient k and path length l of four solid samples. The concentrations of different elements are determined by using LIBS system. These results have been compared with EPA (Environmental Protection Agency) and other regulatory authorities for the safe permissible values.
| Plastic Block | Shield Nipple | Kidco Nipple | Tether | ||||
|---|---|---|---|---|---|---|---|
| K | l | K | l | K | l | K | l |
| Extinction coefficient | Path length | Extinction coefficient | Path length | Extinction coefficient | Path length | Extinction coefficient | Path length |
| L/mol.cm | cm | L/mol.cm | cm | L/mol.cm | cm | L/mol.cm | cm |
| 0.85 × 10⁴ | 2.0 × 10⁻³ | 0.82 × 10⁴ | 1.2 × 10⁻³ | 0.15 × 10⁴ | 0.24 × 10⁻³ | 1.9 × 10⁴ | 0.22 × 10⁻³ |
Beer lambert’s law
Beer lamberts law states that there is logarithm dependence between the transmission of light through a substance and the product of the absorption coefficient (α), the path length or penetration depth ℓ (distance the light travels through the material).
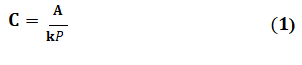
The formula for the calculation of concentration is:
By using the formula, the concentration of each element in liquids, gases and solids can be determined individually by this method. The spectra are first normalized to the most abundant element in the sample. For this purpose, take the summation of intensity equals to 1 a.u.
ΣI=1
The relationship between absorbance A and normalized intensity is:
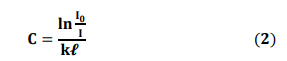
The factor I0/I are the normalized intensity of spectra ranges from 0 to 1.
Where C is concentration, A is absorbance, k is extinction coefficient, and l is path length. By substituting the value of path length and extinction coefficient and the absorbance in equation no 1, the concentration of the material can be deduced (Table 2).
| Elements | Plastic block | Kidco nipple | Shield nipple | Tether | Permissible value |
|---|---|---|---|---|---|
| LIBS (ppm) | LIBS (ppm) | LIBS (ppm) | LIBS (ppm) | (ppm) | |
| Pb | 897.2 | 320.5 | 446.2 | 527.2 | 200 |
| Hg | 140.2 | 40.5 | 30.4 | 43.2 | 20 |
| Sn | 5 | 1 | 2.4 | 10 | 0.002 |
| Mg | 1290.1 | 580.9 | 460.1 | 611 | 1100 |
| K | 100.4 | 200 | 105.4 | 150.4 | 500 |
The result of heavy metal concentration in toy samples is revealed by LIBS technique. The toxic and non-toxic elements are found in toys with different concentrations. The concentration of lead measured in four samples by LIBS system is in the range of 897.2 ppm-320.5 ppm. The recommended value of lead set by the EPA (Environment Protection Agency) and other authorities is 200 ppm. The highest value Pb=897.2 ppm is detected in plastic block which exposed to the maximum health risk. Any toy surface contains lead equal or in excess of 1.0 mg/cm2 or 0.5% of weight is hazardous. Magnesium is in high range of 1290.1 ppm-460.1 ppm. The safe limit of magnesium set by FDA (Food and Drug Administration) and EPA is about 1100 ppm. In all samples the certain level of magnesium is allowed. However, magnesium is an important mineral of our body [8,9].
The presence of mercury in all toys is also alarming which is indeed more hazardous even in small concentrations. The concentration of mercury ranges from 30.2 ppm-140.4 ppm. The highest value of Hg=140.4 ppm. The safe limit of mercury set by EPA and other regulatory authorities is 20 ppm. The concentration of tin in tether is about 10.2 ppm. The maximum tolerable tin concentration is about 0.002 ppm. Such high quantities of heavy metals in toys pose a threat to children’s health. The maximum content of potassium i.e., 150.4 ppm was found in 2 samples (Kidco nipple and shield nipple). The safe value of potassium in paints is 500 ppm in plastics. Potassium is a non-toxic element within the safe limits [10].
These results reveal that in toy samples both toxic and non-toxic elements such as lead, magnesium, tin, mercury and potassium are found at different concentrations. The highest concentration of lead, tin and mercury detected in four samples is found which exceeds the permissible value set by Environmental Protection Agency (EPA). The concentrations of some non-toxic elements like magnesium and potassium in paint samples are within safe limits with respect to the regulatory authorities’ regulations.
[Crossref] [Googlescholar] [Indexed]
[Crossref] [Googlescholar] [Indexed]
[Crossref] [Googlescholar] [Indexed]
[Googlescholar] [Indexed]
[Googlescholar] [Indexed]
[Crossref] [Googlescholar] [Indexed]
[Crossref] [Googlescholar] [Indexed]
[Crossref] [Googlescholar] [Indexed]
[Crossref] [Googlescholar] [Indexed]
Journal of Lasers, Optics & Photonics received 279 citations as per Google Scholar report