Review Article - (2021) Volume 0, Issue 0
Received: 30-Aug-2021
Published:
20-Sep-2021
, DOI: 10.37421/2223-5833.2021.s7.002
Citation: Amdouni, Afef. "Investor Sentiment Measurement Techniques: A Review of Literature."Arabian J Bus Manag Review 11 (2021): 002.
Copyright: © 2021 Amdouni A. This is an open-access article distributed under the terms of the creative commons attribution license which permits unrestricted use, distribution and reproduction in any medium, provided the original author and source are credited.
Within the conceptual framework of behavioral finance, our interest is based on investor sentiment that allows us to understand investors' decisions in uncertain situations and their consequences on stock price movements. In this context, the main objective of this article is to investor sentiment through its measurement methods which help to examine its relationship with the profitability and volatility of equities. To do this, we began by introducing the concept of “investor sentiment” and its measurement indicators which are very diverse because of the non-consensus on a single definition of investor sentiment. We have distinguished these indicators using three methods (direct, indirect and composite) to clarify the interests and limitations of each measurement method.
Behavioral finance • Investor sentiment • Measures of investor sentiment • Sentix
Since the stock market crash of 1987, the questioning of the hypothesis of the informational efficiency of financial markets has cast doubt on the hypothesis of the rationality of financial market participants. From this, and starting in the 1990s, behavioral finance introduced a new concept called “investor sentiment” that explains financial market movements by filling in the gaps in traditional finance theory. Indeed, investor sentiment was presented as an explanatory factor for errors in estimating and predicting market movements. For this, it is considered to be the difference between the subjectively expected value of a financial security and its fundamental value calculated according to classical theoretical models. In other words, investor sentiment has an important explanatory power over the divergence of stock prices from their theoretical values since it influences in particular the investment decisions of market operators and therefore affects the movements of the market.
Thus, investor sentiment has been proposed within the framework of behavioral finance as a very emotional and intuitive concept that brings together all behavioral biases by directly affecting investors' choices in their decision-making. In addition, it is considered to be a combination of different cognitive, emotional and collective biases that are recognized as the primary cause of stock market valuation and prediction errors by financial market participants.
This article will be organized as follows: First, we will devote the second section to defining investor sentiment. Thus, in the third section, we will present in detail the main methods of direct, indirect measurement and composite models of feelings, which will allow us to demonstrate their diversity, and the fact that these indicators generally lead investor psychology to an extreme either optimistic or pessimistic sentiment. Finally, the fourth section concludes the article and provides guidance for future research.
Concept of investor sentiment
Many stock market crashes have been detected for a long time: the great crisis of 1929, the crisis of the beginning and end of the 1960s, the bubble of the beginning of 1970, the crash of Black Monday of October 1987, and the Internet bubble of the 1990s. These crises are all characterized by sharp falls in stock prices that are unjustified and unexplained by the classical theory of finance. Indeed, the standard theory of finance, which suggests that stock prices are equal to their present values of expected cash flows, cannot explain the manifestation of all these stock market crises. However, the current of behavioural finance is based on the development of the standard model towards an alternative model based on two fundamental assumptions.
According to De Long, the first assumption assumes that investors are subject to sentiment. Indeed, investor sentiment is considered to be the belief about future cash flow and investment risk [1]. According to Shleifer and Vishny, the second hypothesis suggests that investments different from those made by sentimental investors are costly and risky [2]. As a result, rational and arbitrary investors are not as aggressive in converging stock prices to their core values as the standard model of finance implies. However, the modern theory of behavioural finance assumes that arbitration is limited. However, these two assumptions are strongly validated on the stock markets through the manifestation of the Internet bubble and which is followed by crashes of telecommunications and Nasdaq. This was explained by the fact that investor sentiment has led to speculative and hard-to-value technology stocks converging to inexplicable values. In this situation, arbitragists must normally build arbitrage portfolios to reinforce prices and return to their core values, but this is not the case as prices continue to rise sharply before reaching a stock crash.
Through the conviction that investor sentiment challenges perfect rationality, several researchers have tried to define this concept but each through its own vision. Examples include the definitions proposed by [3-6].
Linked investor sentiment to their beliefs that influence their estimates and assessments of an investment [6,7]. Indeed, assume that investor sentiment is a “set of behavioural phenomena” that can be used to explain investor beliefs when assessing financial assets [3]. More clearly, define investor sentiment as beliefs related to “future cash flows” and investment risk levels that do not have fundamental explanations [6]. Investor sentiment as the gap between the expected value and the fundamental value (reference value) [4]. An optimistic investor is a bullish investor who hopes to have returns above an average (benchmark) and vice versa. For the term investor sentiment is synonymous with errors made by the investor in its valuation of financial assets.
Measures of investor sentiment
While it is difficult to determine or measure investor sentiment, we find several indicators examined in the studies that may reflect sentiment but to different degrees. Indeed, we will present the different investor sentiment measures used in most studies. Next, we will expose a composite sentiment index created by that combines several sentiment measures, showing its reliability to explain the large speculative bubbles that have appeared over the past 40 years [8].
Work on methods for assessing this sentiment remains a field of creativity in the stock market sector. In this section, we will present only the most well-known and proven sentiment measures which can be direct, random, indirect measures, generally using market data or composite measures by combining some direct and indirect indicators.
Direct measures of sentiment
Direct indicators for estimating investor sentiment are mainly presented by Investors Survey (surveys) which are generally used to determine consumer motivations or to identify voter expectations. These surveys carried out directly among individuals, their methodologies differ particularly on the identity of the individuals interviewed who may be consumers or individual investors or/and institutional professionals.
University of Michigan (MCCI), American Association of Individual Investors (AAII) and Yale University confidence indexes
University of Michigan (MCCI) and conference board confidence indexes: The University of Michigan (MCCI) and Conference Board consumer confidence indexes are based on the analysis of the impact of consumer confidence in particular on the level of consumption and in general on the outcome of firms. The MCCI index is constructed on the basis of information collected monthly through a telephone survey and is focused on consumer expectations (US households) with regard to their own situation and also the short-and long-term economic situation.
The MCCI index is based on five questions although the overall survey consists of 26 questions and the answers to the questions are divided according to the sentiment of optimistic or pessimistic consumers. Next, we measure the gap between the percentage of optimistic consumers and the percentage of pessimistic investors by adding one hundred and the results must be aggregated to finally obtain the value of the MCCI sentiment index.
In the work there is a comparative table between the MCCI index which is the most used indicator because of its seniority and that of Conference Board which is also an index of consumer confidence [9,10]. Demonstrated through this table that the topics discussed and questions asked in both surveys (the University of Michigan survey and the Conference Board survey) are similar and very close [10]. However, the MCCI survey is based on a representative sample of five thousand US households. This sample appears to be large compared to the Conference Board survey.
American Association of Individual Investors (AAII) confidence index: The indices of the American Association of Retail Investors (AAII) are indicators of the psychology of retail investors (small savers). These indices can help retail investors improve the performance of their portfolios relative to that of indices or UCITS. The purpose of the AAII weekly surveys is to determine their members' expectations of the evolution of the Standard & Poor’s 500 (increase, decrease or no trend) for the next six months.
Yale university confidence indicators: Yale University confidence indexes are indicators that estimate the sentiment of retail and institutional investors. These indicators are published every six months and each publication provides an average of the monthly surveys over the last six months of a sample of approximately 100 stakeholders. Thus, these confidence indicators are based on confidence rather than optimism or pessimism. There are four of them: the buy-on-dips confidence index, the one-year confidence confidence index, the one-year confidence confidence index, the one-year confidence index in the market’s valuation of securities (valuation confidence index).
First, the downside buying index is an estimate of the percentage of investors anticipating a rebound after a 3% drop in Dow Jones in a day. Next, the probability index of no stock market crash is a measure of the percentage of investors anticipating no stock crash for the next six months. Thus, the annual confidence index is a measure of the percentage of investors anticipating an increase in Dow Jones for next year. Finally, the index of confidence in the valuation of securities by the market is estimated on the basis of the questioning of investors on the situation of the prices of US equities in relation to their equilibrium or fundamental value.
Shiller indices (2000): In collaboration with Tsutsui and Fumiko, Shiller proposed a new methodology to measure individual and institutional investor sentiment by analyzing their psychology [11]. Indeed, it formulated a questionnaire which was sent to institutional investors and to retail investors every six months. The purpose of this questionnaire is to identify the following three sentiment indicators: "Bubble expectation", "negative bubble expectation" and "Investor confidence".
First, the “Bubble expectation” index is an estimate of the probability given by investors in the direct start-up scenario of a powerful bull market. This index is based on five components:
- TOOHIGH and UP: indicates that the shares are overvalued and their prices will increase;
- UPDOWN: indicates that prices will increase in the short term and this increase will be reversed in the longer term;
- RISEFORWHILE: indicates that prices will progress sustainably;
- SEEOPTIMISM: indicates that investors are overly optimistic which implies that their decisions will be influenced by this risk of sentiment;
- UP and CRASH: indicates that prices will rise in the short term despite this the probability of a stock market crash is only 10%.
Second, the “negative bubble” expectation index is an estimate of the probability given by investors in the direct start-up scenario of a powerful bear market. This index is based on four components:
- TOOLOW and DOWN: indicates that the shares are undervalued but their prices will continue to fall;
- DOWNUP: indicates that prices will fall in the short term and rise in the long term;
- FALLFORWHILE: indicates that prices will decline sustainably;
- SEEPESSIMISM: indicates that investors are excessively pessimistic which implies that their decisions will be influenced by this risk of sentiment.
Finally, the “Investor confidence” index is an estimate of the level of investor confidence in the future relative to their investments. This index is based on four components:
- ONEDAYUP: A 3% drop the next day will be corrected the next day;
- SIXMONTHUP: A 25% drop in the next six months will be reversed for the next six months;
- CRASHSAFE: One hundred minus the probability of having a crash;
- ONLYUP: Increase in prices regardless of the horizon (one month, three months, six months or one year).
In comparison with the other best-known sentiment indicators (AAII, mutual fund flows, etc.) [11]. Confirmed that its “Bubble expectation” sentiment indicator allows for the quantification of a feeling component not taken into account by other known measurement means.
Sentix indices: The Sentix indices are indicators of the sentiment of individual and institutional investors estimated on the basis of surveys which raise usual questions relating to optimism and pessimism about the development of such a financial market and its sector Activity:
- Equity markets: DAX, Euro STOXX 50, Nikkei 225 and SP 500,
- Bond markets: futures contracts on U.S. federal bonds and bonds,
- Sector of activity: currencies (euro/dollar and euro/yen) and commodities (oil, gold).
The Sentix Sentiment Index is calculated as follows:
Sentiment index=(number of bulls - number of bears)/number of votes
In practice, the surveys are carried out through the Sentix website by sending an email to each investor (individual or professional) inviting them to participate in the survey and to answer the questionnaire, motivating them by free access to the results. Then, the results must be distributed according to each type of investor in an aggregated way according to two time intervals of one and six months.
Sentix publishes three sentiment indices compared with the weekly sentiment indicators to find out whether optimism or pessimism is having real effects in the financial market:
- SNTN: neutrality index which determines whether neutral investors feel secure in having the feeling that the studied market is evolving according to a well-established trend or if, on the contrary, they anticipate a market without direction in an uncertain environment.
- SNTA: index which indicates the real position of individual investors on the equity markets.
- SNTW: index which indicates the real position of institutional investors on the bond markets.
Investors intelligence index (II): The Investors intelligence index (II) is based primarily on the publications of financial letter editors which are divided into three subjective categories namely: optimistic, pessimistic and neutral. It is calculated by the share of bulls according to the following formula (neutrals are removed from the calculation):
II=number of bulls/(number of bulls+number of bears)
Criticisms of direct investor sentiment estimation methods are based primarily on four limitations:
- Deadline for publication or dissemination of opinions,
- Lack of graduation of optimism and pessimism,
- Neglect of the relative size of investors except for a simple distinction between professional investor (institutional) and private investor (individual).
- Difference between the statements of the investors surveyed and their actual actions.
This last critique presents the strengths of the indirect indicators of sentiment which will be presented in the next subsection.
Indirect measures of sentiment
Indirect methods of estimating investor sentiment are based on information and market data that is available and free. These methods have an advantage over other direct methods in that there is no lag between the statements of the investors surveyed and their actual actions. In the remainder of this subsection, we will present the main methods of indirect sentiment calculation which are divided into four categories namely: measures based on derivative markets, measures based on undertakings for collective investment in transferable securities (UCITS), measurements from technical analysis and other indirect calculation methods.
Measures based on derivatives markets
Derivatives markets, where derivative products such as options contracts and futures contracts (Futur and Forword) are traded, are used to estimate investor sentiment, particularly that of institutional or professional investors since they are the ones who frequently use this type of product. The investor psychological factor can help explain the difference between the spot (or observed) price of the underlying asset and its equilibrium (or fundamental) price calculated through a theoretical model. We will devote the remainder of this subsection to a detailed presentation of the measures based on the following derivative markets: put-call ratio, implied volatility of options and commitment of traders (COT).
Put-call ratio: Investors who anticipate a rise (fall) in the price of the supporting asset have an interest in purchasing call (put) options. The ratio of the trading volumes of put and call options on the Chicago Board Options Exchange (CBOE) is considered an indicator of investor sentiment. This method of indirectly estimating sentiment is strongly criticized because of the presence of certain shortcomings. Indeed, this sentiment measurement method does not take into account the nature of the position of the initiator of a transaction (buyer or seller). In other words, an option trade has only two parties, one is the buyer and the other is the seller. If an initiator takes the position of the seller of a put option in such a market (closing or opening a position), then the other party who is the buyer of that put option is considered pessimistic. In practice, the measure of the call-put ratio did not take into account that the initiator of this operation took the position of the seller of a put option so he is in a situation of optimism.
Also, the calculation of the put-call ratio does not take into account the sophistication of the operations on the options. This can be seen through the example of the initiator of an open trade who takes the position of the seller of a put option or the buyer of a call option. Logically, this operation shows that the investor has bearish expectations (pessimistic) while his expectations are bullish (optimistic). This investor can hedge against the risk of a possible fall in prices by buying a put option. Consequently, the purchase of the put is more of a hedging operation than an operation linked to a fall in price anticipation.
These deficiencies can be corrected by the use of open positions instead of traded volumes in the calculation of the put-call ratio and by the use of this ratio not only in the equity markets, but also in the bond markets.
Option implied volatility: An option contract is a commitment between two parties. One is the buyer and the other is the seller. On the date of signing the contract, they agree on the terms of an exchange: the underlying asset (assets to be exchanged), the exercise price, the quantity to be exchanged and the date of the exchange expiry (end date of the contract). The option gives its holder the right to exercise or surrender his right according to the conditions of spot prices in the market.
There are two types of option contracts. First, the call option (it gives its buyer the right to buy the underlying asset at the strike price fixed in advance) and the put option (it gives its purchaser the right to sell the support asset at the strike price). In addition, the buyer of the option must pay the seller a premium which is the price of the option contract. This option premium (buy or sell) also depends on the price of the underlying asset. In other words, the option premium increases when the price of the underlying asset is very fragile, this volatility can be measured implicitly according to the option premium through option pricing models. Namely the Black-Scholes model.
The market volatility index (The Market Volatility Index: VIX), which is the implied volatility of options, is considered an indicator of investor sentiment. The VIX index makes it possible to match the evolution of the option's price to its (theoretical) equilibrium price to verify the performance of the option pricing model used to estimate the theoretical price. It is measured on the basis of options (calls and puts "out of the money" with a maturity date of thirty days) on the Standard and Poor’s index (SP composed of 100 shares) by the CBOE and disseminated in time real. We should point out that in 2003 the options on the SP 100 index were replaced by those on the SP 500 and their old index changed symbol from VIX to VXO.
Generally, practitioners refer to the market volatility index as the "investor fear gauge" as Whaley who tried to explain stock market crashes by studying the variation in the index of market volatility since 1986. Proposed a new indicator of investor sentiment measured by the natural logarithm of the ratio between the VIX and volatility history of SP 100. They found that this indicator is inversely correlated with the stock price i.e. when this indicator is high; the risk of a decrease in share prices is too great.
Commitment of traders: Any participant in the American derivative markets must declare their positions to the CFTC (Commodity Futures Trading Commission) which regulates the American derivative markets. It divides traders into three categories with respect to a fixed daily level of transactions carried out for each support asset:
- The commercial trader: if the number of transactions carried out has exceeded the level set by the CFTC. These operators hedge their risks using futures or options.
- The non-commercial trader: if the number of transactions carried out is has not exceeded the set threshold.
- And small traders: the level of intervention of small traders is calculated by a simple difference between the total of open positions and positions opened by commercial and non-commercial traders [12,13]. Developed the methodology of, the aim of which is to determine measures of sentiment for each category of investor:
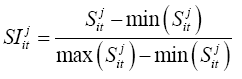
With,
SIjit : Sentiment of class i investors on market j during week t,
Sjit: Net open position of category i investors on market j during week
t, min and max are respectively the minimum and maximum of the three previous years,
i: Category of stakeholders which can take three classes: Commercial traders, Non-commercial traders, Small traders.
Investors in a category are considered optimistic (pessimistic) i.e. they have bullish (bearish) expectations that when the number of positions opened by that category is close to the maximum (minimum) of the previous three years and the feeling measured tends towards 100% (0%). By examining many agricultural commodity derivatives markets, [12]. Showed that the sentiment of commercial traders is an indicator of continuation of the movement unlike that of non - commercial traders which is an annoying indicator. Regarding the sentiment of small traders, the author has no predictive power.
Measures based on Undertakings for Collective Investment in Transferable Securities (UCITS)
Undertakings for Collective Investment in Transferable Securities (UCITS) are instruments widely used by investors. To do this, they can express investors' expectations on the basis of their purchases and sales. However, the most well-known indirect measures of investor sentiment that are based on UCITS are: The discount on closed-end funds, the share of risky assets in UCITS portfolios and subscription flows to mutual funds.
Closed-end fund discount: The discount for closed funds is calculated by the difference between the theoretical value of the securities held by the fund and its real value on the market. The launch of a mutual fund is generally followed by an increase in the real prices of the fund's units compared to their theoretically calculated equilibrium price. Then a discount occurs after a few months of a very close variation. The theoretical value of a fund unit is measured by the ratio between the total value of the securities available to the fund and the number of fund units.
However, several studies have provided explanations related to the psychological and behavioral aspect of investors themselves. Among them, we cite the studies which have confirmed the reliability of the discount on private funds as an indicator of sentiment, particularly for individual investors. Indeed, has shown that sentiment measured by the discount on closed-end funds is an explanatory factor for the volatility of returns [14]. He found that retail investor sentiment and market volatility are positively and significantly related. This implies that the closed-end fund discount is a measure of individual investor sentiment.
Along the same lines, demonstrated that the behavior of individual investors (noises traders) generates an additional risk taken on the securities held by the closed fund, the aim of which is to have additional performance in return [15]. Therefore, this produces a discount on the price. Thus, demonstrated that the discounts of different funds are positively and significantly correlated and that the variation in their value is not influenced by market returns [16].
Likewise, have shown that the average discount on private equity funds can be taken as an indicator of sentiment [17]. Using the haircuts for closed funds named "First Israel" as an indicator of sentiment, Dimson and Minio- Kozerski found that the Israeli-Palestinian peace agreement has shifted investor sentiment towards optimism. Likewise, they demonstrated that the event of the fall of the Berlin Wall influenced the sentiment of German investors as measured by a closed German fund.
In the same line, Bruch, Emery and Fuerst demonstrated that the share discount is strongly influenced by investor sentiment after the September 2001 attack. The share discount after this event was greatly increased due to the feeling of pessimism over this period.
Share of risky assets in UCITS portfolios: UCITS managers have the option of investing part of these funds in risky securities, which indicates their own management choice and therefore reflects their sentiment. Indeed, the American company State Street publishes a monthly confidence index called “State Street Investors confidence index” which measures the share of risky assets in UCITS portfolios. These portfolios are managed by a team which includes professional managers of forty-five different nationalities.
Mutual fund flows: Less informed individual or individual investors generally delegate the management of their portfolios to professional and experienced managers. Therefore, the flow of subscriptions to UCITS invested in equities or other risky securities indicates the sentiment of professional managers. Indeed, mutual funds or mutual funds are sums of money that are pooled by a large number of investors. There are a variety of funds such as fixed income funds, mixed funds (in stocks and bonds), equity funds and social funds. In addition, mutual fund investors have benefited from certain advantages: First, the experience of managers (professionals or experts),
The American management company "Rydex SGI" manages two types of index mutual funds: mutual funds named NOVA (code RYANX) with leverage and inverse funds named URSA "code RYURX" which correspond to the opposite of the profitability of 'a given clue. The company "Rydex SGI" markets symmetrical mutual funds, except for leverage, for equity indices (S&P 500, Russell 2000, Dow Jones Industrial Average) and also for government bonds and loans American. The advantage of investing in symmetrical funds on such an index marketed by the same company is to better analyze the part of funds invested according to the French company ACER Finance also markets index mutual funds, for example the ACER Cube leveraged funds and ACER Strategy funds which correspond to the inverse of the profitability of the CAC 40 index. The ACER Cube/ratio ACER Strategy is used as an indicator of the sentiment of French professional investors since the taxation of these funds presents a constraint for individual investors.
Constructed an aggregate measure of investor sentiment of funds, for example, growth (risk) equity funds and (safe) government bond funds [18]. Warther has shown that mutual fund investors are generally known for their preference to choose investments with recently high returns. In addition, he found that mutual fund flows are too important as an indicator of unsophisticated investor sentiment.
Frazzini and Lamont claimed that mutual fund flows are a very good indicator of individual investor sentiment. Indeed, examined the relationship between the sentiment of retail investors measured by the AAII and the flow of subscriptions in mutual funds (UCITS) [19]. He found that the AAII confidence index is correlated with the flow of subscriptions.
Indicators from technical analysis
Many researchers have demonstrated the relevance of technical analysis as a means that helps in choosing financial assets based on the analysis of historical stock prices and trading volumes. Indeed, Osler confirmed the effectiveness of technical analysis which is based on widely diversified methods even in the foreign exchange market [20]. Thus, technical analysis challenges the hypothesis of the efficiency of financial markets and highlights behavioral finance by confirming the link between the psychology (and sentiment) of investors and market parameters.
The purpose of technical analysis is to determine the trend of the market whether it is bullish, bearish or even neutral for a period of time which may be short or long term. Determining the market trend helps the investor to make the right decision. If, for example, the market trend is bullish for a long period of time, this allows the investor to detect the start of that uptrend which is continuous over time before exiting the market even closer to the highest as possible. 'until an indicator has shown him the end of this movement of progression.
Several indicators from the technical analysis are used as measures of investor sentiment, namely: ARMS: Trading volume, Trading volume carried out by individual investors (Retail or individual investor trades), Insider Trading, Ratio of the number of rising stocks to the number of falling stocks, Ratio of the number of stocks that achieved the highest level divided by the number of stocks that achieved the lowest level.
ARMS-trading volume: Trading volume ARMS was created in 1989 and it took the name of its founder [21]. It is measured as follows: the number of securities that have achieved an increase in relation to their trading volume divided by the number of securities that have experienced a decrease in relation to their trading volume:
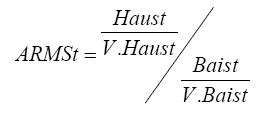
, with:
ARMS t: ARMS index at the end of period t,
Increase t: number of securities increasing during period t,
Bais t: number of securities decreasing during period t,
V. Haus t: volume of exchanges on securities rising during period t,
V. Bais t: volume of trading in declining securities during period t.
Thus, the value of this index can tell us whether investor sentiment is bearish or bullish. In other words, if the index ARMS is greater than 1 i.e. the average volume of trading in declining securities exceeds that of increasing securities, so strong pressure to sell securities characterizes the market situation, which therefore reflects the effect of a bearish sentiment. On the other hand, if the average volume of trade in increasing securities exceeds that of declining securities (the ARMS ratio is less than 1), which reflects a situation of strong buying pressure thus constituting the impact of a sentiment.
Baker and Stein have shown that irrational investors (noise makers) are more likely to trade, and thus add even more liquidity when they are optimistic rather than when they are pessimistic [22].
So, Scheinkman and Xiong asserted that the volume of trade in the financial market illustrates the difference in investor opinions related to valuation levels when short selling is difficult. In addition, market turnover measured by the ratio of the volume of transactions to the number of shares listed on the stock market is a simple estimate of this measure.
Volume of exchanges carried out by individual investors (Retail or individual investor’s traders): Individual investors are more likely to be prone to sentiment than professional investors since they are less informed and less experienced than others. During the internet bubble, Greenwood and Nagel noted that 'young' individual investors are more likely to buy stocks than 'older' individual investors.
So, Odean and Zhu observed a concordance and consistency between the buy and sell operations carried out by individual investors, through an analysis of the volume of investor transactions. More precisely, Odean and Zhu inspired a measure of individual investor sentiment, which is based on the volume of trade in financial assets.
Insider trading: Insider trading is the buying and selling of securities by someone who is part of the company corresponding to the securities. Indeed, he can be an officer, an executive, a director, a broker or a member of the family of the company. Thus, they are well known as informed investors i.e., they have a right of access to non-public inside information regarding the status of the shares. As a result, they have a direct advantage over external investors (outsider investors), who do not have information that has not yet been made public. Thus, insiders' personal portfolio decisions can also reveal their insights into how their business works. For that, it may be wise for other investors to observe and review trading transactions carried out by insiders since they are better informed about the status of the securities being traded. So, insider trading is considered a sentiment measure.
Other indirect calculation methods
Internet search engine (Google): Based on the search volume index (SVI), Hal Varian suggested that Google can match the number of queries made on a given expression. In other words, the volume of search operations on certain themes can be used as a forecast indicator for certain economic variables since SVI is based on Google, the most famous internet search engine used by Internet users.
Several studies have looked at SVI as an indicator of interest or sentiment associated with a particular economic event. Indeed, Choi and Varian found that the number of searches relating to the themes of housing, vehicles or travel is significantly correlated with the number of sales transactions in these sectors [23].
Thus, examined the relationship between IVR as an indicator of Internet users' interest in a particular financial asset by using the name of the company corresponding to this financial asset as a research theme and the profitability of these financial assets [24]. They found that the profitability of the first day of listing of a financial asset is positively and significantly correlated with the IVS which measures investors' interest in this asset. This means that investors are using Google as a search engine via the internet to collect more information about a financial security that held their attention to purchase it and it cannot be said that the increase in the number of matching queries for that security is a recent indicator of stock market investor sentiment [24].
Level of profitability of the securities introduced and number of IPOs: The performance of initial public offers is generally exceptional on their first day of listing. This finding implies the strong motivation of investors to trade IPOs and for this reason the return of the first day of the IPO is taken as a measure of investor sentiment. We can cite the following example: In August 1995, "Netscape" achieved a very high return (108 percent) on the first day of its IPO. Additionally, the average first day return is highly correlated with other sentiment indicators like IPO volume.
Typically, the volume of Initial Public Offers (IPOs) is strongly associated with investor sentiment. Indeed, investors see initial public offerings as windows of opportunity that open and close by chance. Thus, several studies have tried to explain the extreme fluctuations in IPO volume. For example, some periods are characterized by an average volume over 100 IPOs for each month, and no IPOs are issued during others less.
Ibbotson, Sindelar and Ritter have shown that investors are more likely to overpay for newly floated securities when they are bullish, prompting more companies to list. Have shown that the volume of IPOs is positively related to investor sentiment [25]. IPOs are very sensitive to the mindset of investors. This result is confirmed by the study by which indicates that the volume of IPOs is significantly linked to investor optimism [26].
Margin buying, short selling share and market-to-book ratio: Buying on margin is considered a measure of investor sentiment. It represents the purchase of securities with funds partially borrowed from the broker. These operations are frequently used in the United States and their conditions are set by the Federal Reserve, which publishes each month the change in the outstanding amount of these loans. When the outstanding amount is high, it implies that investors are optimistic and when it is low then, it indicates that investors are pessimistic.
In addition, the share of short selling indicates investor sentiment. Indeed, if it is low, then investors are optimistic, on the other hand if it is high then investors are pessimistic. So when investors tend to prefer buying stocks corresponding to growing companies that do not distribute dividends then this may indicate their feeling of optimism. And, therefore, investors' feelings of optimism or pessimism are measured by comparing the Marketto- Book ratio of growing companies that do not distribute dividends and the ratio of other companies.
Non-economic events: Several studies have examined the link between non-economic events and investor sentiment. They found that there is a significant correlation between them and they considered that these non-economic events are factors that influence the psychology of investors leading them towards optimism or pessimism. These non- economic events are for example sunshine, religious holidays, sports results, and lunar cycles [27-30].
Indeed, Edmans studied the impact of international football results as an indicator of investor sentiment regarding stock returns [29]. They found that the losses in the matches lead to too low returns in the country losing the next day at the level of the securities corresponding to the companies of low market capitalizations (small sizes). Some studies have examined the relationship between stock prices and changes in investor emotions.
For example, Kamstra noted that returns in financial markets are lower during the fall and winter seasons. They found that this can be attributed to the onset of a seasonal emotional anomaly that affects stock returns.
After having presented in detail the various indirect measures of investor sentiment, we can make the following remarks: Although the indirect indicators of investor sentiment are numerous and too diversified, they have two limitations. On the one hand, they do not separate the effects linked to investor sentiment from the effects linked to the fundamentals of the economy. And, on the other hand, they don't take investor sentiment into consideration at the moment the measurement is made.
Composite measures of investor sentiment
The first researchers who tried to approach investor sentiment more perfectly by combining both the two modes of direct and indirect measures [4,8]. Their combination provides a composite sentiment indicator that is more relevant than the other indicators. We will devote the first part of this subsection presents the composite model of [8]. The second part will be devoted to the composite model of [4]. Where we will review the correlations between the different measures of sentiment.
Brown and Cliff model (2004)
Before constructing their composite measures of investor sentiment, examined the relationship between the different modes of direct and indirect sentiment measures [4]. They practically tested the correlation between on the one hand a direct indicator of investor sentiment, in particular the retail investor sentiment index (AAII) or the professional investor sentiment index, and, on the other hand, indirect indicators of sentiment.
The authors estimated these sentiment measures based on weekly and monthly US financial market data. They discovered significant correlations between the different modes of direct and indirect measurements and even the indirect indicators are also correlated with each other. This means that the different modes of measurement have the same components of investor psychology. After confirming the individual reliability of each sentiment measurement, it is essential to examine the reliability of the combination of several measurement techniques in order to improve the quantification of the sentiment indicator and to seek to better understand the investor psychology.
Using the different sentiment measures presented above and after examining their correlations, have constructs three composite measures of sentiment according to the following two construction methods: the first method is based on a state variable determined by the Kalman filter method, while the second construction method is based on a principal components analysis [4].
Regardless of the indicators and the monthly or weekly data, the two methods gave results that were largely close and their appearance was very similar. Unlike the methodology of where they dissociated the effects linked to investor sentiment from those linked to the economic cycle, dissociated the sentiments of individual investors from those of professional investors [4,8]. Indeed, they used the “AAII” Confidence Index as a direct indicator of sentiment for retail investors and the Investors Intelligence “II” Confidence Index as a direct measure of sentiment for professional investors. Regarding the indirect indicators of investor sentiment, they used the same indicators for the two series of composite measures. As a result, they found that the two series are positively correlated, but that they are not the same.
Baker and Wurgler model
Combined six proxy sentiment indicators to formulate a composite measure of sentiment using a principal component. The authors corrected the temporal synchronization of the different variables by emphasizing certain variables over others [8].
In practice, the composite model of Baker and Wurgler is formulated as follows:

With,
SENTIMENT t: The investor sentiment index at time t,
CEFD t: The discount of closed funds is the differential between the market value of the fund and that of the net assets at time t,
TURN t: The liquidity indicator is the deviation from its five-year moving average of the logarithm of the volume traded on the NYSE (New-York Stock Exchange) relative to the number of securities listed on the In the event of a ban on short selling, have shown that an increase in the level of liquidity is indicative of a high level of investor sentiment of optimism [22].
NIPO t and RIPO t-1: Are successively the number of initial public offerings at time t and the profitability of the first day of listing of the securities newly introduced on the stock exchange at time t-1,
St: The ratio of equity issues divided by total securities issues in t,
P(t-1)^(D-ND): The differential of the Market-to-book ratio for growing firms in t-1.
Baker and Wurgler took into account the time lags between the variables since some indicators require more time to reveal the same feeling [8]. They used principal component analysis to determine the coefficients that are consistent with what they anticipated in terms of expected signs of the factors. In equation (1), Baker and Wurgler did not take into account as sentiment indicators that are likely to be affected by economic conditions [8]. In other words, each indicator is made up of two parts: an irrational part linked to investor sentiment or psychology and another rational part linked to the fundamentals or the economic cycle.
To fill this gap, the two authors tried to neutralize the effects linked to the economic fundamentals by regressing each sentiment indicator compared to the various economic indicators. Then, they retained each residue of these regressions (symbolized by "┴") as the irrational part of the indicator which is effectively linked to investor sentiment or psychology. After this dissociation of the effects, Baker and Wurgler developed their equation (1) by obtaining the following model (2):

Constructed a Sentiment Index by combining six sentiment measures generally used by most of the following studies: the volume of transactions, the dividend premium, and the discount on equity funds closed, the number and day 1 yield of new IPOs, and the share of equity in new issues [7]. They found that the volume of transactions, the number and return on Day 1 of new IPOs, and the share of equity in new issues are positively associated with sentiment levels. In contrast, the discount on closed-end funds and the dividend premium are negatively associated with sentiment levels.
For example, found that investor sentiment influences stocks. Indeed, a low level of sentiment is accompanied by an increase in the profitability of securities corresponding to young companies, with low market capitalizations, with excessively high volatility, with little profit, paying little dividend, with a high growth opportunity [7]. Consequently, they concluded that investor sentiment is an explanatory factor for the variation in returns.
Baker and Wurgler demonstrated that their Composite Sentiment Index can generally be a better indicator for measuring sentiment, and particularly for capturing speculative bubbles and stock market crashes. Figure below produced by Baker and Wurgler present two curves, the first of which highlights the calculated sentiment index (high or low) and the second indicates the volatility of investor sentiment [7]. These authors found that variables like trade volume, IPO volume, first day IPO listing yield, and stock volume in new issues) are positively related to sentiment. In contrast, the discount on closed-end funds and the dividend premium are negatively associated with sentiment (Figure 1).

Figure 1. A sentiment index, January 1996 through December 2005.
Based on this figure, the authors considered the period from the late 1970s to the mid-1980s to be characterized by strong sentiment. Also, it is very clear that the sentiment index for the year 1999 was very strong. Likewise, the end of the 1990s when the feeling was too strong before the collapse of the Internet bubble. However, it is very difficult to predict the change of this index. Sentiment volatility becomes very important during speculative periods. We can then conclude that the sentiment index can build a reliable indicator to anticipate crises and stock market crashes [31- 37].
In this article, we started by presenting the concept of “investor sentiment” then we cited its measurement indicators which are very diverse because of the lack of consensus on a single definition of investor sentiment.. Each method of measuring investor sentiment has interests and limits.
Indeed, although direct measures are sentiment-specific measures and do not require any justification by theories, they still have limitations such as neglect of levels of optimism and pessimism, limited representativeness of the population, l 'gap between the investors' declaration and their actual actions, and the time between the completion of the survey and the publication of the results. Likewise, indirect measures have been criticized for not dissociating irrational behavior from rational behavior in the face of economic events and failure to take investor sentiment into account at the time the measurement is made.
Finally, composite indicators which combine both indirect measures like the model of Baker and Wurgler or direct and indirect measures at the same time like the model. These researchers built their composite models by taking into account the correlation between the different measurement modes, which confirms their assembly of the same information. Although the latter reassures the reliability of the indicators used, it simultaneously raises the question of little added value and the risk to be over weighted, by information taking it into account several times or by certain characteristics of investors linked to their psychology.
Following this work, we studied the reliability and relevance of a particular method of measuring investor sentiment through its relationship with movements in financial markets, in terms of the explanatory power of the returns and volatilities of equities in the Tunisian context.