Research Article - (2023) Volume 12, Issue 1
Received: 02-Jan-2023, Manuscript No. jacm-23-91541;
Editor assigned: 05-Jan-2023, Pre QC No. P-91541;
Reviewed: 17-Jan-2023, QC No. Q-91541;
Revised: 21-Jan-2023, Manuscript No. R-91541;
Published:
30-Jan-2023
, DOI: 10.37421/2168-9679.2023.12.510
Citation: Kumah, Maxwell Seyram. “Investigating Similarity
Ratios of Student Teachers Unfair Advantage Performance in Mathematics
using Kolmogorov-Smirnov Test.” J Appl Computat Math 12 (2023): 510.
Copyright: © 2023 Kumah MS. This is an open-access article distributed under the terms of the Creative Commons Attribution License, which permits unrestricted use, distribution, and reproduction in any medium, provided the original author and source are credited.
Student teachers’ increase rate in resit in mathematics courses at college is very worrisome situation that need urgent attention.
Purpose: The study aimed to investigate the similarity ratios that exist between male and female student teacher with casualty and those without casualty in relation to their mathematics performance in college. Two hypotheses were set to test similarity among the variables.
Method: A quantitative research approach with case study research design was employed. Participants (level 300 student teacher who took some mathematics courses) were purposively selected. A sample 999 of them from seven Colleges of Education (CoEs) from Volta and Oti regions were randomly selected.
Results: The results established that there was a significant difference between male and female student teachers, based casualty and non – casualty academic performance. However, it was interesting to note that the difference occurred within the score range of 60 – 69%. For non – casualty distribution group it was found that 0.028 < 0.058 indicating a significant difference between male and female student teachers. Similarly, it was found that 0.028 < 0.038 indicated a significant difference between male and female in the casualty distribution group of student teachers’ academic performance in mathematics at college. In addition, there was an overall academic performance difference between the casualty and non – casualty distribution groups where 0.039 and 0.058 respectively were less than 0.465. This suggest that there is a significant difference between casualty and non – casualty student teachers in their mathematics academic performance.
Distribution function • Mathematics • Similarity ratio • Kolmogorov smirnov test
The current trend of nation building revolves around the development of STEM education where mathematics plays a key role between the other three areas of discipline. It is widely held that the development of human resources must be the foundation for any meaningful progress. Hence, STEM education has become the vehicle for rapid development and social deployment in any society. It purpose is to produce efficient and effective human resource forces that can combine working ideas that deal with problems solving issues within their reach Adane LO [1]. Her study explores that factors that account for student difficulty in learning and later result to poor performance. Environmental factors were found to play a significant role in student poor performance particularly in mathematics. Home conditions also form part of the problem but student absentees were key among the other contributing factors. These factors were obtained from selected institutions which are perceived to be high performing schools. According Pell G, et al. [2] to exam retakes are still a problem for educators in the context of criterion-based clinical assessment and more generally. Students that are involved often make up a tiny portion of the cohort, but it is particularly with these students that institutions have a tremendous burden in making sure they perform to a high enough level and are fairly evaluated. The public must be shielded from incompetent practitioners while still giving the students a "reasonable" chance to meet the required standard(s), particularly when clinical skills are being evaluated. However, this poses a delicate conflict for universities because repeat exams incur additional costs and student failures have a negative impact on outside funding.
The legitimacy and reliability of institutional assessment procedures have recently come under increased scrutiny. This is definitely the case in teacher education, where students spend four years in school before receiving their degree. Later on in the program, they will fight hard to protect their significant investment in case they are found to have fallen short of the required standard. In contrast, there are major consequences for teaching learners if teacher educators are not sufficiently strict in setting adequate performance requirements. As a result, the assessment and standard-setting process needs to stand up to close examination by the various stakeholders. Following national and international conferences on teacher education, such as the Africa Federation of Teachers Regulatory Authority (AFTRA) annual conference, and watching the significant and well-attended measurement strand can help identify the significance of assessment in teacher education. Many of the approaches used for defining standards and examinations are either very time-consuming and demand that panels of experts analyze all questions in advance, or they call for the analysis of enormous datasets made up of individual student evaluations. Although the number of students retaking exams varies, it often rises in the later years of Colleges of Education (CoEs) courses. The cost of the official examination of retakes clearly creates a problem in terms of value for money. Singh V, et al [3]. The gender equality conundrum points to a contradictory phenomenon. It was stated that industrialized, gender-equitable, democratic countries show that cognitive sex differences are significant in the cognitive task performances of males and females.
In contrast, despite regional differences, several studies have found a male advantage in visuospatial ability. The current findings, which focus on cognitive sex differences in a developing, gender-inequitable nation, may shed light on how generalizable cognitive differences are, particularly with regard to the gender-equality dilemma. For instance, it is probable that male advantage in risky decision-making is reflected in the academic achievement of elite higher education programs that place a heavy emphasis on arithmetic. However, in math-intensive schooling, the importance of planning and cognitive flexibility, which favor women, is still underappreciated. The study results, highlighting the validity of our findings and suggesting that working memory may be a crucial component of male participants’ academic success. Working memory appeared to be essential for male academic success, consistent with other studies; nevertheless, we emphasize that further research is required to determine whether these findings can be replicated. For example, in the current study, sex differences on the same four cognitive tests were not significant in the small dataset, probably due to sample size, while differences on the same tasks in the large dataset indicated substantial but tiny sex differences. To comprehend how cognitive sex differences may contribute to a lack of gender diversity in schooling, more powered studies from developing nations with a large, gender-balanced sample are required. The main aim of this study is to investigate student teacher mathematics performance and resit profiles of students in two CoEs, each of which uses the same standard setting approach, are examined and compared. The analysis would show whether there are disparities between casualty (resit/ supplementary exams) and non-casualty (wrote the exam once as scheduled) student teachers, as well as differences between male and female student teachers. The main question under investigation is whether resits/ supplementary exams, give the resisters an unfair disadvantage over the non – resit students.
Aim of the study: The aim of the study was to investigate the performance of student teachers in Colleges of Education by comparing those with casualty and non – casualty groups. This will determine the similarities and difference that exist between the two groups in relation to sex and score range.
Hypotheses: The definition of hypothesis served as the guide to the analysis of the data collected. The Kolmogorov-Smirnov test was to explore the similarity between males and females in terms of casualty and non – casualty rates, the null hypothesis is stated as follows whereas it was assumed that the student teachers who experienced various challenges (for example, re – sit, writing of supplementary papers, incomplete CA) to pass their mathematics examinations were classified as casualty student teachers. Again, the hypothesis for all participants was stated to compare the overall performance rate of student teachers in mathematics.
H01: Casualty and Non – casualty rates of females and males come from the same distribution functions.
H02: Casualty and Non – casualty rates of all student teachers come from the same distribution functions.
Empirical evidence: Mathematics is a fundamental subject that plays a vital role in the academic and professional lives of individuals. However, not all students are able to perform well in mathematics, and many may need to take resit exams to improve their grades. The purpose of this literature review is to investigate the advantages of resit and non-resit students in mathematics performance.
Resit exams: Resit exams are a common practice in education, allowing students to retake an exam in order to improve their grade. In mathematics, resit exams can be particularly important as they allow students to demonstrate their understanding of the subject and potentially improve their overall grade. It was found that students who took resit exams in mathematics were able to significantly improve their grades compared to those who did not Brady ST, et al. [4].
Advantages of resit students: One advantage of resit students is that they have already been exposed to the material and have had the opportunity to practice and refine their understanding of the subject. This may give them an advantage over non-resit students who are encountering the material for the first time. Additionally, resit students may have a better understanding of their strengths and weaknesses in the subject, allowing them to focus their efforts on areas where they need the most improvement.
Advantages of non-resit students: Non-resit students, on the other hand, may have the advantage of being able to approach the material with fresh eyes and without the pressure of needing to improve their grades. They may be more relaxed and able to think more creatively, which can lead to a deeper understanding of the subject. Additionally, non-resit students may be able to learn from the mistakes and successes of resit students, allowing them to avoid common pitfalls and build on what has already been learned.
A quantitative case study design was employed to investigate the comparison of distribution similarities between student teachers’ casualty and non – casualty performance rates in mathematics for sex and scores in different ranges. The statistical analysis includes description on data collection and hypotheses statements. The Kolmogorov-Smirnov (KS) test was used throughout in explaining the similarities that exist between the variables. All students who took some Mathematics courses within the four semesters and are in level 300 were purposively used as the population of which 999 were randomly sample for the study. The sample served as an appreciable representative of the students’ population about 1,200.
The success of the methodology largely depends on effective manipulation of the data and the variables that are defined for the purpose of the study. The first aspect is the variables that described the sex and score ranges, whereas the second aspect includes the resulting variables like casualty and non - casualty rates. Data for 999 student teachers’ performance in mathematics were collected in two academic years thus from 2019 to 2020 academic year, in Volta and Oti zone Colleges of Education (CoEs) in Ghana. Seven designated CoEs, where student teachers had been separately under different programmes of study, were selected as the case study. Data have been collected for two successive results from all mathematics courses in two academic years aforementioned through the Department of Mathematics and Computer Studies Education Result Desk abbreviated as DMCSERD in the various colleges. The total accessible students sampled was 999 of 517 male and 482 female in which 483 student teachers resulted in casualty, and 516 non – causality. The casualty in the study is defined as the “student teachers who underwent various forms anomalies before passing their mathematics courses in college. On the other hand, non – casualty is defined as student teachers who sat once for the exams and did not went through any struggled in order to pass their mathematics course in college. Likely enough, the DMICTRD provides all the required variables that help the researcher to conduct the study. The descriptive statistics and more details of the student teachers who have been classified by gender and score ranges have been tabulated in (Table 1) that shows an overall view of the data collected and analyzed in the study. As presented, gender is classified into the male and female, score range into eight groups from 0 to 100 performance range. The performance range used in the study are based on the grades obtained by the student teachers, thus from E (0 – 49) to A (80 – 100).
| Groups | Casualties | No Casualties | Total | ||||||
|---|---|---|---|---|---|---|---|---|---|
| Scores | M | F | Total(M+F) | M | F | Total(M+F) | M | F | Grand Total |
| 0-49 | 34 | 49 | 83 | 0 | 0 | 0 | 34 | 49 | 83 |
| 50-54 | 57 | 69 | 126 | 24 | 63 | 87 | 81 | 132 | 213 |
| 55-59 | 45 | 47 | 92 | 39 | 41 | 80 | 84 | 88 | 172 |
| 60-64 | 67 | 36 | 103 | 49 | 51 | 100 | 116 | 87 | 203 |
| 65-69 | 15 | 8 | 23 | 52 | 23 | 75 | 67 | 31 | 98 |
| 70-74 | 20 | 16 | 36 | 42 | 34 | 76 | 62 | 50 | 112 |
| 75-79 | 11 | 9 | 20 | 35 | 24 | 59 | 46 | 33 | 79 |
| 80-100 | 0 | 0 | 0 | 27 | 12 | 39 | 27 | 12 | 39 |
| - | 249 | 234 | 483 | 268 | 248 | 516 | 517 | 482 | 999 |
The casualty and non – casualty rates have been computed based on the
data collected from the departments and presented in (Table 2). The score range
is divided into eight groups while the sex is only two groups, thus, male and
female. The computed value for casualty student within the score range of 50 –
54 is as followed. The exemplar group (50 – 54) is known as high-risk group to
failure  . The 57 and 81 are the observed number male casualty in the
above – mentioned score range over the total number of males in the distribution
respectively. The non–casualty rate for the same group we have
. The 57 and 81 are the observed number male casualty in the
above – mentioned score range over the total number of males in the distribution
respectively. The non–casualty rate for the same group we have  , where
the 24 and 81 represent the number of males over the total number of males
in the distribution respectively. Comparatively there is a high risk of failure
level among the casualty students compared to non – casualty students. The
cumulative proportion, demand the computation of KS test analysis which is
directly based on the casualty and the non – casualty rates. For example, we
have the cumulative proportion of casualty rate for (50 – 54) score range as
, where
the 24 and 81 represent the number of males over the total number of males
in the distribution respectively. Comparatively there is a high risk of failure
level among the casualty students compared to non – casualty students. The
cumulative proportion, demand the computation of KS test analysis which is
directly based on the casualty and the non – casualty rates. For example, we
have the cumulative proportion of casualty rate for (50 – 54) score range as 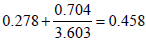 . The 0.278 represent the cumulative proportion casualty
for male within the score range of (0 – 49), 0.704 is the casualty rate of male in the
score range of (0.704) while 3.603 is the total casualty rates of all male students
in that group; given the result of 0.458. Subsequent, computation and analysis
of cumulative proportion followed same process as presented in (Table 2). The
find the differences between the cumulative proportion of males and females in
each classification. The absolute value of the two proportions is considered to
obtain the differences. For example, for the earlier demonstrated groups, it is
computed as |0.473-0.458|=0.014. Following the differences computed the KS
test required that we determine the maximum difference for the entire casualty
rates as well as the non – casualty rates. The maximum difference for casualty
rate was Dmax=0.038 while the difference maximum for Dmax=0.058. The overall rate difference in (Table 3) present maximum difference as Dmax=0.465. To
actually explain the performance difference between the groups we compared
the observed KS test computed result with the KS test critical values. Student
teaches score range for casualty rate is in seven categories, so the KS (95%, 8) test critical value is
. The 0.278 represent the cumulative proportion casualty
for male within the score range of (0 – 49), 0.704 is the casualty rate of male in the
score range of (0.704) while 3.603 is the total casualty rates of all male students
in that group; given the result of 0.458. Subsequent, computation and analysis
of cumulative proportion followed same process as presented in (Table 2). The
find the differences between the cumulative proportion of males and females in
each classification. The absolute value of the two proportions is considered to
obtain the differences. For example, for the earlier demonstrated groups, it is
computed as |0.473-0.458|=0.014. Following the differences computed the KS
test required that we determine the maximum difference for the entire casualty
rates as well as the non – casualty rates. The maximum difference for casualty
rate was Dmax=0.038 while the difference maximum for Dmax=0.058. The overall rate difference in (Table 3) present maximum difference as Dmax=0.465. To
actually explain the performance difference between the groups we compared
the observed KS test computed result with the KS test critical values. Student
teaches score range for casualty rate is in seven categories, so the KS (95%, 8) test critical value is  . since the critical value 0.028 < 0.038, it shows
that there is a significant difference between male and female in the casualty rate
of student teachers’ performance in mathematics at college. Again, it was found
that the critical value 0.028 < 0.058 therefore, there is a significant difference
between male and female in the non – casualty rate in the distribution.
. since the critical value 0.028 < 0.038, it shows
that there is a significant difference between male and female in the casualty rate
of student teachers’ performance in mathematics at college. Again, it was found
that the critical value 0.028 < 0.058 therefore, there is a significant difference
between male and female in the non – casualty rate in the distribution.
| Cum. Prop. for Casualty |
Cum. Prop. For non – casualty |
|||||||||
|---|---|---|---|---|---|---|---|---|---|---|
| Scores | M | F | M | F | Df | M | F | M | F | Df |
| 0-49 | 1.000 | 1.000 | 0.278 | 0.301 | 0.023 | 0.000 | 0.000 | 0.000 | 0.000 | 0.000 |
| 50-54 | 0.704 | 0.523 | 0.473 | 0.458 | 0.014 | 0.296 | 0.477 | 0.067 | 0.102 | 0.035 |
| 55-59 | 0.536 | 0.534 | 0.622 | 0.619 | 0.002 | 0.464 | 0.466 | 0.173 | 0.202 | 0.029 |
| 60-64 | 0.578 | 0.414 | 0.782 | 0.744 | 0.038 | 0.422 | 0.586 | 0.269 | 0.327 | 0.058 |
| 65-69 | 0.224 | 0.258 | 0.844 | 0.822 | 0.023 | 0.776 | 0.742 | 0.446 | 0.485 | 0.040 |
| 70-74 | 0.323 | 0.320 | 0.934 | 0.918 | 0.016 | 0.677 | 0.680 | 0.600 | 0.631 | 0.031 |
| 75-79 | 0.239 | 0.273 | 1.000 | 1.000 | 0.000 | 0.761 | 0.727 | 0.773 | 0.786 | 0.014 |
| 80-100 | 0.000 | 0.000 | 1.000 | 1.000 | 0.000 | 1.000 | 1.000 | 1.000 | 1.000 | 0.000 |
| - | 3.603 | 3.321 | - | Max | 0.038 | 4.397 | 4.679 | - | Max | 0.058 |
| Overall Rate | Cum Prop | ||||
|---|---|---|---|---|---|
| Scores | TC | TNC | TC | TNC | Df |
| 0-49 | 1.000 | 0.000 | 0.290 | 0.000 | 0.290 |
| 50-54 | 0.592 | 0.408 | 0.462 | 0.090 | 0.373 |
| 55-59 | 0.535 | 0.465 | 0.618 | 0.192 | 0.426 |
| 60-64 | 0.507 | 0.493 | 0.765 | 0.300 | 0.465 |
| 65-69 | 0.235 | 0.765 | 0.833 | 0.468 | 0.365 |
| 70-74 | 0.321 | 0.679 | 0.926 | 0.617 | 0.310 |
| 75-79 | 0.253 | 0.747 | 1.000 | 0.781 | 0.219 |
| 80-100 | 0.000 | 1.000 | 1.000 | 1.000 | 0.000 |
| 3.443 | 4.557 | Max | 0.465 | ||
Using graphical representation in (Figures 1-3) a line graph was used to demonstrate the differences that occur between male and female in each group. An oval is use to indicate where the maximum difference in each case occurred. It shows the absolute value difference for the casualty rate among student as 0.038, non – casualty as 0.058 and the overall as 0.465. Since both the casualty and non – casualty rate revealed a significant difference between male and females it implies that we reject the null hypothesis which expressed that there is no difference. Similarly, there is enough evidence to say that there is an overall rate difference between student teacher performance in mathematics at college following the casualty and non – casualty rate. Since the critical value 0.028 < 0.465. This suggests that there is a marginal difference in student teachers who experienced casualty and those who did not experience casualty as far as the score range is considered. This suggest that student teachers without casualty have significant advantage in performance over those with casualty.

Figure 1. Cumulative proportion 1.

Figure 2. Cumulative proportion 2.

Figure 3. Cumulative proportion 3.
As perceived over decades regarding student inconsistent performance in mathematics at all levels of education, the result in this study still confirmed the existence of “math phobia” attitude among student teachers. Since this is a worrisome situation to educational authorities, the Kolmogorov-Smirnov test was used to investigate the similarity of the score-based distribution functions for sex (male and female). The research was conducted in the Volta and Otis region of Ghana, where data for 999 student teachers were available to the researcher for the study. This was obtained from seven colleges that were designated to train teachers for basic education in Ghana. The results of statistical analysis revealed that, the student teachers’ casualty and non – casualty rates did not come from the same distribution functions in relation to sex, if the scores range serves as a basis for classifying student teachers. Similarly, they are different based on their score range categories. It can therefore be concluded that sex remain a significant contributing factor for casualty and non – casualty rates as far as score range has a significant influence on the student teachers’ mathematics performance rates. These suggest that mathematics tutors have to be conscious of student teacher active participation and performance in mathematics regardless of their gender, and their score ranges because the student teachers’ sex and score ranges play a significant role on the chance of casualty and non – casualty. In conclusion, both resit and non-resit students have their own advantages when it comes to mathematics performance. Resit students have already been exposed to the material and may have a better understanding of their strengths and weaknesses, while non-resit students may be able to approach the material with fresh eyes and think more creatively. Further research is needed to explore the advantages and disadvantages of each approach, and to develop strategies to promote success for all students in mathematics.
Researchers who are interested in working in this area are recommended to focus more on specific personal characteristics that normality that account for the large number of casualty rate of student teachers’ performance in mathematics.
Google Scholar, Crossref, Indexed at
Google Scholar, Crossref, Indexed at
Journal of Applied & Computational Mathematics received 1282 citations as per Google Scholar report