Research Article - (2026) Volume 9, Issue 1
Received: 25-Nov-2024, Manuscript No. JBR-24-153219;
Editor assigned: 28-Nov-2024, Pre QC No. JBR-24-153219 (PQ);
Reviewed: 16-Dec-2024, QC No. JBR-24-153219;
Revised: 04-Feb-2026, Manuscript No. JBR-24-153219 (R);
Published:
11-Feb-2026
Citation: Nasir, Sabeen, Asif Ali, and Shabnam Wazir. "Immunohistochemical Expression Levels of CD133 Cancer Stem Cell Marker in Glioma Patients." J Brain Res 9 (2026): 304.
Copyright: © 2026 Nasir S, et al. This is an open-access article distributed under the terms of the creative commons attribution license which permits unrestricted use, distribution and reproduction in any medium, provided the original author and source are credited.
Background: The most prevalent kind of brain tumours are gliomas, and because of their high recurrence rates, managing them is still difficult. The development, progression, and treatment resistance of gliomas have all been linked to Cancer Stem Cells (CSCs). A well-known CSC marker, CD133, is essential to the biology of gliomas and may be a prognostic predictor.
Objective: To assess the immunohistochemistry expression levels of CD133 in patients with gliomas and link them with the histological type and tumour grade. Methods: We used Tissue Microarrays (TMAs) to assess 128 glioma tissue samples. The Immunoreactive Score (IRS) was employed to measure staining intensity, and immunohistochemical staining was used to identify CD133 expression. The Chi-square test was used for statistical comparisons, and SPSS software was used for data analysis.
Results: CD133 expression was found in 40.6% of samples of gliomas. Strong expression was mostly observed in glioblastomas and other high-grade gliomas. CD133 expression did not substantially correlate with patient sex, age, tumour size, or location, but it did correlate with tumour grade (p<0.0001) and histological type (p<0.0001).
Conclusion: Advanced glioma grades and a worse prognosis are linked to higher CD133 expression. It may be possible to identify cancer stem cells in gliomas using CD133, which could help guide treatment plans and forecast patient outcomes. To comprehend its function in glioma aetiology and treatment resistance, more investigation is required.
CD133 • Cancer stem cell • Immunohistochemistry • Immunoreactive Score • Glioma
Gliomas are the most common kind of brain tumour, making up more than half of all brain tumours [1]. Glial cells can give rise to a wide variety of neuroectodermal malignancies, including oligodendrogliomas, ependymomas, and astrocytes [2]. In recent years, new paradigms in adjuvant medications, surgical techniques and technologies, diagnostic imaging, and molecular markers have been brought about by advances in the biology of Low-Grade Gliomas (LGGs) [3]. When taken as a whole, these developments are improving survival and quality of life.
Gliomas are responsible for over 13,000 cancer-related deaths in the United States each year [4]. In Egypt, high-grade gliomas make about 1% to 2% of all human neoplasms, making them the most common type of CNS neoplasm [5].
Gliomas are created when cells that comprise the mature brain dedifferentiate [6]. However, a number of studies have shown that Cancer Stem Cells (CSCs) and the glioma formation process are closely related [7].
There is a lot of interest in identifying prognostic and predictive biomarkers for gliomas because patients with these conditions have different prognoses and respond differently to treatment. Several studies have suggested that the presence of CSCs is closely related to tumour biology and treatment resistance [8]. The importance of CSCs in glioma prognosis prediction has therefore been thoroughly investigated using several markers that are directly associated with the presence of these cells [9].
CSCs are the source of Glioblastomas Multiform (GBM) patients' resistance to radiation and chemotherapy, which results in a poor prognosis. Therefore, a variety of markers that are closely associated with the existence of CSCs have been employed to investigate the role of these cells in predicting the prognosis of glioma patients.
CD133 is a transmembrane glycoprotein with five transmembrane segments, an intracellular C-terminal domain, and an extracellular N terminal domain. Prominin 1 (PROM1), the CD133 gene in humans, is found on chromosome. The CD133 tumor marker is specifically used for CSCs of malignant gliomas. CD133 positive cells may have properties essential for tumor initiation, persistence, recurrence and causing resistant to chemo and radiotherapy but its function is not completely known. It has been reported that CD133 can be used as a prognostic biomarker for poor survival and low-grade gliomas progression to higher grade. The glioma database TCGA shows that in Glioblastoma multiformae there is increased higher expression of CD133 in comparison to low-grade glioma. Therefore, determining the cell surface markers of CSCs, such as CD133, has been shown to improve the effectiveness of brain cancer diagnosis and treatment.
Tissue Microarray (TMA) block formation
A total of 128 glioma patients were used to create Tissue Microarrays (TMAs). Areas with the best representation of tumor morphology were marked on hematoxylin and eosin slides after they had been analyzed. The paraffin blocks were then transplanted into a recipient paraffin block using a single 3 mm punch that was removed from the respective areas.
Eight samples were included in each block, with one control (top right corner). A total of 16 microarray blocks were made for 128 samples.
Optimization of antibodies
Prior to the ultimate immunohistochemical staining of all the glioma samples using CD133, SOX2, and CD133 antibodies, optimization was carried out by adjusting the dilution and antigen retrieval times in order to obtain the best staining signal, that is, a clear stain with the highest intensity and the least amount of background staining.
Immunohistochemical staining
Each TMA block was divided into three parts, each 5 μm thick. To test for CD133, the sections were exposed to a 500-fold diluted anti- CD 133 antibody (clone 7971, Miltenyi Biotec, Germany) for 90 minutes at 25 hours Celsius. The sections were examined for SOX 2 for one hour at room temperature using a 500-fold diluted anti-SOX2 antibody (clone SP 76, Vitro China). A 1000-times-diluted anti-CD133 antibody (clone 10C2, Vitro China) was applied to the sections for a one-hour reaction at room temperature. Using 0.01 mol/L citrate buffer (pH 6.0) and 0.1% Tween 20, the sections were autoclaved for 10 minutes at 121°C to recover the antigen.
Evaluation of immunohistochemical staining
The IHC slides were examined under a microscope to determine the levels of CD133, SOX2, and CD133 expression in various glioma grades. When tumor cells exhibited membrane immunoreactivity, nuclear staining for SOX2, and cytoplasmic immunostaining for CD133, they were deemed to be positive.
The Immuno Reactive Score (IRS) is a semi-quantitative evaluation that is calculated by multiplying the staining intensity by the percentage of tumor cells that have been positively indicated. The proportion of cells that are positive is scored as:
[0] indicates no positive cells; [1] indicates less than 10%positive cells; [2] indicates 10-50% positive cells; [3] indicates 51-80% positive cells; and [4] indicates more than 80%positive cells. There are four staining intensity scores: [0] negative, [1] mild, [2] moderate, and [3] intense. The IRS value, which ranges from 0 to 12, is determined by multiplying the staining intensity score by the percentage of positive cells score. This range is interpreted as follows: 0-1 indicates zero staining, 2-3 weak staining, 4–8 indicates moderate staining, and 9–12 indicates strong staining.
Statistical analysis
SPSS software (version 25) has been used to observe and analyze data. A descriptive analysis has been carried out. When analyzing categorical data, the Chi-square test is utilized.
A P-value of 0.05 or less is regarded as significant. Age and other quantitative factors were measured using the range, mean, and standard deviation. Using the Chi-square test, the qualitative/ categorical variables were compared across the three staining categories and expressed as frequency and percentage.
Out of 128 glioma cases, 85 (66.4%) were in males and 43 (33.61%) in females, with a M: F ratio of almost 2:1. The mean age was 33.6 years (S.D. ± 17.06 years), with a range of 3 to 75 years. Of the total number of cases, 39 (30.5%) were at least 40 years old, and 89 (69.5%) were under 40.
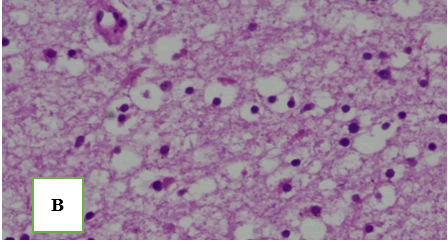
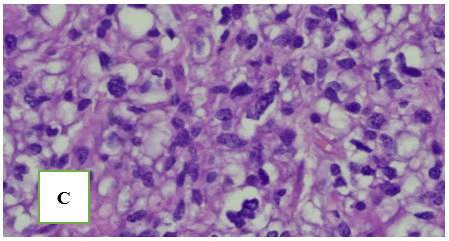
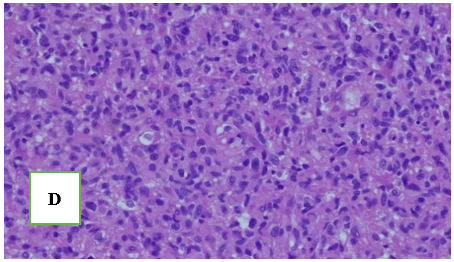
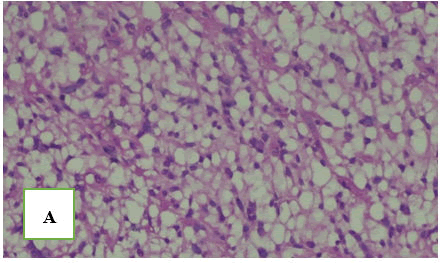
The 128 glioma specimens that were gathered were examined using representative H&E-stained sections. According to histological findings, glioma was categorized into four categories using the WHO grading system 6/128 (4.7%) cases were pilocytic astrocytoma grade 1; with low cellularity and no mitosis or necrosis, 26/128 (20.3%) cases diffuse astrocytoma grade 2, 32/128 (25%) cases oligodendroglioma grade 2; with moderate cellularity, pleomorphism and nuclear atypia, 16/128 (12.5%) cases anaplastic astrocytoma grade 3, 16/128 (12.5%) cases anaplastic oligodendroglioma grade 3; featuring high cellularity, nuclear atypia and brisk mitotic activity and 32/128 (25%) cases glioblastoma grade 4 featuring high cellularity, pleomorphism, brisk mitosis, microvascular proliferation and geographic necrosis (Figure 1).
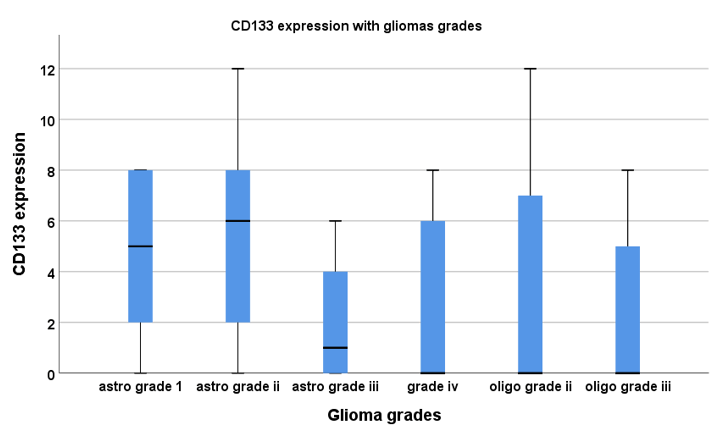
Figure 1. CD133 expression with gliomas grades.
The expression of CD133 manifested as brownish membrane staining. Glioma types and grades differed in their expression of CD133 (Table 1). 52/128 (40.6%) of the gliomas under study had CD133 expression; 33/128 (25.7%) had weak expression, 11/128 (8.5%) had moderate expression, and 8/128 (6.2%) had strong expression. CD133 expression was significantly correlated with tumor grade (p<0.0001) and histological type (p<0.0001). However, neither tumor size nor location, patient sex, or CD133 expression are statistically correlated (Table 1).
|
Clinico-pathological parameter |
No of cases |
CD133 expression |
P value |
|||
|
Negative IRS (76 cases) |
Weak IRS (33 cases) |
Moderate IRS (11 cases) |
Strong IRS (8 cases) |
|||
|
Gender |
||||||
|
Female |
43 (33.6%) |
28 (21.9%) |
10 (7.8%) |
4 (3.1%) |
1 (0.8%) |
0.243 |
|
Male |
85 (66.4%) |
48 (37.5%) |
23 (18.0%) |
7 (5.5%) |
7 (5.5%) |
|
|
Age |
||||||
|
<40 |
89 (69.5%) |
52 (40.6%) |
22 (17.2%) |
10 (7.8%) |
5 (3.9%) |
0.435 |
|
≥ 40 |
39 (30.5%) |
24 (18.8%) |
11 (8.6%) |
1 (0.8%) |
3 (2.3%) |
|
|
Location |
||||||
|
Corpus callosum |
7 (5.5%) |
5 (3.9%) |
1 (0.8%) |
1 (0.8%) |
0 (0.0%) |
0.154
|
|
Frontal |
34 (26.6%) |
24 (18.8%) |
8 (6.3%) |
1 (0.8%) |
1 (0.8%) |
|
|
Insular |
5 (3.9%) |
2 (1.6%) |
2 (1.6%) |
1 (0.8%) |
0 (0.0%) |
|
|
Midline |
13 (10.2%) |
9 (7.0%) |
2 (1.6%) |
1 (0.8%) |
1 (0.8%) |
|
|
Occipital |
19 (14.8%) |
8 (6.3%) |
5 (3.9%) |
1 (0.8%) |
5 (3.9%) |
|
|
Pariatal |
1 (0.8%) |
1 (0.8%) |
0 (0.0%) |
0 (0.0%) |
0 (0.0%) |
|
|
Parietal |
27 (21.1%) |
17 (13.3%) |
8 (6.3%) |
1 (0.8%) |
1 (0.8%) |
|
|
Temporal |
20 (15.6%) |
9 (7.0%) |
6 (4.7%) |
5 (3.9%) |
0 (0.0%) |
|
|
Thalamic |
2 (1.6%) |
1 (0.8%) |
1 (0.8%) |
0 (0.0%) |
0 (0.0%) |
|
|
Grade |
||||||
|
Astro grade i |
6 (4.7%) |
1 (0.8%) |
3 (2.3%) |
0 (0.0%) |
2 (1.6%) |
0
|
|
Astro grade ii |
26 (20.3%) |
3 (2.3%) |
12 (9.4%) |
5 (3.9%) |
6 (4.7%) |
|
|
Astro grade iii |
16 (12.5%) |
12 (9.4%) |
2 (1.6%) |
2 (1.6%) |
0 (0.0%) |
|
|
Grade iv |
32 (25.0%) |
24 (18.8%) |
6 (4.7%) |
2 (1.6%) |
0 (0.0%) |
|
|
Oligo grade ii |
32 (25.0%) |
23 (18.0%) |
7 (5.5%) |
2 (1.6%) |
0 (0.0%) |
|
|
Oligo grade iii |
16 (12.5%) |
13 (10.2%) |
3 (2.3%) |
0 (0.0%) |
0 (0.0%) |
|
|
Histologic type |
||||||
|
Astrocytoma |
32 (25.0%) |
4 (3.1%) |
15 (11.7%) |
5 (3.9%) |
8(6.3%) |
0
|
|
Oligodendroglioma |
37 (28.9%) |
27 (21.1%) |
8 (6.3%) |
2 (1.6%) |
0 (0.0%) |
|
|
Anaplastic astrocyto |
16 (12.5%) |
12 (9.4%) |
2 (1.6%) |
2 (1.6%) |
0 (0.0%) |
|
|
Anaplastic oligodend |
11 (8.5%) |
9 (11.8%) |
2 (1.6%) |
0 (0.0%) |
0 (0.0%) |
|
|
Glioblastoma |
30 (23.4%) |
22 (17.2%) |
6 (4.7%) |
2 (1.6%) |
0 (0.0%) |
|
|
Gliosarcoma |
2 (1.6%) |
2 (1.6%) |
0 (0.0%) |
0 (0.0%) |
0 (0.0%) |
|
|
Note: P-value was calculated by Chi-square test |
||||||
Table 1. Correlation between CD133 expression and the studied clinic opathological parameters.
Malignant gliomas are known for their high recurrence rates, even after undergoing surgery, chemotherapy, radiotherapy, and immunotherapy. While ionizing radiation remains the most effective treatment for gliomas, its therapeutic role is palliative due to the tumor's inherent radioresistance. Over the past few decades, treatment strategies for gliomas have seen limited advancements, primarily due to an incomplete understanding of the disease's biology. Recent data indicates that Tumor Stem Cells (TSCs) and normal stem cells have many characteristics, such as the ability to self-renew and differentiate, the expression of certain markers, and the signaling pathways that control survival and proliferation. While TSCs have been effectively isolated and identified in tumors, little is known about their marker expression in solid brain tumors, especially when it comes to different malignant grades.
In order to fill this knowledge gap, this work assessed the expression of the TSC marker CD133, which is a well-known indicator for Neural Stem Cells (NSCs) and a crucial instrument for comprehending TSC biology. Although CD133/prominin is frequently expressed in a variety of stem cell types and malignancies, it is usually downregulated in differentiated cells. It was first discovered on neuroepithelial stem cells in mice. Although there isn't any concrete experimental proof, its location in membrane protrusions raises the possibility that it plays a part in cell polarity, migration, and interactions with other cells and the extracellular matrix.
Although its exact function in stem cell self-renewal and differentiation is unknown, CD133 may play a major role in the development of cancer. Notably, Dagmar et al. earlier found that CD133 expression was associated with a poor outcome in high-grade gliomas, indicating its potential prognostic usefulness in these cancers.
This investigation examined the expression of CD133 in 128 glioma specimens and evaluated its correlation with clinicopathological variables, such as age, sex, tumor site, size, histological type, and tumor grade. Of gliomas, CD133 expression was found in about 40.6% (52/128). Strong expression was observed in astrocytomas among these, with 1.6% (2/128) in grade 1 and 4.7% (6/128) in grade 2 instances, with 6.2% (8/128) showing the most pronounced expression. 8.5% (11/128) of tumors had moderate expression, including oligodendrogliomas (1.6%, 2/128), anaplastic astrocytomas (1.6%, 2/128), glioblastomas (1.6%, 2/128), and pilocytic astrocytomas (3.9%, 5/128). The tumors that showed poor expression included glioblastomas (17.2%, 22/128), oligodendrogliomas (21.1%, 27/128), anaplastic oligodendrogliomas (9.4%, 12/128), pilocytic astrocytomas (3.1%, 4/128), and gliosarcomas. These findings reinforce the clinical relevance of CD133 in glioma progression and prognosis (Table 2).
| Grade 1 |
|
| Grade 2 |
|
| Grade 3 |
|
| Grade 4 |
|
Table 2. Grades 1-4.
Correlation of CD133 expression with gender
There was no discernible correlation between CD133 expression and gender (p=0.243). The majority of CD133-positive cases were in men, which is in line with the higher frequency of gliomas in males, frequency of gliomas in males. Although the exact causes of gender disparities in glioma incidence are yet unknown, hormonal, genetic, or environmental variables may be involved. The absence of a significant correlation suggests that while gender may influence glioma susceptibility, it does not independently determine CD133 expression levels (Table 3).
| Staining | CD133 |
| No staining | 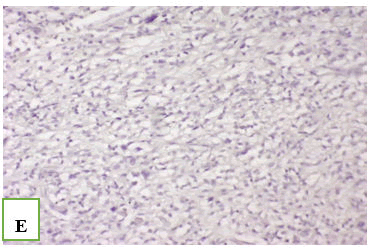 |
| Weak staining | 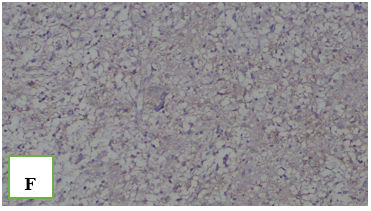 |
| Moderate staining | 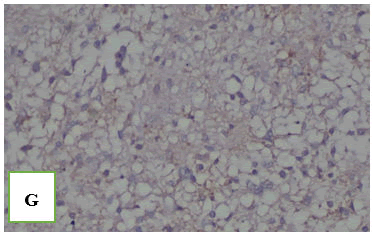 |
| Strong staining | 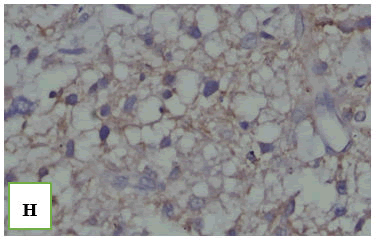 |
Table 3. Staining and CD133.
Correlation of CD133 expression with age
The expression of CD133 did not significantly correlate with age (p=0.435). Older patients showed relatively lower rates of weak and moderate expression, while younger patients (less than 40 years old) had higher levels. Gliomas in younger patients may have different genetic profiles, such as greater rates of IDH1/2 mutations, which could affect CD133 production, according to earlier research. However, the non-significant correlation implies that CD133 expression in gliomas is not age-dependent.
Correlation of CD133 expression with tumor location
Despite the lack of statistical significance between tumor site and CD133 expression (p=0.154), certain noteworthy trends were observed. The frontal (26.6%), occipital (14.8%), and parietal (21.1%) gliomas had the highest expression. Furthermore, a 2020 study conducted by Qingping Zhang revealed no association between CD133 and age, gender, or site. However, previous studies have shown that CD133 and clinico-pathological factors, like site, are statistically correlated. There may be inconsistent results about the link or lack thereof between CD133 expression and clinicopathological factors due to the small number of patients and the CD133 expression criteria (moderate to strong staining of tumor cells ranges between >0% and >70%). The differences in results may potentially be explained by the possibility that distinct CD133 antibody clones can distinguish between several CD133 splice variants with delicate epitopes of various glycosylation statuses. The presence of neural stem cell niches, vascularization, or variations in the microenvironment may cause CD133-positive gliomas in certain areas to behave differently biologically. The molecular underpinnings of CD133 expression in particular brain areas should be investigated in future research.
Correlation of CD133 expression with tumor grade
The expression of cd133 and tumor grade were shown to be significantly correlated (p<0.001). The highest levels of CD133 expression were seen in high-grade gliomas, especially glioblastomas (grade IV). This is consistent with earlier research showing that CD133 is a sign of tumor aggressiveness linked to enhanced invasion, proliferation, and treatment resistance.
• Low-grade gliomas (grades I and II) showed mostly mild to moderate CD133 expression, which is in line with their less combative disposition.
• High-grade gliomas (grades III and IV) demonstrated higher amounts of CD133, including glioblastomas, suggesting a link to greater malignancy.
Glioblastomas' high expression of CD133 confirms its function in preserving cancer stem cell populations, which promotes recurrence and a poor prognosis.
Correlation of CD133 expression with histological type
There were substantial differences in CD133 expression between histological subtypes (p<0.001). The most expressed tumors were glioblastomas and anaplastic astrocytomas. This pattern supports the notion that CD133 is linked to aggressive tumor characteristics. On the other hand, oligodendrogliomas and anaplastic oligodendrogliomas showed reduced expression levels. These discrepancies might be a result of underlying genetic and epigenetic differences amongst glioma subtypes. For example, oligodendrogliomas' 1p/19q co-deletion status is frequently linked to a better prognosis.
The results demonstrate CD133's capacity to inform clinical judgments and support its applicability as a biomarker for glioma aggressiveness. Although age and gender don't seem to have anything to do with CD133 expression, the fact that it is strongly correlated with tumor grade and histology highlights its biological and clinical importance. Future studies that concentrate on the molecular pathways connected to CD133 and CSCs may open the door to new treatment approaches.
The capacity to assess the predictive importance of CD133 expression in glioma patients is limited by the absence of longitudinal survival data. Furthermore, statistical power may have been impacted by the limited sample size for some clinicopathological factors, such as particular tumor sites.
Examining CD133 expression in a wide number of cases, various glioma types, and surgical resection margins.
To ascertain the significance of these findings, prospective studies with adequate power should be conducted. Patient follow-up and sufficient data regarding treatment response should be obtained to highlight the relationship between CD133 expression and overall patient survival and disease outcome.
Investigating how CD133 expression changes in relation to other CSC markers (like CD133) in order to elucidate their function in glioma carcinogenesis.
[Crossref] [Google Scholar] [PubMed]
[Crossref] [Google Scholar] [PubMed]
[Crossref] [Google Scholar] [PubMed]
[Crossref] [Google Scholar] [PubMed]
[Crossref] [Google Scholar] [PubMed]
[Crossref] [Google Scholar] [PubMed]
[Crossref] [Google Scholar] [PubMed]
[Crossref] [Google Scholar] [PubMed]
Journal of Brain Research received 2 citations as per Google Scholar report




 ;
;