Research Article - (2026) Volume 15, Issue 1
Received: 24-Oct-2024, Manuscript No. IDSE-25-150869;
Editor assigned: 28-Oct-2024, Pre QC No. IDSE-25-150869 (PQ);
Reviewed: 11-Nov-2024, QC No. IDSE-25-150869;
Revised: 14-Feb-2025, Manuscript No. IDSE-25-150869 (R);
Published:
21-Feb-2025
, DOI: 10.37421/2168-9768.2026.15.473
Citation: Hussen, Ahmed Mohammed. "Hoha Small-Scale Irrigation Scheme Evaluation Using Internal Performance Indicators in Assosa
District, Benishangul Gumuz Regional State, Ethiopia." Irrigat Drainage Sys Eng 14 (2026): 473.
Copyright: © 2026 Hussen AM. This is an open-access article distributed under the terms of the creative commons attribution license which permits unrestricted use, distribution and reproduction in any medium, provided the original author and source are credited.
Expanding efficient irrigation systems across various scales is one of the best approaches for ensuring reliable and sustainable food security. However, many irrigation schemes in developing countries, particularly in Ethiopia, are underperforming compared to their design capacity. This research, conducted in Assosa Woreda, Benishangul Gumuz regional state, focused on evaluating the Hoha small-scale irrigation scheme's performance using internal indicators. Field water management was assessed based on primary and secondary data. Water flow rates in the main and tertiary canals were measured using the float method and a 3-inch Parshall flume.
The analysis of internal performance indicators such as conveyance efficiency, application efficiency, storage efficiency, distribution uniformity, and deep percolation ratio was performed at the head, middle, and tail sections of the irrigation system. The results showed that the Hoha irrigation scheme's conveyance efficiency was 48.40%, indicating room for improvement in water conveyance. Application efficiency was found to be 57.28%, while storage efficiency was 88.39%. Distribution uniformity and deep percolation ratios were 92.33% and 41.7%, respectively. Overall irrigation efficiency was 27.72%, which is below the desired level. These results suggest a need for significant improvements to enhance the scheme’s overall performance.
Hoha irrigation scheme • On-field water management • Performance indicators • Irrigation efficiency
Effective management of irrigation systems is essential for achieving sustainable agricultural practices and improving food security. Optimizing water usage and distribution through technologies like precision irrigation allows farmers to cultivate crops efficiently, even in arid regions. Smart monitoring systems that track water usage, soil moisture levels, and crop health can further enhance decisionmaking, leading to increased productivity [1].
Ethiopia, with its vast arable land estimated to range between 1.5 and 4.3 million hectares, holds significant promise for agricultural development. This potential offers opportunities for sustainable farming practices, crop diversification, and increased productivity, contributing to the country’s food security and economic development [2].
However, approximately 230,000 hectares of irrigated land have been lost in Ethiopia due to underperforming irrigation schemes. Small-scale irrigation systems, which account for about 90% of the performance gap, play a critical role in this issue [3]. Improving the performance of these schemes is vital for maximizing their potential. Issues such as canal leakage can be addressed by using modern lining materials or proper maintenance techniques. Moreover, enhancing agronomic and water management practices through farmer training programs on efficient water usage or implementing regular maintenance schedules can significantly improve the schemes' performance [4].
An estimated 40% or more of the water diverted for irrigation at the farm level is lost through deep percolation or surface runoff [5]. This inefficient use of water highlights the need for benchmarking and evaluating small-scale irrigation schemes. This study focuses on assessing the performance of the Hoha small-scale irrigation scheme in the Assosa district of the Benishangul Gumuz regional state.
Description of the study area
The study was conducted in Assosa Woreda, located in the Benishangul Gumuz regional state of Ethiopia, within the Upper Blue Nile River Basin. The Hoha small-scale irrigation scheme is situated in Amba 01 Kebele, about 12 kilometers northwest of the regional capital, Assosa. Geographically, the scheme is positioned between 9° 49' 10" and 10° 04' 15" N latitude and 34° 15' 00" and 34° 25' 20" E longitude. The area spans an altitude range of 1300 to 1580 meters above sea level and covers approximately 200 hectares of irrigated land, with the aim of enhancing agricultural productivity and contributing to sustainable development in the region [6].
The agro-climatic zone is classified as low to warm, with a single rainy season extending from May to October. Peak rainfall occurs from June to October, and irrigation is required during the dry season, which runs from mid-December to the end of May when evaporation rates surpass rainfall. For example, in September, the area receives a mean maximum rainfall of 211.2 mm, whereas January records only 0.7 mm of rainfall. The average annual temperature in the area is 27.9°C, with a minimum local temperature of 15°C, indicating a relatively warm climate [7].
Data collection and analysis
The data collection for this study was conducted from January to May 2021/22, during the dry season when crops were cultivated under the Hoha irrigation scheme. Primary data were obtained through field measurements and observations, while secondary data were gathered from Assosa meteorological station reports and relevant research publications [8].
Soil data:
Soil texture and bulk density: Twelve composite soil samples were collected using a soil auger from different points along the diagonal of selected fields (head, middle, and tail sections). The hydrometer method was employed to analyze particle size distribution, and soil texture was classified using the USDA textural triangle [9].
Undisturbed soil samples were collected at 30 cm intervals up to a depth of 120 cm using a core sampler of known volume. Bulk density was determined using:
B=Dry weight of soil (g)/Volume of the core sample (cm3)
Where: BD: Bulk-Density of soil (g/cm3)
Field capacity and permanent wilting point: Soil samples for determining Field Capacity (FC) and Permanent Wilting Point (PWP) were collected from the same depths. A pressure plate apparatus was used at suction pressures of 1/3 bar and 15 bar to determine FC and PWP, respectively [10]. The Total Available Water (TAW) was calculated as:

Where: TAW: Total Available Water (mm)
ΘFC: Field capacity volumetric moisture content
ΘPWP: Volumetric moisture content at the permanent wilting point
Zr: Root zone depth (m)
10: Conversion factor from meters to millimeters
Gravimetric soil moisture content: Soil moisture content was determined using the gravimetric method [11]. Soil samples were weighed before and after oven drying, and volumetric moisture content (Θv) was calculated using:
Θv=Θm × BD/γw
Where: Θv: Moisture content on a volume basis (%)
Θm: Gravimetric moisture content (%)
γw: Unit weight of water (1 g/cm³)
Flow rate measurement:
The flow rate was measured using a 3-inch Parshall flume and the velocity area method at the head, middle, and tail of the irrigation system during irrigation events. The Parshall flume was installed at the entrance of the selected fields. The discharge rate in the canal was determined using the velocity area method [12]. The flow velocity in the main and tertiary canals was determined using floating methods. Finally, the discharge rate was calculated using the continuity equation:
Q=A × V
Where: Q: Discharge rate (m3/s)
A: Wetted cross-sectional area (m2)
V: Average flow speed (m/s)
However, the average flow velocity was multiplied by a correction factor of 0.85 for rough or rocky bottoms and 0.9 for smooth, muddy, sandy, or smooth bedrock conditions as illustrated by Harrelson et al.
Internal performance indicators
Conveyance efficiency: The efficiency of conveyance and losses in the main and tertiary canals were measured using the float method and the Par-shall flume, respectively. Inflow and outflow were measured at six points in the main canals, with an interval of 100 m for the head, middle, and tail. They were measured at the first and last locations of the canals. The average values of the inflow and outflow for each of the selected drains were used to calculate water conveyance losses and conveyance efficiency. To calculate the conveyance efficiency (Ec) at the chosen canal length, the following equation from Michael was utilized [13].
Ec=Qout/Qin ×100
Where: Ec: conveyance efficiency of the main and tertiary canal (%),
Qin: Inflow discharge measured at the first point (L/sec) and
Qout: Outflow discharge measured at the second point (L/sec).
Overall conveyance efficiency of the scheme was computed as:
Ecoverall=(Ecmain × Ectertiary)/100
The following equations were applied to the inflow-outflow method to calculate water loss due to conveyance [14].
Lc=Qin–Qout
Where: Lc=denotes the conveyance losses (L/sec) between the first and second points.
Application Efficiency (Ea): To calculate Application Efficiency (Ea) according to Michael, first determine the amount of water delivered to the field (Wf) and the depth of water stored in the root zone (Ws). This can be done using the following formula:
Wf (mm)=(T × Q)/A
Where: Wf is the depth of water used in the field (mm)
T is time elapsed during irrigation (se),
Q is water discharge on the field (m3/se), and
A is an area of the sample field (m2).
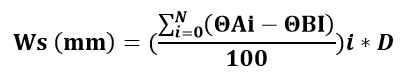
Where: ΘAI and ΘBI are the moisture content of the ith soil compartments after and before irrigation on an oven-dry volume basis (%), respectively,
Di is the thickness of ith soil compartments (mm), and
N is the number of compartments in the root zone.
Ea (%)=(Wf/Ws) × 100
Storage Efficiency (Es): To assess how well the applied water met the soil moisture deficit. To calculate the storage efficiency for water management in the root zone before irrigation, first determine the water required in the root zone before irrigation (Wn) [14]. This can be done by computing the following formula:
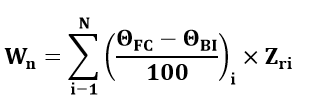
Where: ΘBI: ith layer of volumetric moisture content before irrigation (%)
ΘFC: ith layer of volumetric moisture content at field capacity (%),
Zri: effective root zone depth (mm),
N: denotes the number of soil layers in the Zri root zone, and
Wn: the water required in the root zone before irrigation (mm).
Es (%)=(Ws/Wn) × 100
Distribution uniformity: Is a crucial metric in irrigation systems to assess how uniformly water is distributed across a field. This process helps in identifying areas that may require modifications in irrigation methods, such as adjusting sprinkler heads or changing watering schedules, to ensure uniform moisture distribution and increase crop yield. For instance, by arranging the moisture data in descending order and then calculating the distribution uniformity using the specified equation.
DU=(Zlq/Zm) × 100
Where: DU: Distribution uniformity (%),
Zlq: the mean of the lower-quarter depth of water infiltrated (mm) and
Zm: The average depth of all infiltrated water in millimeters.
Deep Percolation Ratio (DPR): According to Henok, who cited Feyen and Dawit, the amount of deep percolation is determined by the following formula:
DPR=100-Ea-Runoff Ratio (RR)
Overall irrigation efficiency (E): The scheme irrigation efficiency is the product of field application efficiency and the conveyance efficiency of the distribution system. Numerically, it is evaluated using the following formula:
E=(Ec × Ea)/100
Physical properties of the Soil
The soil texture in the Hoha irrigation scheme was classified as clay across all sections. The bulk density values ranging from 1.06 to 1.09 g/cm3 in the Hoha scheme suggest an increase in soil compaction as depth increases. This can impact factors like root growth, water infiltration, and overall soil health within the irrigation scheme. To better manage soil compaction, practices like reduced tillage, cover cropping, and adding organic matter can be considered to improve soil structure and health [15].
The physical analysis of the Hoha scheme indicates that the soil's Field Capacity (FC) and Permanent Wilting Point (PWP) fall within the recommended range by the FAO. The average FC values at different locations in the scheme are 35.2%, 36.9%, and 34.3%, which align with the FAO's suggested range of 320–400 mm/m. Similarly, the PWP values of 21.4%, 22.5%, and 21.3% are within the FAO's range of 200–240 mm/m (Table 1).
| Soil properties | Head | Middle | Tail |
| Texture | Clay | Clay | Clay |
| Bulk density (g/cm³) | 1.09 | 1.06 | 1.06 |
| Field capacity (%) | 35.2 | 36.9 | 34.3 |
| Permanent wilting point (%) | 21.4 | 22.5 | 21.3 |
| Total available water (mm) | 178 | 182 | 166 |
Table 1. Selected soil physical characteristics of the Hoha irrigation scheme.
Furthermore, the Total Available Water (TAW) in the Hoha irrigation scheme was measured at average value 176 mm, which also fits well within the FAO's recommended range of 120–200 mm/ m. This alignment with FAO standards indicates that the soil in the Hoha scheme has a good capacity to retain water, providing optimal conditions for irrigation and plant growth [16].
Internal performance indicators
Conveyance efficiency: Conveyance efficiency in the Hoha irrigation scheme was found to be suboptimal due to the use of unlined canals and inadequate maintenance. The efficiency of the main canal was 83.3%, while that of the tertiary canal was 58.1%. The overall conveyance efficiency stood at 48.4%, falling below the FAO’s recommended 80% for earthen canals longer than 2000 meters in clay soil, as suggested by FAO. The Hoha irrigation scheme corroborates findings from a study by Alebachew and Singh, where the water distribution uniformity of the tertiary canal was reported as 56% [17].
Losses through the conveyance system are crucial to addressing the issues affecting the Hoha irrigation scheme, particularly focusing on the maintenance of the unlined main and tertiary canals. Prioritizing measures to control weeds, prevent unauthorized water diversion into field ditches, manage canal sedimentation, prevent cracking, regular maintenance and monitoring practices such as clearing weeds, regulating water usage, and reinforcing canal structures, the overall efficiency of the irrigation scheme can be improved, minimizing water losses and maximizing agricultural productivity in the area (Table 2).
|
Canal |
Conveyance efficiency (%) |
Conveyance losses (L/s/m) |
|
Main canal |
83.3 |
0.04 |
|
Tertiary canal |
58.1 |
0.04 |
|
Overall EC |
48.4 |
|
Table 2. Conveyance efficiency and losses.
In general, the recorded overall conveyance efficiency was significantly below the FAO recommended value for earthen canals, indicating substantial water losses due to seepage and other factors. Addressing these inefficiencies through lining or other improvement measures may be crucial to enhancing water conveyance efficiency within the scheme.
Application efficiency: Application efficiency decreased from the head to the tail of the scheme due to overwatering and inefficient scheduling as shown in Table 3. The average application efficiency was 57.28%, which is significantly lower than the optimal range indicates over-irrigation and water wastage, particularly in the middle and tail sections.
| Field canal section | Applied depth (mm) | Stored depth (mm) | Ea (%) |
| Head | 144.63 | 93.2 | 64.44 |
| Middle | 143.42 | 79.57 | 55.48 |
| Tail | 137.41 | 71.33 | 51.91 |
| Average application efficiency | 57.28 |
Table 3. Application efficiency.
The reported average application efficiencies of 50-90% by Rogers, et al. 50-60% by FAO, and 50-70% by FAO align with the findings in the current study, underlining a common issue of water wastage in irrigation systems. Addressing these inefficiencies through improved irrigation practices and scheduling could lead to better water conservation and more effective crop production.
Storage efficiency: Storage efficiency in the Hoha irrigation scheme was relatively high across all sections, with an average of 88.39% as presented in Table 4. This indicates effective water retention within the root zone, especially at the head of the system. In general, high storage efficiency suggests that most of the applied water was stored in the root zone, effectively replenishing soil moisture deficits.
The results from different studies indicate a wide range of irrigation efficiency percentages. For instance, Korkmaz and Avci found results ranging from 54%-97% in the Menemen Left Bank irrigation schemes. Meanwhile, Miniebel, reported a similar efficiency of 91.6% in Golda's small-scale irrigation scheme within the Hoha scheme. Additionally, according to FAO, under certain climate and soil conditions, storage efficiency in irrigation can even reach up to 90%. These examples display the variability in irrigation efficiency outcomes based on different factors.
| Field canal section | Required depth (mm) | Stored depth (mm) | Es (%) |
| Head | 99.68 | 93.2 | 93.3 |
| Middle | 93.06 | 79.57 | 85.38 |
| Tail | 82.45 | 71.33 | 86.51 |
| Average storage efficiency | 88.39 |
Table 4. Storage efficiency.
Distribution uniformity: Water distribution uniformity was high, with an average of 92.33% indicating uniform water application across the fields (Table 5). The minimum variation in water distribution ranging from 91.83% to 93.13% indicates a high level of uniformity. Proper leveling and management practices at the head contributed to this efficiency. The result has shown that high distribution uniformity which is attributed to well-leveled fields and proper irrigation practices at the head section [18].
| Field canal section | Mean stored depth (mm) | A least quarter of the mean stored water (mm) | Du (%) |
| Head | 84.41 | 78.61 | 93.13 |
| Middle | 74.01 | 68.11 | 92.03 |
| Tail | 57.78 | 53.06 | 91.83 |
| Average distribution efficiency (Du) | 92.33 |
Table 5. Distribution uniformity.
The different finding with similar results was distribution uniformity in various irrigation schemes. For instance, the Hoha irrigation scheme demonstrated a high level of uniformity, with over 90% similarity in water distribution patterns according to Henok, et al. and Tadesse, et al. Conversely, Dinka found lower uniformity in the Ketar irrigation system, with an average of 61.6% distribution uniformity, potentially leading to water inefficiency and uneven distribution across the field. This emphasizes the importance of well-designed irrigation schemes like the Hoha scheme to ensure efficient water distribution throughout the field.
Deep percolation ratio: The deep percolation ratio was found to be high, with an average of 42.72%, indicating significant water loss below the root zone (Table 6). The highest loss means that most of the irrigation water used is stored in the root zone of the soil rather than lost through deep percolation. This indicates significant water loss due to deep percolation, especially at the tail end of the system or 48.09%was recorded. This may due to over-irrigation and suggests a need for better irrigation scheduling and application techniques. According to FAO, water loss due to deep flow and water flow is about 40% or more [19].
|
Field canal section |
Application efficiency (Ea) |
RR |
DPR (%) |
|
Head |
64.44 |
0 |
35.56 |
|
Middle |
55.48 |
0 |
44.52 |
|
Tail |
51.91 |
0 |
48.09 |
|
Average DPR efficiency |
42.72 |
||
Table 6. Deep percolation ratio.
Understanding the specific water requirements and root zone depths of different crops in the scheme can help in optimizing irrigation practices. For instance, crops with shallow root systems may benefit from more frequent but shorter irrigation sessions to prevent excessive deep percolation. Implementing measures to improve soil structure and drainage can also aid in reducing waterlogging issues and minimizing percolation losses in the root zone. By tailoring irrigation practices based on crop needs and soil conditions, it's possible to enhance water use efficiency and mitigate deep percolation losses in the Hoha irrigation scheme.
Overall irrigation efficiency: The overall irrigation efficiency for the Hoha irrigation scheme was calculated at 27.72%, which is considered poor. This means that 27.72% of the water supplied to the irrigation scheme is effectively used for crop irrigation after considering both field application and conveyance efficiencies. This indicates that the low irrigation efficiency of 27.72% in the Hoha irrigation schemes suggests that there is room for improvement in water usage. The fact that the schemes are operating below their design capacity indicates inefficiencies in the system. For instance, this could be due to leaks in the irrigation network, poor water distribution, or inadequate maintenance. To enhance efficiency, addressing these issues and optimizing the irrigation infrastructure could significantly improve water usage and overall performance (Table 7).
| Internal indicators | Scheme efficiency (%) |
| Conveyance efficiency | 48.4 |
| Application efficiency | 57.28 |
| Storage efficiency | 88.39 |
| Distribution efficiency | 92.33 |
| Deep percolation ratio | 42.72 |
| Overall irrigation efficiency | 27.72 |
Table 7. Summary of internal performance indicators and overall efficiency.
The comparison between the irrigation schemes mentioned in the studies by Rai et al. [20]. While a scheme efficiency of 20-30% is considered poor, the results from the Hoha irrigation scheme and the Wosha and Werka irrigation schemes indicate a similar level of inefficiency, falling within the poor category. These findings highlight the need for improvements in irrigation practices to enhance water use efficiency and agricultural productivity in those areas.
The performance evaluation of the Hoha irrigation scheme revealed significant inefficiencies, particularly in conveyance, application, and overall irrigation efficiency. The poor performance can be attributed to unlined canals, poor irrigation scheduling, and excessive deep percolation losses. In conclusion the performance evaluation of the Hoha small-scale irrigation scheme revealed several inefficiencies mostly:
Low conveyance efficiency: Due to unlined canals and inadequate maintenance.
Reduced application efficiency: Resulting from over-irrigation and lack of proper scheduling.
High percolation losses: Indicating significant water wastage below the root zone.
Overall low irrigation efficiency: At 27.72%, far below the desired level.
Canal rehabilitation/lining: Lining the main and tertiary canals with suitable materials will reduce water losses by seepage and improve conveyance efficiency.
Regular maintenance: Establishing routine maintenance schedules and implementing routine cleaning and repair schedules can prevent weed growth, sedimentation, and cracking which will ensure that canals remain free of obstructions, sediment buildup, and unauthorized diversions.
Irrigation scheduling: Developing and enforcing proper irrigation schedules to users based on crop water requirements and soil moisture status can avoid water losses due to deep percolation.
Farmer training: Providing training to farmers on efficient water management practices, including proper irrigation scheduling (appropriate irrigation depths and intervals) can reduce over-irrigation and improve application efficiency.
Monitoring and evaluation: Establishing a monitoring system to regularly assess performance indicators and make data-driven decisions will sustain overall irrigation efficiency to its better standard.
Generally, implementing these recommendations will enhance water use efficiency, improve agricultural productivity, and contribute to the sustainability of the Hoha irrigation scheme.
The authors express their sincere gratitude to the Natural Resource Management Research Directorate of the Ethiopian Institute of Agricultural Research for providing financial support for this study. The authors also wish to thank the Assosa district Agricultural Office for their invaluable support throughout the research. Special thanks are extended to Dr. Tewodros Assefa for his constructive feedback and comments. The authors are also deeply appreciative of Miniebel Fentahun, Abraham Ybeyn, and Ayele Debebe for their valuable advice and assistance during fieldwork. Finally, my heartfelt thanks go to the Natural Resource Management Research staffs at Assosa for their help in collecting field data and my admiration to Mr. Habtamu Tamiru for his assistance in structuring and editing all contents of this paper to make it ready for publication.
Irrigation & Drainage Systems Engineering received 835 citations as per Google Scholar report


