Research Article - (2022) Volume 11, Issue 3
Received: 15-Mar-2022, Manuscript No. IJEMS-22-57237;
Editor assigned: 17-Mar-2022, Pre QC No. P-57237;
Reviewed: 20-Mar-2022, QC No. Q-57237;
Revised: 29-Mar-2022, Manuscript No. R-57237;
Published:
05-Apr-2022
, DOI: 10.37421/ 2162-6359.2022.11.629
Citation: Zarmina, Ali Khan and Arshad Hassan. “Evaluation of Risk Modelling in Emerging Equity Markets through the Lens of Extreme Value Theory.” Int J Econ Manag Sci 11 (2022): 629. DOI: 10.37421/2162-6359.2022.11.629.
Copyright: © 2022 Khan ZA, et al. This is an open-access article distributed under the terms of the Creative Commons Attribution License, which permits unrestricted use, distribution, and reproduction in any medium, provided the original author and source are credited.
Purpose: This study analyse the asymptotic behavior of the tails of the return distributions in emerging markets through the lens of extreme value theory. It estimates and compares efficacy of the EVT based value at risk in emerging markets like Brazil(Bo Vespa), Russia(MOEX), India(Nifty 50), Bahrain(Share BAX), China(Shanghai), Colombia(COLCAP), Malaysia(FTSE), Thailand(SET INDEX), Argentina(Marvel), Bangladesh(Dhaka Stock Exchange), Pakistan(KSE 100) and Sri Lanka(CSE)) by using daily data for the period 2000-2018.
Methodology: The study employs block maxima model (BMM) based on generalized extreme value distribution (GEV) and peak over threshold model (POTM) based on generalized Pareto distribution (GPD). Peak over threshold model is applied under the assumption of unconditional and conditional volatility. Use of conditional EVT to estimate VaR is proposed by McNeil and Frey (2000) to capture the heteroscedasticity in extreme returns arising from stochastic volatility. Finally, the efficacy of models is evaluated through backtesting techniques proposed by Kupiec (1995) and Christoffersen (1998).
Findings: The Block maxima model underestimates risk whereas condition POT model overestimates risk at 95% and 99% confidence level. EVT based unconditional POT model performs better in comparison to the GEV based block maxima model and EVT based conditional POT model in all selected countries of emerging markets. The results are consistent under various backtesting approaches as the performance of the model does not change with an increase in confidence level. The difference of risk may be the outcome of role of equity markets in a country, levels of disclosure, governance laws and ownership structure.
Value: This study has important implication for portfolio managers in making the decision regarding resource allocation, portfolio diversification and risk management as EVT based unconditional POT model can be used for modeling risk of extreme events in emerging markets.
Value-at-risk (VaR) • Extreme value theory (EVT) • Backtesting • Risk forecasting • Emerging markets • Corporate finance system
The financial risk modeling is an integral part of risk management. Value at risk is the most commonly used measure for estimation of market risk. It quantifies the maximum loss of an asset that may occur over a given period at a specific confidence level [1]. The main concern in estimating the value at risk is the appropriate assumption about the distribution of returns, that generally exhibit well-known stylized characteristics such as; fat tails, non-normality, asymmetric conditional volatility and volatility clustering [2]. Manganelli and Engle [3] state that the main difference among VaR models is in reliably unfolding of the distribution of returns. Therefore, the main challenge is selecting an appropriate distribution of returns to capture the time-varying conditional volatility of future return.
The VaR models are conventionally used under the various distributional assumptions like gaussian distribution and other distributions include Student-t distribution and GARCH processes. During the last two decades, financial markets have seen many downfalls in the form of the global financial crisis, the Russian financial crisis, Chinese market crash. The expanding instability in the global financial markets makes it necessary to assess the risk associated with extreme events.
An extensive treatment in finance underscores the importance of rare events in risk management which may result in extreme movement in prices or unexpected boom or bust in stock markets. Therefore, in order to model market risk, it is desireable to address the issue of heavy tails of distributions. In response, VaR measures based on the Extreme Value Theory (EVT) have been developed, which allows us to module the tails of distributions and to estimate the probabilities of the extreme movements that can be expected in financial markets. The idea behind extreme value theory is that tail distribution should independently be examined to assess the extreme loss.
Most of the literature on the measurement of EVT based VaR is primarily focused on developed markets of Europe and the United States. Research on the estimation of quantile extremes in emerging equity markets is still limited. Especially, the literature on the comparison of VaR models and their preductive performance on the basis of fitness for use across different emerging markets is rare. It is generally believed that emerging market exhibit higher risk. The general perception to exhibit higher risk in emerging markets appears to be correct as these markets are exposed to additional risks arising from fragile financial system, exchange rate fluctuations, macroeconomic and political uncertainties cross border capital flows and less mature capital markets.
The extant literature provides substantial evidence of use of GARCH family models to estimate the VaR in stock markets and currency markets under different distributional assumption like Gaussian distribution, Student-t distribution and generalized errors distribution [4-9]. However, generalized errors distribution (GED) is considered weak in capturing the asymmetry in financial returns and thus resulting in biased estimates of VaR [10]. Giot and Laurent [11] and Diamandis, et al. [12] add the asymmetric distributional assumption in the returns of developed and emerging equity markets and conclude that VaR models based on asymmetric distributions have a better predictive performance in comparison to VaR models based on symmetric distributions. Similarly, the tail behavior of equity returns has been discussed in individual markets and regions [13].
The increasing financial uncertainties have challenged the financial market participants to develop and improve the existing methodologies used in measuring risk these recent extreme market conditions raise a question on existing risk management models. This criticism on models provides an opportunity to explore the phenomenon through different theoretical framework especially through the lens of models that can deal with the rare events that create disasters [14]. Extreme value theory (EVT) provides a set of robust tools for modeling the behavior of extreme and catastrophic outcomes that fall in the tails of empirical distributions. Numerous studies exhibit the potential of EVT to estimate the extreme quantiles of the distribution of returns in the stock and currency exchange markets using the maximum blocks based on generalized extreme values (GEV) distributions [15-22]. The peaks over thresholds (POT) represents another alternative that allows the treatment of extreme risk in the tails of distribution; this approach’s cornerstone is the generalized Pareto distribution (GPD). Studies based on the assumption of GPD conclude that VaR models based on the unconditional EVT outperform conventional parametric models in the estimation of VaR, particularly in the extreme quantiles [23,24]. In contrast, Kittiakarasakun and Tse [25] provide empirical evidence that VaR-GARCH models achieve greater predictive performance than the EVT-Static VaR models in the stock markets of Asia. These studies argue that main drawback of the unconditional EVT stems from its incapability of capturing the impact of unexpected changes in market conditions on the estimation of VaR, besides the assumption that returns are identically and independently distributed (i.i.d.), which is not valid in modern financial markets. To overcome this problem, McNeil and Frey [26] propose the use of conditional EVT to estimate VaR in two stages. The first stage consists of the adjustment of a GARCH model to estimate the conditional volatility and filter the series of returns to obtain a standardized series of i.i.d. residuals. In the second stage, conditional EVT is applied to the distribution of standardized residuals to capture the heteroscedasticity in extreme returns arising from stochastic volatility.
Mogel and Auer [33] compare EVT based approaches for univariate VaR prediction in stock, commodity, bond and currency markets and provide guidance for choosing the appropriate estimation strategy in practice. The study recommends that the Box-Cox method is the most promising unconditional approach followed by historical simulation. For conditional setting, the historical simulation took the lead before the peak over threshold method indicating that return filtering had a stronger positive effect on historical simulation than on the EVT-based approaches. The objective of this study is to bridge the above gap through examining the tail behavior of the returns in emerging markets using extreme value theory. Specifically, the first objective of this study is to explore the applicability of EVT in emerging market and the second is to compare the performance of EVT based models to identify the methods that are appropriate to assess emerging market risks. Furthermore, it accounts for the time-varying volatility, asymmetric effects and heavy tails in return distribution and combines GARCH based model with EVT which is likely to generate more accurate quantile estimates for forecasting VaR. Finally, the out-of-sample predictive performance of the competing models is assessed through dynamic backtesting using the Kupiec’s point of failure test and Christofferson’s independence test.
The extreme value theory employs two main approaches; Block Maxima Model (BMM) based on generalized extreme value distribution (GEV) and peak over threshold model (POTM) based on generalized Pareto distribution (GPD).
This block maxima model selects the maximum value from the sample of normally distributed return. The term M is the maximum value from the sample size T. Fisher-Tippett-Gnedenko theorem states that, like constants are as well as some non-degenerate distribution function H is in the following form:
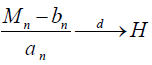
Here, the value of H may relate to any of these distributions:
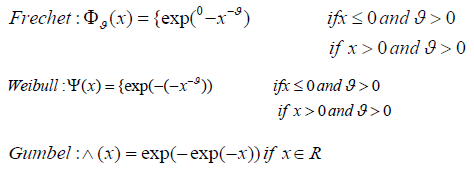
According to the theorem, M may follow any of the following distribution of Frechet, a Weibull or a Gumbel. If the value for ξ =0, it means the distribution is Gumbel. Whereas, if ξ <0, the shape is from Weibull distribution. Similarly, if ξ>0 means positive, the distribution is Frechet. The distribution is given below:
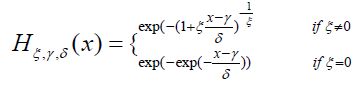
For 1+ ξ (x-γ)/δ > 0, the location and scale parameters are represented by γ and δ, which represents the limiting distribution of the extreme maxima.
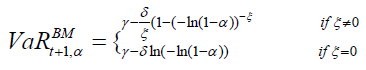
The following results can be obtained by inverting the equation with any respective confidence level α i.e:
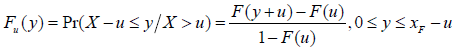
The second method of extreme events is based on exceedances over the threshold, called a peak over a threshold that is fitted to the exceeded distribution from GPD. This method has an advantage over BMM, as it uses available data more efficiently. The generalized Pareto distribution uses the function of exceedances as:
Then generalized Pareto distribution is as under:
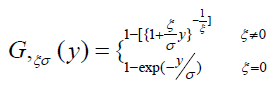
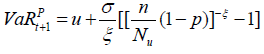
Here, ξ is the shape parameter and σ is the scale parameter. If ξ >0, the distribution is heavy-tailed distribution, if ξ = 0, the distribution is lighttailed and if ξ <0 the distribution is a short-tailed Pareto type II distributions. Generally, all financial data streams are heavy-tailed [18]. Therefore, VaR under generalized Pareto distributions can be estimated as under:
Finally, backtesting is the generalized method used to test the accuracy of the model. The back-testing technique compares the expectation of losses with the actual loss. Violation ratio is used to compare the expected number of violations with actual VaR. It is the conventional method of backtesting the accuracy of forecasting models. The ideal value for violations ratio is 1, which states that the number of expected violations is equal to the number of observed violations. But in financial data, it is not always possible to get exactly 1. Danielson [28] suggest that violation ratio between 0.8-1.2 may be used as a rule of thumb for the efficacy of the model.
Another technique of backtesting, the Kupiec POF test, is introduced in 1995 to investigate the degree of failure. This test uses the binomial distribution approach. The test estimates the exceptions by comparing it with the likelihood ratio. The LR suggests that whether the probability of exception matched with the probability P, at defined confidence level. The model said to be accepted or may provide true forecasting of risk if the LR is less than χ2 value of 1 degree of freedom.
The POF test statistic is
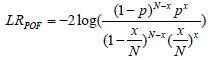
Where N is the number of observations and x is the number of times a model failed. It is assumed that, if the chi-square value does not exceed a critical value, the null hypothesis is accepted which states that model did true forecasting of risk. Similarly, the Christoffersen’s interval test is introduced in 1998 to test the clustering effect. It tests the dependence of events between connected days. The independence test is:
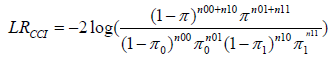
In the above equation, the n00, n01, n10, n11 represent the sequence of failure and /or no failure. The null hypothesis assumes no clustering, means the probability of violation of tomorrow does not depend on today’s violation.
The sample of the study consists of daily closing indices of twelve emerging markets for the period of 1/2000 to 12/2018. The emerging market includes Brazil (Bo Vespa), Russia (MOEX), India (Nifty 50), Bahrain (Share BAX), China (Shanghai), Colombia (COLCAP), Malaysia (FTSE), Thailand (SET INDEX), Argentina (Marvel), Bangladesh (Dhaka Stock Exchange), Pakistan (KSE 100) and Sri Lanka (CSE). The returns are calculated by taking the first difference of natural log of prices for each series,
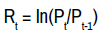
where Rt represents the returns earned in the day ” t,” Pt is the closing price of index at the time “t”, whereas Pt-1 is the closing price of index at time “t-1”
The statistical behavior of data is examined through descriptive statistics and results are reported in Table 1. The mean shows the average return earned by a market in aday. The maximum average return is earned by Pakistan (0.0007) followed by Sri Lanka and Russia with average return of (0.0006). Bourses of Pakistan, Russia, Sri Lanka, Brazil and India outperforms the exception of the Bangladeshi market which is riskiest market followed by Argentina and Russia. Low-risk markets include Bahrain, Malaysia and Thailand the returns are negatively skewed for all markets except for Bangladesh and Sri Lanka. The kurtosis exhibits leptokurtic behavior which is an indicator of fat tails distribution and non-normality of data. The maximum and minimum return also signals the presence of extreme events in relevant markets. The relationship of risk and return is inefficient in these markets, as the more risky stock is not able to gain highest returns (Table 1).
| Mean | S.D | Minimum | Maximum | Kurtosis | Skewness | |
|---|---|---|---|---|---|---|
| Emerging Countries | ||||||
| Argentina | 0.0010 | 0.0215 | -0.1295 | 0.1612 | 7.1253 | -0.1759 |
| Bahrain | -0.0001 | 0.0046 | -0.0284 | 0.0275 | 7.2915 | -0.2790 |
| Bangladesh | 0.0002 | 0.0353 | -0.5280 | 0.5346 | 207.6837 | 0.1429 |
| Brazil | 0.0004 | 0.0175 | -0.1210 | 0.1368 | 7.2788 | -0.1156 |
| China | 0.0001 | 0.0158 | -0.0926 | 0.0940 | 7.8236 | -0.3509 |
| Columbia | 0.0002 | 0.0105 | -0.0892 | 0.0873 | 11.2277 | -0.3671 |
| India | 0.0004 | 0.0145 | -0.1305 | 0.1633 | 12.1150 | -0.3059 |
| Malaysia | 0.0001 | 0.0057 | -0.0324 | 0.0332 | 5.9575 | -0.4025 |
| Pakistan | 0.0007 | 0.0134 | -0.0774 | 0.0851 | 6.7934 | -0.2660 |
| Russia | 0.0006 | 0.0203 | -0.2066 | 0.2523 | 18.6933 | -0.2384 |
| Srilanka | 0.0006 | 0.0112 | -0.1389 | 0.1829 | 38.7617 | 0.3352 |
| Thailand | 0.0003 | 0.0095 | -0.0581 | 0.0575 | 7.8252 | -0.3256 |
The focus of extreme value theory is to analyze the extreme outcomes. The block maxima approach under the assumption of generalized extreme value distribution and unconditional and conditional peak over threshold approach under the assumption of generalized Pareto distribution are applied to explore tail behavior. The VaR estimates for the long position are reported at 95% and 99% of confidence level.
Table 2 represents the BMM estimation of VaR, the comparison of expected with observed violations and selection of model with back testing techniques of violation ratio, Kupiec ratio and Christoffersen’s test.
| Countries | VaR | Expected Violations | Observed Violations | Violation Ratio | Kupiec-test | Christoffersen’s test | ||||||
|---|---|---|---|---|---|---|---|---|---|---|---|---|
| 95% | 99% | 95% | 99% | 95% | 99% | 95% | 99% | 95% | 99% | 95% | 99% | |
| Argentina | -9% | -14% | 209.5 | 41.9 | 7 | 0 | 0.03 | 0 | 367.42** | 74.71** | 15.54* | 13.13* |
| Bahrain | -2% | -3% | 93.15 | 18.63 | 2 | 0 | 0.02 | 0 | 171.41** | 29.55** | 8.74* | 11.51* |
| Bangladesh | -8% | -26% | 57.95 | 11.59 | 0 | 0 | 0 | 0 | 108.57** | 16.35** | 10.51* | 10.56* |
| Brazil | -7% | -9% | 210.8 | 42.15 | 15 | 4 | 0.07 | 0.09 | 321.54** | 57.79** | 3.96* | 8.29* |
| China | -7% | -11% | 214.1 | 42.81 | 11 | 0 | 0.05 | 0 | 355.54** | 77.47** | 12.79* | 13.21* |
| Columbia | -4% | -7% | 119.8 | 23.96 | 0 | 0 | 0 | 0 | 234.02** | 39.76** | 12.01* | 12.01* |
| India | -6% | -11% | 222.7 | 44.53 | 9 | 2 | 0.04 | 0.04 | 380.26** | 73.07** | 6.27* | 12.21* |
| Malaysia | -3% | -4% | 92.85 | 18.57 | 2 | 0 | 0.02 | 0 | 171.04** | 29.48** | 9.42* | 11.51* |
| Pakistan | -5% | -7% | 220.7 | 44.14 | 3 | 1 | 0.01 | 0.02 | 420.82** | 79.14** | 9.79* | 13.24* |
| Russia | -10% | -16% | 223.9 | 44.77 | 15 | 1 | 0.07 | 0.02 | 346.79** | 80.38** | 19.88* | 13.26* |
| Sri Lanka | -10% | -16% | 208.7 | 41.73 | 4 | 0 | 0.02 | 0 | 388.15** | 74.41** | 8.67* | 13.12* |
| Thailand | -4% | -6% | 81.5 | 16.3 | 3 | 0 | 0.04 | 0 | 141.20** | 25.18** | 7.81* | 11.25* |
The VaR estimates are higher for Argentina, Russia and Sri Lanka as 9% a day as compared with other emerging markets. Whereas, Bahrain and Malaysia exhibits minimum loss of 2% in a day, with 95% of confidence interval. The similar expectation of lass is noticed with 99% of confidence interval except for Bangladesh, as it reports 25% of higher risk reported in a day.
In the next phase, the original or observed number of violations in VaR estimates are reported and compared with the expected number of violations. The comparison shows that BMM expects more loss than actually happens in a market, but the reliability of these violations are checked in next column with violation ratios. The estimated violation ratio for all emerging markets are not in prescribed range of which is 0.8-1.2 [28]. Similarly, the modern back testing techniques like Kupiec and Christoffersen’s reliability test also prove the failure of BMM for VaR estimates, as none of the emerging markets likelihood ratio comes in range.
Peak over threshold Table 3 provides that Russia, Argentina, Brazil and China reported highest VaR estimates of 4%- 3% respectively in a day. The other emerging markets like Bahrain, Bangladesh, Columbia, Malaysia, Sri Lanka and Thailand reported 1% of expectation of loss in a day with 95% of confidence interval. The reported expectation of loss is different for 99% of confidence interval as Russia tends to be more risky market as 7% expectation of loss. Whereas, the minimum expectation of risk is more or less same as 95% of confidence interval.
| Countries | VaR | Expected Violations | Observed Violations | Violation Ratio | Kupiec-test | Christoffersen’s test | ||||||
|---|---|---|---|---|---|---|---|---|---|---|---|---|
| 95% | 99% | 95% | 99% | 95% | 99% | 95% | 99% | 95% | 99% | 95% | 99% | |
| Argentina | -3% | -6% | 209.5 | 41.9 | 199 | 35 | 0.95 | 0.93 | 0.56 | 0.21 | 22.55** | 12.62** |
| Bahrain | -1% | -1% | 93.15 | 18.63 | 83 | 14 | 0.89 | 0.75 | 1.2 | 1.27 | 6.13* | 8.48** |
| Bangladesh | -1% | -2% | 57.95 | 11.59 | 35 | 2 | 0.6 | 0.17 | 11.03 ** | 12.21** | 2.6 | 8.47** |
| Brazil | -3% | -5% | 210.8 | 42.14 | 203 | 40 | 0.96 | 0.95 | 0.3 | 0.11 | 19.0** | 7.51** |
| China | -3% | -6% | 214.1 | 42.81 | 123 | 24 | 0.57 | 0.56 | 0.01 | 10.36** | 19.16** | 0.49 |
| Columbia | -1% | -3% | 119.8 | 23.96 | 206 | 41 | 1.72 | 0.88 | 3118.34** | 6.06* | 22.43** | 3.58 |
| India | -2% | -4% | 222.7 | 44.53 | 162 | 32 | 0.73 | 0.72 | 2.09 | 0.73 | 49.55** | 7.0** |
| Malaysia | -1% | -1% | 92.85 | 18.57 | 250 | 60 | 2.69 | 3.23 | 0.05 | 0.02 | 11.05** | 1.74 |
| Pakistan | -2% | -4% | 220.7 | 44.14 | 197 | 38 | 0.89 | 0.86 | 0.67 | 0.23 | 107.99** | 29.8** |
| Russia | -4% | -7% | 223.9 | 44.77 | 132 | 27 | 0.59 | 0.6 | 3.02 | 1.86 | 41.99** | 26.89** |
| Sri Lanka | -1% | -3% | 208.7 | 41.73 | 226 | 47 | 1.08 | 1.13 | 0.27 | 0.04 | 153.10** | 47.89** |
| Thailand | -1% | -1% | 81.5 | 16.3 | 221 | 92 | 2.71 | 5.64 | 1.5 | 1.27 | 2.4 | 2.87 |
The next columns reports the expected violation of peak over threshold model with actual violations reported in emerging markets. The gap between the two violations are very minimum, which may favour the peak over threshold model. The completed analysis of model with 95% of confidence interval, the reported violation ratio are in provided range of 0.8 to 1.2 for Argentina, Bahrain, Brazil, Pakistan and Sri Lanka. The Kupiec Test also supports, the GPD static model as the likelihood ratio is less than 3.67 in all emerging markets except for Bangladesh and Columbia. To check the clustering effect, in most of the emerging markets, null hypothesis of no clustering is accepted.
The models results are more or less same with 99% confidence interval, the reported observed violations are less than the observed ones, but they are near to them. According to violation ratio and Kupiec test, this model estimate ideal VaR for Argentina, Brazil, Columbia, Pakistan and Sri Lanka. All emerging markets show the clustering effect except for the market of Columbia.
Finally, the two-step method reported in Table 4 is used to estimate VaR through residual of GARCH process. The VaR estimates are too small for almost all emerging markets at 95% and 99% confidence level. The maximum loss per day is reported by Argentina (0.2%), whereas the markets of Bahrain, India, Malaysia, Pakistan, Russia, Sri Lanka and Thailand reported 0.0% expectation of loss, meaning that these markets are free from risk, or does not possess any risk.
| Countries | VaR | Expected Violations | Observed Violations | Violation Ratio | Kupiec-test | Christoffersen’s test | ||||||
|---|---|---|---|---|---|---|---|---|---|---|---|---|
| 95% | 99% | 95% | 99% | 95% | 99% | 95% | 99% | 95% | 99% | 95% | 99% | |
| Argentina | -0.20% | -0.20% | 209.5 | 41.9 | 1651 | 1613 | 7.88 | 38.5 | 4534.33** | 9324.24** | 24.06** | 26.15** |
| Bahrain | 0.00% | 0.00% | 93.5 | 18.63 | 845 | 843 | 9.07 | 45.3 | 2590.72** | 5202.56** | 0.98 | 0.77 |
| Bangladesh | -0.10% | -0.10% | 57.95 | 11.59 | 503 | 509 | 8.68 | 43.9 | 1490.22** | 3086.67** | 46.99** | 46.04** |
| Brazil | -0.10% | -0.10% | 210.8 | 42.15 | 1838 | 1817 | 8.72 | 43.1 | 5450.86** | 10995.72** | 0.11 | 0.14 |
| China | -0.10% | 0.00% | 214.5 | 42.81 | 1921 | 1913 | 8.94 | 44.9 | 5809.19** | 5765.76** | 0.22 | 0.47 |
| Columbia | -0.10% | -0.10% | 119.8 | 23.96 | 1056 | 1048 | 8.81 | 43.7 | 3156.06** | 3118.34** | 11.09** | 12.34** |
| India | 0.00% | 0.00% | 222.7 | 44.53 | 1839 | 1816 | 8.26 | 40.8 | 5216.82** | 10740.14** | 25.36** | 0.12 |
| Malaysia | 0.00% | 0.00% | 92.85 | 18.57 | 820 | 818 | 8.83 | 44.1 | 2469.38** | 5023.24** | 4.428* | 17.08** |
| Pakistan | 0.00% | 0.00% | 220.7 | 44.14 | 1626 | 1605 | 7.37 | 36.4 | 4237.31** | 9092.05** | 95.44** | 93.42** |
| Russia | 0.00% | -0.10% | 223.9 | 44.77 | 1862 | 1825 | 8.32 | 40.8 | 5318.19** | 10799.91** | 17.88** | 19.75* |
| Sri Lanka | 0.00% | 0.00% | 208.7 | 41.73 | 1727 | 1712 | 8.28 | 41 | 4947.13** | 10192.09** | 162.16*** | 160.51*** |
| Thailand | 0.00% | 0.00% | 81.5 | 16.3 | 821 | 831 | 10.1 | 51 | 1909.18** | 3956.01** | 2.41 | 3.2 |
To check model reliability, the expected and observed violations are compared; the reported results show more difference between both of violations, which essence that GPD dynamic underestimate risk in all emerging markets. None of the violation ratio comes in prescribed range, which clearly questioned the authenticity of model. The results of Kupiec and Christoffersen’s test also conforms to results of violation ratio. Hence, the two step residual GARCH model may not provide the true forecasting of risk in these emerging markets.
A comparison of these models for estimation of VaR indicates that unconditional POT model is better for risk forecasting in fat-tails in emerging market like Argentina, Brazil, Columbia, Pakistan and Sri Lanka, as the observed violations are equal to the expected ones in approximately 42% markets. The block maxima model and conditional POT model are complete failures.
It is further noticed that with the increase confidence level, the dependence and reliability of model decreases.
With the latest updates to Amazon's SEO algorithm, you can use external traffic to influence your product rankings. One such method is to utilize Google SEO. To do this, companies need to create a blog and add direct links to your product listings in your posts, writing informative yet engaging articles in a way that excites your audience. This will increase sales and thus improve product rankings.
If views are low compared to total sales, this can affect your ranking on Amazon. This can be controlled by introducing a login page. If you're a Brand Registered seller, you can create custom landing pages for the products you want to highlight.
Value-at-risk has always attracted the attention of academician and analysts and adopted widely after the financial crisis of the 1990s. It is generally estimated under various distributional assumptions while considering leptokurtic behavior, asymmetries, non-normal behavior of data and volatility clustering, etc but tails are ignored. However, a study of the behavior of the tails is more exciting as it is generally less observable but has a high impact. This study provides an insight into the predictive performance of symmetric and asymmetric EVT-based models in emerging markets for a period of 2000 to 2018.
The predictive performance of unconditional POT model based on generalized Pareto distribution is found better in comparison to block maxima model based on GEV distribution and conditional POT model based on GPD. Block maxima model overestimates returns and thus underestimates risk. On the other hand, condition POT model underestimates returns and thus overestimates risk. However, the problem of clustering in volatility is there. The VaR model is neither country nor market-specific, the model for risk estimation is global is nature as unconditional POT model based on generalized Pareto distribution can be applied to most of emerging markets, to forecast risk.
These results have important policy implications for portfolio managers as well as regulators. Portfolio managers may get additional insight in making decisions regarding resource allocation, portfolio diversification and risk management. The regulators may step to reconsider the disclosure requirement, governance laws and efforts to promote the role of equity markets in respective countries.