Research Article - (2021) Volume 10, Issue 10
Received: 24-Aug-2021
Published:
30-Oct-2021
Citation: Asnake Tilaye, Bayan Ahmed and Fikadu Gemeda.
“Evaluation of Alternative, Fixed, Conventional Furrow Irrigation Systems and
Irrigation Water Levels on Potato (Solanum Tuberosum L.) Yield at Oda Sirba
Scheme." Irrigat Drainage Sys Eng 10 (2021): 290.
Copyright: © 2021 Asnake Tilaye. This is an open-access article distributed under
the terms of the Creative Commons Attribution License, which permits unrestricted
use, distribution, and reproduction in any medium, provided the original author
and source are credited.
Water availability is becoming a critical issue in Ethiopia so that preferable irrigation technologies need to be developed and water productivity of irrigated crops through water management is a vital option in water scarce areas. Hence, the objective of this study was to enhance potato tuber production through the application of different irrigation system and deficit irrigation application under highland climatic condition. Field experiment was carried out at farmer field of Oda Sirba scheme for three consecutive years with three furrow irrigation system and one deficit irrigation 80% ETc and control irrigation 100% ETc replicated three times in a split plot design. Obtained results revealed that, the highest seasonal water requirement value of 497.8 mm was at CFI with full irrigation application while, the lowest value of 199.2 mm was by AFI and FFI with 80% ETc. The analysis of variance indicated that there was significant (P ≤ 0.05) difference obtained for yield and WUE of potato tuber. The highest yield of 36.12 t ha-1 was obtained from control treatment with CFI while FFI at deficit application had the lowest yield of 26.3 t ha-1. The nearest yield of 34.22 t ha-1 was obtained by AFI method with full irrigation application. Higher water use efficiency was observed at AFI method at a control level with 13.75 kg m-3 and higher than at 80% ETc with 13.46 kg m-3 but there is no significant variation between them. Highest benefit cost ratio of 47.85 was obtained from AFI method at control level. Yield and water use efficiency based comparison had shown that there was significant difference between the yield and WUE obtained at AFI and CFI, while applied water in AFI was reduced by 50%. Therefore, it can be concluded that increased water saving and associated water productivity through the use of AFI with 100% ETc, can solve problem of water shortage which improve WUE without significant reduction of yield. AFI system at full irrigation application appears to be a promising alternative for water conservation and labor saving with negligible reduction in yield.
Irrigation level • Alternate furrow • Deficit irrigation • Potato • Water use efficiency
For a country like Ethiopia that follows Agricultural Development Lead Industrialization (ADLI), there is no readily identifiable yield increasing technology other than improved seed-water–fertilizer approach. Irrigation will, therefore, play an increasingly important role now and in the future both to increase the yield from already cultivated land and to permit the cultivation of what is today called marginal or unusable land due to moisture deficiency. Therefore, as they reported mechanisms which increase water productivity of an irrigation scheme should be introduced. Improvement of irrigation water management is portrayed as the key issue in copping up with crop irrigation needs and future water scarcity. One of the irrigation management practices which could result in water saving is through deficit irrigation [1]. One more option to increase water productivity through deficit level is alternate and fixed furrow irrigation system.
Furrow irrigation water application system is most popular of surface irrigation, as it requires a smaller initial investment compared to other types of irrigationwater application systems. This type of irrigation method is the most widely used in our country in almost all-large and small irrigation schemes. It has been reported that 97.8% of irrigation in Ethiopia is done by surface methods of irrigation especially by furrow system in farmer’s fields and majority of the commercial farms.
Conventional furrow irrigation (CFI), where every furrow is irrigated during consecutive watering, is known to be less efficient particularly where there is shortage of irrigation water. Proper furrow irrigation practices can minimize water application and irrigation costs, save water, control soil salinity build up and result in higher crop yields [3]. By irrigating alternative furrows, half of root is exposed to wet soil condition and the other half is exposed to dry soil condition.
Many ways to save agricultural water use have been investigated. Various researchers [4] have used wide spaced furrow irrigation or skipped crop rows as a means of improving WUE. They selected some furrows for irrigation while other adjacent furrows were not irrigated for the whole season i.e. fixed furrow irrigation (FFI) which means that irrigation is fixed to one of the two neighboring furrows. In general, these techniques are a trade-off a lower yield for a higher WUE.
Alternate furrow irrigation (AFI) is also practiced when the supply of water is limited. Besides, this alternate furrow method is adopted where salt is a problem. Water is discharged in in alternate furrows keeping the in-between furrow dry. In the subsequent irrigation, water is allowed to flow through the alternate furrows that had been kept dry on the previous occasion. This method saves quite a good amount of water and is very useful and crucial in areas of water scarcity and salt problems.
Deficit irrigation is an optimization strategy in which irrigation is applied during drought-sensitive growth stages of a crop. Outside these periods, irrigation is limited or even unnecessary if rainfall provides a minimum supply of water. Deficit irrigation aims at stabilizing yields and plays an important role in increasing water use efficiency (WUE) [5].
Potato (Solanum tuberosum L.) is the world’s most important root and tuber crop worldwide. It is grown in more than 125 countries and consumed almost daily by more than a billion people. Hundreds of millions of people in developing countries depend on potatoes for their survival [6].
Field experiment was carried out at Bekoji Negeso during the dry cropping season for three consecutive years. The experimental site (7º 53’N, 39º 25’E, 2780 meters above sea level) located in the Arsi Zone. The long-term average annual rainfall at Bekoji is 1098 mm, 62% of which falls between the months of June and October, and the mean maximum and minimum temperature are 19º C and 6.8º C respectively (Figure 1).

Figure 1. Location map of the study area.
Soil sampling and analysis
Representative composite soil samples were collected from (0 – 15, 16 – 30, 31 – 60) cm soil depths for Textural, FC, PWP, ECe, pH, Organic Carbon and OM analysis. Bulk density of the field was determined from undisturbed soil samples using core sampler having a dimensions of 5.0 cm diameter and 5.0 cm height (98.21 cm3). The samples were oven dried for 24 hours at temperature of 105º C to obtain dry soil sample. Hence, the bulk density (BD) was computed following Eq. (1).
 (1)
(1)
Experimental treatment and design
Field experiment was conducted for three consecutive years to evaluate the effect of irrigation methods and irrigation levels on yield and water productivity of potato. The experimental field was divided into 18 plots of 5 m by 5 m to accommodate a plot consisted of seven ridges and eight furrows and representing a single treatment. The plots and replications had a buffer zone of 1.5 m and 3 m length respectively from each other to eliminate influence of lateral flow of water. The crop was planted at a plant and row spacing of 30 cm and 83 cm respectively. The experimental treatments include three irrigation systems, viz., the Alternate furrow irrigation, fixed furrow irrigation, conventional furrow irrigation and one deficit irrigation application levels, viz., 80% ETc, and a control irrigation of 100% ETc application.
The experimental design was a split plot design with three replications. The irrigation system was used as main plots and irrigation water levels as subplots (Table 1).
| Irrigation systems | Irrigation Level (sub-plot) | |
|---|---|---|
| (Main-plot) | 100% ETc | 80% ETc |
| Alternative furrow irrigation | T1 | T2 |
| Fixed furrow irrigation | T3 | T4 |
| Conventional furrow irrigation | T5 | T6 |
Crop water requirements and irrigation Water Management
Crop water requirement: Reference evapotranspiration, ETo was estimated using FAO Penman-Monteith equation from long term meteorological data collected from Meraro meteorological station with the help of CROPWAT 8.0 model software. Seasonal crop water requirements, ETc was estimated by multiplying long term ETo value with the established Kc value (Eq. 2).
ETC= ET0 xKC (2)
Where, ETc is Crop evapotranspiration (mm/day); ETo is Reference crop evapotranspiration (mm/day) and Kc is Crop coefficient (fraction).
Due to differences in evapotranspiration during the various growth stages, Kc for a given crop varies over the growing period. The growing period can be divided into four distinct growth stages: initial, crop development, midseason and late season. The growth period of potato in the experimental site is 120-days and it was divided into four stages, viz, initial stage (20 days), development stage (40 days), mid stage (40 days) and late stage (20 days). Kc for potato crop under Bokoji climatic condition which is considered as semi-humid were established from the range listed as 0.4 – 0.5 for the initial, 1.05 -1.2 for the mid stage and 0.85 – 0.95 for the late growth stages by [7] as shown in Table 2.
| Growth stage | Initial | Development | Mid | Late |
|---|---|---|---|---|
| Development day | 20 | 40 | 40 | 20 |
| Kc value | 0.43 | 0.73 | 1.1 | 0.88 |
| Root depth (m) | 0.30 - 0.42 | 0.43 – 0.60 | 0.6 | 0.6 |
Irrigation water management: Soil moisture level in all plots was brought to field capacity for each treatment in the last irrigation during the common irrigation time. Soil water availability in the experiment was tested from routine measurements of soil moisture content by the gravimetric method.
The wet soil samples was weighed and placed in an oven dry at a temperature of 105ºC and dried for 24 hours. The gravimetric water content was converted to equivalent depth (D) from Eq. (3).
 (3)
(3)
Where, D is the depth of available soil moisture (mm); Ww is wet soil weight (gm); Wd is dry soil weight (gm); BD is the soil dry bulk density (gm cm-3) and drz is the sampling depth within the crop root depth (mm).
The soil moisture depleted between irrigation was obtained from Eq. (4).
 (4)
(4)
Where, IRn is the net irrigation requirement (mm) and FC is the soil moisture content at field capacity (mm).
Irrigation scheduling: Total available water (TAW) was computed from the moisture content of field capacity and permanent wilting point using the following Eq. (5).
TAW = (FC− PWP) x BD x Dz (5)
Where, TAW is the total available water in the root zone (mm), FC and PWP are moisture content at field capacity and permanent wilting point (%) on weight basis respectively and Dz is the root zone depth of potato at times of each irrigation. For maximum crop production, irrigation schedule was fixed based on p-value. The p for potato that was used in this study was 35% of TAW (p = 0.35) [8].
Hence, RAW was computed from the Eq. (6).
RAW = TAW × p (6)
Where, RAW is the readily available water or net irrigation depth, IRn (mm), p is allowable permissible soil moisture depletion fraction and TAW is total available water in the root depth (mm).
Hence, the IRn of irrigation was computed from Eq. (7).
IRn = TAW* P (7)
Where, IRn is the net irrigation requirement (mm) and p. is depletion fraction. Irrigation interval, f, was estimated using the following Eq. (8).
 (8)
(8)
Where, f is irrigation interval (day) and ETc is mean daily crop water requirement (mm day-1)
Whenever there is rainfall between irrigation, the IRn could be obtained from the Eq. (9).
 (9)
(9)
Where, Peff is effective rainfall (mm)
The effective rainfall, Peff was estimated using the method given by (Allen et al., 1998) as,
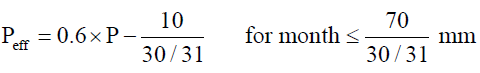 (10)
(10)
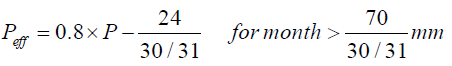 (11)
(11)
Where, P is daily rainfall (mm)
Field application efficiency and gross irrigation water requirement
Field irrigation application efficiency (Ea) is the ratio of water directly available in crop root zone to water received at the field inlet. Furrow irrigation could reach a field application efficiency of 70%. when it is properly designed, constructed and managed. The average ranges vary from 50 to 70%. However, a more common value is 60% [9]. For this particular experiment, irrigation efficiency was taken as 60%., which is common for surface irrigation method in furrow irrigation. Based on the net irrigation depth and irrigation application efficiency, the gross irrigation water requirement was calculated based on eq. (12).
 (12)
(12)
Where, IRg the gross irrigation requirement (mm) and Ea is the field application
efficiency (%).
Setting and discharge measurement of parshall flume
Irrigation water applied to each experimental plot was measured by 3-inch Parshall flume (PF) made from metal sheet and installed 10 m away from the nearest plot along main canal. Leveling in all direction of converging section was checked. Leveling for the diverging section checked only across the waterway, as the base of the diverging part of PF is slightly slope upward. The entrance section was set 4 cm above the canal bed to avoid submergence flow and stone riprap was put in the downstream side on canal bed to minimize downstream scouring. Only one measurement was required to determine flow rate of free flow condition. This is the height of water from gauge of PF written on two-third surface wall of the entrance section.
Calculated gross irrigation was finally applied to each experimental plots based on the treatments proportion. Volume of water applied for every treatment was determined from plot area and depth of gross irrigation requirement. Time required to irrigate each treatment was calculated from the ratio of volume of applied water to the discharge-head relation of 3-inch PF. Since discharge level might vary at field condition, time required was calculated from 5 to 15 cm head levels. The time required to deliver the desired depth of water into each furrow was calculated using eq. (13).
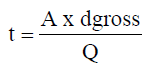 (13)
(13)
Where: dg - gross depth of water applied (mm), t - application time (sec), A - plot Area (m2) and Q - flow rate (l/s)
Data collection
The sample locations were selected systematically in the central ridges randomly (4 m x 4.15 m). Yield data were collected from plants in the net plot area of (16.6 m2). The collected parameters were marketable tuber yield (t ha−1), unmarketable tuber yield (t ha−1), total tuber yield (t ha−1) and water productivity (Kg m-3).
Marketable tuber yield (t ha−1): was done by weighing all the tubers which were free from defects, disease, crack, and other physiological disorders and not underweight per net plot area and converting into ton per hectare.
Total tuber yield (t ha−1): was calculated as the sum of the weights of marketable and unmarketable tubers from the net plot area and transformed into ton per hectare.
Water Use Efficiency (kg m-3): Water use efficiency sometimes called water productivity is simply the ratio of the water beneficially used and the quantity of water delivered. Water productivity was determined based on the ratio of yield of potato (bulb yield per hectare) to the net irrigation depth plus effective rainfall used from establishment to harvest expressed as (kg) of bulb yield per (m3) of water. It was calculated based on eq. (14)
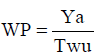
Where: WP - Water productivity (kg/m3), Ya - Actual yield (kg/ha), Twu – Total water used (m3/ha)
Economic water productivity
Economic water productivity analysis was begun by considering the general relationship between the crop water use and crop yield per hectare of land at different irrigation application levels using the partial budget analysis. For economic evaluation of the total return, net benefit, marginal return rate and cost benefit ratio using the different amount of water applied, the Partial Budget Analysis (PBA) was used following the CIMMYT procedure [10]. It is a way of calculating the total costs that vary and the net benefits of each treatment.
Economic data include input cost like cost for water (water pricing), potato tuber, fertilizers, land rent, chemicals and labor of production. However, the costs that varied among treatments were cost of water and labor for watering during experimental season. As an output, total gross benefit was calculated from tuber yield of potato. Local market price of potato tuber was assessed during the harvest time and was changed to hectare bases. Benefit cost ratio for each treatments were evaluated and income was calculated on the basis of local market price of potato on site during harvesting time.
According to (CIMMYT, 1988), the average yield was adjusted down wards by 10%. The gross returns were computed by multiplying average market rate with the yield of respective treatments during the crop harvesting period. The variable costs of this experiment among treatments were cost of irrigation water and costs of labor for irrigating. The field price of potato during the harvesting season was 12 Birr kg-1. The net income was calculated by subtracting total variable cost production from total return using eq. (15).
NI =TR –TVC (15)
Where: NI - Net income, TR - Total income from sales, TVC - Total variable cost spent during production.
The marginal return rate in measures the increase of the net income, which is generated by each additional unit of expenses and is computed as using eq. (16)
 (16)
(16)
Where: MRR - Marginal rate of return (%), ΔNI – change in net income, ΔVC – change in variable cost
Statistical analysis
The collected data were statistically analyzed using statistical analysis system (SAS) version 9.0 statistical package using procedure of general linear model for the variance analysis. Mean comparisons were executed using least significant difference (LSD) at 5% probability level when treatments show significant difference to compare difference among treatments mean.
Soil analyses
Physical properties of soil: The laboratory results of the average soil physical properties of the experimental site were presented in (Table 3) below.
The average result of the soil physical properties from the experimental site showed that the composition of sand, silt and clay percentage were 27.56%, 29.78% and 42.67% respectively. Thus according to USDA Soil textural classification, the soil is classified as Clay. Bulk density can be managed, using measures that limit compaction and build soil organic matter. The average bulk density of the experimental soil varied from 0.95 g/cm3 at the top root zone (0 -15 cm) to 1.14 g/cm3 at the lower root zone layer (31- 60 cm) (Table 3). The weighted average bulk density of the experimental site was 1.05 g/cm3. High value of TAW (188.00 mm/m) was found in subsurface soil, whereas lower values (178.00 mm/m) were found in the top soil (Table 4). The average value of TAW was 181.67 mm/m.
| Depth | Bulk density (g/cc) | FC (%) | PWP (%) | TAW | TAW | Texture | |||
|---|---|---|---|---|---|---|---|---|---|
| (cm) | (V/V) | (V/V) | (mm/m) | (mm) | % Sand | % Silt | % Clay | Class | |
| 0 – 15 | 0.95 | 37.3 | 19.5 | 178 | 26.7 | 27.33 | 28 | 44.67 | Clay |
| 1 6– 30 | 1.07 | 37.6 | 19.7 | 179 | 26.85 | 29.33 | 31.33 | 39.33 | Clay |
| 31 – 60 | 1.14 | 39 | 20.2 | 188 | 56.4 | 26 | 30 | 44 | Clay |
| Aver. | 1.05 | 37.97 | 19.8 | 181.67 | 36.65 | 27.56 | 29.78 | 42.67 | Clay |
Chemical properties of soil: The average pH value of the experimental site through the analyzed soil profile was found to be in recommended range with average value of 5.18% (Table 4). The average Organic Matter content and Organic Carbon content of the soil had an average value of 3.20%, 1.85% respectively over 60 cm depth of soil profile. An average electrical conductivity of an experimental soil is 0.10 ds/m. soils that had ECe < 2 (ds/m) was non saline.
| Depth (cm) | pH | Total organic matter (% OM) | Total organic carbon (% OC) | ECe (ds/m) |
|---|---|---|---|---|
| 0 – 15 | 5.27 | 3.15 | 1.83 | 0.1 |
| 1 6 – 30 | 5.13 | 3.19 | 1.85 | 0.12 |
| 31 – 60 | 5.13 | 3.24 | 1.88 | 0.09 |
| Aver. | 5.18 | 3.2 | 1.85 | 0.1 |
Irrigation water applied of potato tuber throughout the growth stages
From (Table 5) water saved from treatment combination of AFI and FFI with 100% ETc, and 80% ETc levels were 50%, and 60% of total net volume of irrigation water applied respectively. Whereas CFI with 80% obtained was 20.0%. According to [13] comparative report of full irrigation with partial root drying for field grown potato, partial root drying treatments saves 30% of water which increases water use efficiency of the crop. The optimum seasonal irrigation requirement was found to be 497.8 mm for every furrow irrigation method. For AFI and FFI, 248.9 mm of water was needed throughout the growing season of potato tuber (Table 5).
| Treatment | Growth stage | IRg (mm) | Water saved (%) | |||
|---|---|---|---|---|---|---|
| Initial | Development | Mid | Late | |||
| AFI 100% ETc | 27 | 40.6 | 124.95 | 56.35 | 248.9 | 50 |
| AFI 80% ETc | 21.6 | 32.48 | 99.96 | 45.08 | 199.12 | 60 |
| FFI 100% ETc | 27 | 40.6 | 124.95 | 56.35 | 248.9 | 50 |
| FFI 80% ETc | 21.6 | 32.48 | 99.96 | 45.08 | 199.12 | 60 |
| CFI 100% ETc | 54 | 81.2 | 249.9 | 112.7 | 497.8 | 0 |
| CFI 80% ETc | 43.2 | 64.96 | 199.92 | 90.16 | 398.24 | 20 |
Effect of Irrigation Methods and Irrigation water levels on yield of potato tuber
The yield collected from each treatment was further differentiated to total yield, marketable yield and unmarketable yields (Table 6). WUE = Water Use Efficiency, AFI = Alternate Furrow Irrigation, FFI = Fixed Furrow Irrigation, CFI = Conventional Furrow Irrigation, CV = coefficient of variation, LSD = Least significant difference, S. Em = Standard error of mean
Marketable tuber yield (t ha-1): Analysis of variance (Table 6) showed that marketable tuber yield was significantly (P<0.05) affected by irrigation methods (IMs) and irrigation levels (IL). The largest mean value of yield 31.51 t ha-1 was produced under CFI, but statistically the yield recorded by AFI and FFI were not significantly different. Accordingly marketable tuber yield was influenced by Irrigation application levels; the average potato yield perceived by 100% ETc was 30.37 t ha-1 and 23.32 t ha-1 under 80% ETc. The lower marketable tuber yield was that received the least water.
Total tuber yield (t ha-1): Analysis of variance Table 6 showed that total tuber yield was significantly (P < 0.05) affected by irrigation methods (IMs) and irrigation levels (IL). The largest mean value of 33.49 t ha-1 was produced by CFI, and also the total yield of AFI and FFI were significantly different (P<0.05). The total yield recorded for AFI and FFI were (30.51 t ha-1 and 29.00 t ha-1) respectively. The total tuber yield was nearly the same in both (AFI and FFI). Accordingly total tuber yield was influenced by irrigation application levels; the average total tuber yield obtained by 100% ETc was 34.01 t ha-1 and 29.26 t ha-1 by 80% ETc irrigation level. Found no difference in potato tuber yield between full irrigation (100% ETc) and PRD (70% of water applied to full irrigation from tuber initiation to maturity) in a field experiment, which suggest that PRD could be an effective strategy to improve WUE while sustaining yields provided PRD is optimized in terms of the timing of application and shifting and volume of irrigation water.
| Irrigation Method (IM) | MY (t ha-1) | TY (t ha-1) | WUE (kg m-3) |
|---|---|---|---|
| AFI | 24.84b | 30.51b | 13.61a |
| FFI | 24.18b | 29.00c | 12.97b |
| CFI | 31.51a | 33.49a | 7.98c |
| S.Em± | 0.46 | 0.17 | 0.05 |
| CV | 2.97 | 0.93 | 0.77 |
| LSD (5 %) | 1.81 | 0.67 | 0.2 |
| Irrigation Level (IL) | |||
| 100% ETc | 30.37a | 34.01a | 11.25a |
| 80% ETc | 23.32b | 29.26b | 11.79a |
| S.Em± | 0.26 | 0.22 | 0.11 |
| CV | 1.68 | 1.22 | 1.59 |
| LSD (5 %) | 1.58 | 1.35 | 0.35 |
Combined effect of irrigation methods and irrigation water levels on tuber yield
From Table 7 the interaction data of marketable yield and total tuber yield had significant effect (P<0.05) due to Irrigation method (IM) and irrigation level (IL) and water use efficiency was not significantly affected.
Total potato tuber yield (t ha-1): As indicated from the result the difference observed among irrigation methods as combined with irrigation levels in terms of total tuber yield was statically significant (P < 0.05) effect (Table 7). However, total tuber yield was nearly the same in both (CFI and AFI) irrigation methods at full irrigation application (100% ETc); whereas total depth of water applied under every furrow irrigation was almost double as compared with that of applied under alternate furrow irrigation. The maximum tuber yield was 36.12 t ha-1 at full irrigation application under CFI. Similar yield of 34.22 t ha-1 was obtained by AFI method at full irrigation application. Alternate furrow irrigation method produced total tuber yield of 33198 kg/ha which showed insignificant difference as compared with that obtained under every furrow irrigation (33369 kg/ha) (Figure 2).
| Interaction (IS x IL) | MY (t ha-1) | TY (t ha-1) | WUE (kg m-3) |
|---|---|---|---|
| AFI x 100% ETc | 30.01b | 34.22b | 13.75a |
| AFI x 80% ETc | 19.67d | 26.80d | 13.46ab |
| FFI x 100% ETc | 27.68c | 31.69c | 12.73c |
| FFI x 80% ETc | 20.68d | 26.30d | 13.21bc |
| CFI x 100% ETc | 33.41a | 36.12a | 7.2e |
| CFI x 80% ETc | 29.61bc | 34.69ab | 8.71d |
| S.Em± | 0.47 | 0.44 | 0.18 |
| CV | 3.06 | 2.4 | 2.72 |
| LSD (5 %) | 2.14 | 1.26 | 0.49 |

Figure 2. Potato tuber at planting and maturity stage.
Therefore, by implementing alternative furrow irrigation technique at full irrigation level, almost the same tuber yield was obtained comparing with every furrow irrigation method. This result agreed with outcome obtained conclude that alternate furrow irrigation (AFI) or partial root-zone drying (PRD) can increase water productivity with no or minor yield lo ss.
The result also agreed with the outcome reported that alternate furrow irrigation or partial root-zone drying (PDI) saved irrigation water compared to every furrow irrigation while maintaining similar tuber yield with every furrow irrigation.
Even though, fixed furrow irrigation method saves water it is not appropriate method to meet crop water requirement as per growth stage of the crop and yield was reduced significantly. The minimum tuber (26.30) t ha-1 was recorded at FFI method with 80% ETc irrigation level. This result agrees with outcome obtained conclude that improper irrigation depth and frequency can substantially reduce yields by increasing the proportion of rough, distorted tubers.
Effect of irrigation methods and irrigation water levels on water use efficiency
Water Use Efficiency (WUE) sometimes called water productivity was expressed as the ratio of tuber yield at harvest to the water applied during growing season. Decreasing irrigation water application results in an increase in crop water productivity and the reverse is also true. Treatments with lower yield due to less water application had higher water use efficiency. (Table 6) showed that WUE was significantly (P < 0.05) affected due to irrigation methods (IMs) and not significantly affected by irrigation levels (IL). The largest mean value of 13.61 kg m-3 was recorded by AFI, and also that of FFI and CFI were (12.97 and 7.50) kg m-3 respectively. Water productivity was nearly the same in both AFI and FFI due to less irrigation water application. The result indicated that higher yield treatments had low water use efficiencies. Water use efficiency was not significantly affected by the combination of irrigation methods (IM) and Irrigation levels (IL). The highest mean value 13.75 kgm-3 of WUE was recorded at AFI with full irrigation application and the minimum mean value 7.26 kgm-3 was obtained under CFI with full irrigation application (Table 7).
The highest mean irrigation production efficiency of 15.67 kg/m3 is recorded when crop growing season is applied at 50% of irrigation schedule, because yield reduction is less as compared with seasonal water applied. The higher mean value of WUE obtained under AFI was related to lower amount of water applied with uniform lateral movement in crop root zone and minor tuber yield reduction obtained under this method. The reason of having more water productivity (WP) and minor yield reduction for AFI could be related to better distribution of water in root zone in both sides of the ridge that increases water and fertilizer uptakes by plant. WUE obtained between AFI and FFI was statistically non-significant. The same amount of irrigation water was applied for alternate furrow and fixed furrow irrigation techniques. However, alternative drying of root zone under alternate furrow irrigation method showed higher water productivity than fixed drying of root zone under fixed furrow irrigation method. This is due to uniform water distribution between ridges in alternate furrow than fixed furrow irrigation. Uniform water distribution between ridges in alternate furrow irrigation method enhanced root growth and improved nutrient uptake of crop which increases the yield than fixed furrow irrigation method.
Water supply–yield relationship
Water supply-yield relationship is also known as water production function shows that, as the amount of irrigation water level increases yield production function also increased (Figure 3). The slope of the regression line (R² = 1) indicates that the increment of irrigation water level increases tuber yield. Large application of irrigation water for CFI increase yield as compared with other method but consumes large water. Crop yield and water use efficiency can be increased if sufficient amount of water is added and also as the type of furrow method varies the yield and water production also varies. Alternate furrow irrigation gives optimum yield and water production at full irrigation application.

Figure 3. Irrigation water level versus potato tuber yield.
As indicated in Table 8, the result showed that the minimum yield reduction 3.96% was from CFI 80% ETc. But it consumes large amount of water. AFI x 100% ETc result in yield reduction of 5.26% correspondingly saves 50% water from the required amount of gross irrigation. Accordingly, additional area able to be irrigated with saved water. It clearly seen that the value of net yield generated was not influenced only by water applied but also furrow irrigation methods. The volume of water needed to irrigate one hectare area in CFI system is enough to irrigate two hectare area of land in AFI system. So, when the area to be irrigated becomes double in AFI system using the saved volume of water, the yield obtained also becomes double.
| Treatment | Total | Yield | GIrr | water saved | Water saved |
|---|---|---|---|---|---|
| Yield (tha-1) | Reduction (%) | (mm) | (mm) | (%) | |
| AFI x 100% ETc | 34.22 | 5.26 | 248.9 | 248.9 | 50 |
| AFI x 80% ETc | 26.8 | 25.8 | 199.12 | 298.68 | 60 |
| FFI x 100% ETc | 31.69 | 12.26 | 248.9 | 248.9 | 50 |
| FFI x 80% ETc | 26.3 | 27.19 | 199.12 | 298.68 | 60 |
| CFI x 100% ETc | 36.12 | - | 497.8 | - | - |
| CFI x 80% ETc | 34.69 | 3.96 | 398.24 | 99.56 | 20 |
Economic water productivity
The field price of potato during the harvesting season 12 Birr kg-1 and 3.8 Birr m-3 value for water was taken [10]. All the total costs were subtracted from gross benefit to obtain net benefit. Adjusted yield was multiplied by field price to obtain gross field benefit of tuber.
TC= Total cost, UTY= Unadjusted total yield, ATY= Adjusted total yield, GB= Gross benefit, NB =Net benefit, B/C = Benefit cost ratio and MRR= Marginal Return of Rate
The detail evaluation of the economic analysis of treatments has shown that there was increasing trend of net benefit (NB) for increase in water application level (Table 9). It is clear that water saving at high application level is very low, though CFI treatment (T5) has the highest NB.
The extra income which can be obtained from unit increment in investment cost described as marginal rate of return (MRR). The highest MRR was 5,196.03% obtained at T2. This means that for every 3.8 birr invested on applied water of 199.12 mm, farmers can expect to recover 3.8 birr and obtained additional of 51.96 birr. This shows that T2 can be the most preferable type of irrigation treatment to all other tested irrigation treatments as it can generate more profit per extra addition investment in water limited areas. The highest B/C ratio (47.85, and 46.82) was obtained from T1 and T2 respectively (Table 9). This result generally revealed that AFI gave high net income as compared to the other furrow methods for furrow irrigated total tuber yield of potato.
| Treatments | TC (ETB/ha) | UTY (kg/ha) | ATY (kg/ha) | GB (ETB/ha) | NB (ETB/ha) | B/C | MRR (%) |
|---|---|---|---|---|---|---|---|
| T1 | 7,565.66 | 34,220 | 30,798 | 3,69,576 | 3,62,010.34 | 47.85 | |
| T2 | 6,052.53 | 26,800 | 24,120 | 2,89,440 | 2,83,387.47 | 46.82 | 5,196.03 |
| T3 | 7,565.66 | 31,690 | 28,521 | 3,42,252 | 3,34,686.34 | 44.24 | 3,390.24 |
| T4 | 6,052.53 | 26,300 | 23,670 | 2,84,040 | 2,77,987.47 | 45.93 | 3,747.12 |
| T5 | 15,131.33 | 36,120 | 32,508 | 3,90,096 | 3,74,964.67 | 24.78 | 1,068.17 |
| T6 | 12,105.06 | 34,690 | 31,221 | 3,74,652 | 3,62,546.94 | 29.95 | 410.33 |
Conclusion
AFI and FFI save 50% of water. When less irrigation was applied as in alternative furrow irrigation system, the smallest grain yield reduction was happened. In fact, this yield reduction was not statistically significant with CFI treatments. Even though, the highest yield was obtained at CFI at full irrigation application it consumes large amount of water. Therefore, it can be concluded that increased water saving and associated water productivity through the use of 100% ETc with AFI, can solve problem of water shortage which improve WUE without significant reduction of yield. AFI system at full irrigation application appears to be a promising alternative for water conservation and labor saving with negligible reduction in yield.
Recommendation
Based on the findings obtained from the experiment, the following recommendations are made
• Irrigation water management through deficit irrigation strategies should be declared with appropriate irrigation level restriction during growth stages to achieve optimum yield and save water.
• Suggesting of practicing irrigation with different irrigation method save irrigation water and it increases frequency of cultivation, additional command area to be irrigated or use for other purpose of income generation.
• Thus, it is recommended that all possible efforts made to introduce the technology to the farming community since the use of AFI method saves reasonable amount of water without affecting the production in moisture deficit areas. Nonetheless, further studies should be made to identify potentially suitable crops for these three furrow irrigation method.
Irrigation & Drainage Systems Engineering received 835 citations as per Google Scholar report


