Research Article - (2024) Volume 7, Issue 3
Received: 01-Jul-2024, Manuscript No. POLLUTION-24-140371;
Editor assigned: 03-Jul-2024, Pre QC No. POLLUTION-24-140371 (PQ);
Reviewed: 17-Jul-2024, QC No. POLLUTION-24-140371;
Revised: 05-May-2025, Manuscript No. POLLUTION-24-140371 (R);
Published:
17-May-2025
, DOI: 10.37421/2684-4958.2025.08.361
Citation: Varmazyari, Zahra. "Estimating the Radiation Intensity Using Monte Carlo Simulation, Sangan, Baghak Region." J Pollution 8 (2025): 361.
Copyright: é 2025 Varmazyari Z. This is an open-access article distributed under the terms of the creative commons attribution license which permits unrestricted use, distribution and reproduction in any medium, provided the original author and source are credited.
Radioactive elements cause pollution irreparable damage to the environment, as well as long-term consequences, such as genetic mutations and the spread of some cancers associated with radioactive substances. The high concentration of radioactive elements causes its accumulation in the brain and nervous system, which leads to the production of toxins. The current research has simulated the radiation intensity of the Sangan iron mine utilizing the Monte Carlo method and analyzing the geochemical data, the radiation level of this area has been simulated at a confidence level of 90%. The target elements of the above research are uranium, rare earth elements and thorium which are mostly scattered and scattered in different igneous, metamorphic and sedimentary rocks. In research, a regression model was first developed to estimate Radiation Intensity and then it was used to simulate the probabilistic model using MCS. For developing the LR and MCS model, 151 data sets that include the values of Radiation Intensity and also the values of U, REES and Th that were affecting Radiation Intensity were obtained. The average radiation intensity simulated is 2.86 cps, while the real measured Radiation Intensity is 2.85 CPS. These results show that this MCS can model Radiation Intensity with high accuracy. also, with 90% confidence, Radiation Intensity values are in the range of 2.49 to 3.22 CPS. (The global value means of radioactive elements is 1.5 CPS). The results of this research determined that there is pollution of the environment caused by radioactive elements in this area.
Baghak radiation intensity • Radioactive elements • Regression • Monte carlo simulation
Naturally occurring radioactive elements cause pollution with shortterm consequences, such as irreparable environmental damage, as well as long-term consequences, such as genetic mutations and the spread of some cancers associated with radioactive substances. Radionuclides of thorium, uranium, and potassium, especially the decay chains of uranium238, thorium232 and potassium40 are the main origin of natural radioactivity in soils and rocks. The mineralogical composition of rocks and soils is an effective factor in determining natural radiation. Rocks that have relatively high amounts of potassium, thorium and uranium have relatively high radioactivity. Therefore, the analysis of radiation intensity of radioactive elements in soil and rock can be considered as practical research in the field of environmental attitude of mining exploration. The target elements of the above research are uranium, rare earth elements and thorium are mostly scattered and scattered in different igneous, metamorphic and sedimentary rocks.
Rare Earth Elements (REE) are mostly found in the Earth's mantle and crust and are constantly affected by multiphase geological cycles. The processes of erosion, diagenesis, sedimentation and weathering cause contamination of water, soil and sediments with REE. distribution pattern of REE elements in sediments, soil and water helps to identify sources of natural or human pollution. REEs are commonly found in pegmatites, granites, peridotites and carbonates. Rare earth elements enter rivers, the human body and marine ecosystems. These elements have a high affinity with the phosphate groups of biological macromolecules. High concentrations of REE elements lead to accumulation in the brain and nervous system and cause toxicity in the body.
Thorium (Th) is one of the radioactive elements that exist in different concentrations in the environment. Several studies have been conducted on the concentration of 232 Th in rocks, soils, water bodies and sediments. Thorium is released into the atmosphere from natural and human sources, including materials in cosmic rays, the earth's crust, nuclear fuel power plants, volcanic eruptions, mining, rock refining, and coal combustion. Atmospheric particles infected with thorium are detrimental to human health due to enhanced radio and chemical toxicity.
Uranium (U) has been considered due to its chemical and radiation toxicity in various environments. U is a radionuclide whose chemical toxicity is very high. Toxicological and epidemiological research showed the pulmonary and nephrotoxic toxic effects of uranium. In uranium extraction, many substances are dissolved in the washing, these substances (such as heavy metals) will be harmful to the environment.
The current research has simulated the radiation intensity of the Sangan iron mine utilizing the Monte Carlo method and analyzing the geochemical data, the radiation level of this area has been simulated at a confidence level of 90%. In the following, the study area and the methods used in this research have been described [1-5].
The description of the database
The complex of Sangan iron ore deposits is 300 kilometers southeast of Mashhad, 68 kilometers southwest of Taibad and18 km northeast of Sangan and near the Afghanistan border. The Sangan Skarn iron ore deposit is located in the eastern part of the Khaf- Kashmar Bardeskan volcano-plutonic-metallogenic belt (Figure 1) Sangan with a reserve of more than 1000 million tons of iron ore (53% iron), One of the most important deposits of iron skarn in the world. In the present study, sampling from Baghak Mine in Sangan Mines was done based on the method of measuring radioactivity and radiation. The database used in this study, including 151 datasets, was taken from previous works. Also, the radiation value (Counts Per Second (CPS)) of the existing boreholes was determined with the prospecting charts of each borehole. Spectroscopy operation was done with model spectrometer RS 230 (made in Canada). The database includes Thorium (Th), Rare Earth Elements (REEs), Uranium (U) and Radiation Intensity (CPS), their Statistical features are shown in Table 1.

Figure 1. Structural map of the Sangan deposit.
| Maximum | Minimum | Symbol | The unit | Parameters |
| 138.42 | 1.21 | Th | Ppm | Thorium |
| 14874.07 | 12.43 | REEs | Ppm | Rare-earth elements |
| 923.8 | 1.6 | U | Ppm | Uranium |
| 2100 | 230 | CPS | CPS | Radiation intensity |
Tabel 1. Statistical characteristics of site data.
Regression
The regression model was proposed by Sir Francis Galton in 1894. A regression model is performed in such a way that it determines the correlation between two or more variables with a cause-and-effect relationship and predicts the desired issue using the relationship. This is considered a statistical test to define the relationship between parameters. For modeling in this article, the database of the corrected data set contains 151 data, which is divided into two parts. data for building the model (70% of 151 data randomly) and test data (30% of 151 data randomly) They were randomly divided to estimate the amount of radiation intensity (Table 2). To find the optimal equation, more than 50 equations were analyzed in the statistical software, and the following relationship has the highest correlation in the modeling stage [6-10].
CPS=1+(0.26 × REEs-0.36 × Th+0.93 × U) (1)
|
Type of data |
R2 |
MSE |
|
Training data |
0.88 |
0.04 |
|
Testing data |
0.88 |
0.01 |
Table 2. Result of regression analysis for predicting radiation intensity.
Coefficient correlation (R2) and Mean Square Error (MSE) have been used to evaluate the performance of the model. The relevant relationships are:
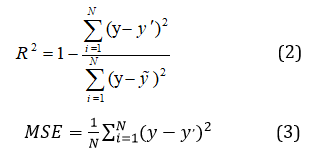
In these relationships, (y') and (y) is predicted and measured values respectively, (y)~ and (N) are the average and the number of data respectively [7]. It is necessary to explain the coefficient criterion Correlation shows the agreement between measured and predicted values, which is the best case where Its value is one and if it is zero, it means that the performance of the model is too weak for prediction. Table 2, Figures 2 and 3 show the results of model analysis.

Figure 2. Correlation between measured and predicted radiation intensity data.

Figure 3. Correlation between measured data and test radiation intensity data.
Monte Carlo Simulation Method (MCS)
The MCS is the numerical method developed to solve complex problems. In general, MCS is a modeling method in which simulation results have been processed into an arithmetic equation or from optimal modeling in which input values are randomly chosen from probability distribution functions. This method is associated with the generation of random numbers and is repeated N times until a probability density distribution is obtained for the output parameter.
The main purpose of Monte Carlo simulation is to quantify product variability and uncertainty, and also in MCS, the main parameters of variability and uncertainty are investigated with their relative contribution to the variance and also the output range of the model [8]. Common estimator models estimate certain values, while in MCS a set of predicted values are input to the model, and then the output will have many values. This method improves the real representation of the simulation model. In MCS, a random estimate is chosen for each input in an interval, then the output will be calculated based on these random values. This step is repeated several times. The accuracy of model results increases by increasing the number of samples in the model. By determining the value of N, the repetition of the simulation process and the generation of random numbers in an MCS is specified. Then many results are obtained as the output range. In Monte Carlo simulation models, parameters are considered independent when the values of one variable do not affect the values of other variables, and the independence of random variables facilitates uncertainty analysis. To identify dependent random variables, it is necessary to characterize the relationship of probability distributions. Usually, correlation coefficient and covariance indicate the rank of dependence among parameters. Description with details of the MCS benefits can be found here. Monte Carlo simulation was done in at RISK software the extended regression model, i.e., equation (1), was used to model radiation intensity as well as to identify the parameters with the greatest influence on radiation intensity (system output). Based on the data in the random model, a probability distribution is assigned to each of the model inputs. (REEs, U, and Th). In this study, data distribution was performed with the Easy Fit program. Kolmogorov Smirnov test was employed to determine the optimal distribution function. As a result of the data analysis, Table 3 shows the two top-fitting and bestfitting distributions. The probability distribution function of the input parameters used in the simulation is shown in Figure 4. There are usually two sampling methods in MCS;
With the Latin hypercube sampling method, it is expected that classified sampling design can well represent the up and down ends of a distribution used for modeling. According to previous studies, The LHS method is better than the simple method because it will require fewer simulations at the same accuracy. To ensure the randomization of possible combinations, the number of 10000 replications was selected [9-13]. The relationship between the inputs is very important on the modeling. So, to obtain the best model for radiation intensity simulation, the correlation among input data was checked by the STATISTICA software. In this software, this relationship is specified via a correlation matrix among input data (Table 4). To predict the probability of Radiation Intensity, the following steps are done:

Figure 4. Probability distribution function of input data.
The distribution model and summary statistics of radiation intensity obtained by MCS are shown in Figure 5. Furthermore, the results of measured radiation intensity, predicted LR model radiation intensity, and simulated MCS of radiation intensity are shown in Figure 6. The logistic distribution was the optimal model for Radiation Intensity. The average of radiation intensity simulated is 2.86 cps, while the real measured radiation intensity is 2.85 cps. These results show that this MCS can model radiation intensity with high accuracy. also, with 90% confidence, radiation intensity values are in the range of 2.49 to 3.22 cps. (The global value means 1.5 cps (United Nations Scientific Committee, 2010)). This analysis can be used to estimate Radiation Intensity with different grades of safety [14-17]. The obtained output shows that the predicted results and the modeled values have an acceptable match.
|
Functions |
Inputs |
|
Logistic (Location=1.203, Scale=0.062) |
Thorium |
|
Normal (Location=3.1221, Scale=0.722) |
Rare-earth elements |
|
Logistic (Location=1.5939, Scale=0.1829) |
Uranium |
Table 3. Probability distribution functions of inputs.
|
|
Th |
REEs |
U |
|
Th |
1 |
0.45 |
0.65 |
|
REEs |
0.45 |
1 |
0.72 |
|
U |
0.65 |
0.72 |
1 |
Table 4. Correlation matrix for input parameters.

Figure 5. Distribution function and statistical summary of radiation intensity.

Figure 6. Comparison of predicted results with LR model and simulated with MC modeling and measured.
Naturally occurring radioactive elements cause pollution with shortterm consequences, such as irreparable environmental damage, as well as long-term consequences, such as genetic mutations and the spread of some cancers associated with radioactive substances. The current research has simulated the radiation intensity of the Sangan iron mine utilizing the Monte Carlo method and analyzing the geochemical data, the radiation level of this area has been simulated at a confidence level of 90%. The target elements of the above research are uranium and thorium and rare earth elements that are mostly scattered and scattered in different igneous, metamorphic and sedimentary rocks [18-20].
In research, a regression model was first developed to predict Radiation Intensity and then it was used to simulate the probabilistic model using MCS. For developing the regression and MCS model, 151 data sets that include the values of Radiation Intensity and also the values of U, REES and Th that were affecting Radiation Intensity were obtained. The results obtained in this study are as follows:
Not applicable to the subject of this research.
The authors declare no conflict of interest.
The Sangan iron ore complex did not give written consent for their data to be shared publicly, so due to the nature of the research supporting data is not available.
No funding was provided to carry out this work.
We are grateful to the Sangan Iron Ore Complex for the access to the mine data and for giving us information about the Sangan Iron Ore Mine.
[Crossref] [Google Scholar] [PubMed]
[Google Scholar] [PubMed]
[Crossref] [Google Scholar] [PubMed]
[Crossref] [Google Scholar] [PubMed]
[Crossref] [Google Scholar] [PubMed]
Journal of Pollution received 64 citations as per Google Scholar report