Research Article - (2022) Volume 12, Issue 5
Received: 10-May-2022, Manuscript No. jcde-22-63318;
Editor assigned: 13-May-2022, Pre QC No. P-63318;
Reviewed: 17-May-2022, QC No. Q-63318;
Revised: 20-May-2022, Manuscript No. R-63318;
Published:
25-May-2022
, DOI: 10.37421/2165-784X.2022.12.450
Citation: Ali, Yahia M.S and Tarek Abdelaleem. “Effect of Silica Fume on the Behavior of Lightweight Rc Beams Made from Crushed Clay Bricks.” J Civil Environ Eng 12 (2022): 450
Copyright: © 2022 Ali YMS, et al. This is an open-access article distributed under the terms of the Creative Commons Attribution License, which permits unrestricted use, distribution, and reproduction in any medium, provided the original author and source are credited.
Sources of funding : None
Crushed Over-burnt Clay Bricks (COBB) is a promising alternative to the natural gravel aggregate in Light Weight Concrete (LWC) production because of its high strength-to-weight ratio. In addition, COBCB is considered a green aggregate by solving the problem of disposing of this solid waste. in this paper, a total of fifteen Reinforced Concrete (RC) beams were constructed and tested up to failure. The experimental program was classified to five groups, the first group was casted with Normal Weight Concrete (NWC) as control, and the remaining four groups were casted with LWC. The test parameters were concrete type; reinforcement ratio and silica fume (SF) content. The behavior of beams was evaluated in terms of crack patterns, failure mode, ultimate deflection, and ductility. Based on the experimental results, the resulting concrete showed that it satisfies the requirements of LWC in terms of unit weight and strength. In addition, increasing the reinforcement ratio and silica fume content increased overall beam performance. The results revealed that measurable enhancements to the majority of the performance characteristics of LWC beam by adding SF. Thus, using COBCB as a coarse aggregate has successfully been used to produce good quality lightweight concrete. Both ACI 318-14 and CSA-A23.3-14 give acceptable for predicting cracking moment, ultimate capacity and mid-span deflection.
Recycling • Lightweight concrete • Crushed clay-bricks • Silica fume
The coarse aggregate is the least expensive per weight unit, but it makes up the most weight. In some places, such as the eastern and north-eastern states of India and Bangladesh, natural coarse aggregate is scarce as an aggregate in concrete [1-3]. Therefore, it necessitates finding other sources and alternatives from local sources. It has been considered an economical method of avoiding excessive transportation expenses. Crushed Over Burnt Clay Bricks (COBCB) are available in abundance in rural areas as solid waste from traditional brick production. In addition, the high temperature exposed to COBCB causes the aggregate to become lightweight, with some pre-existing voids inside the aggregate that make them inferior to the conventional stone aggregates, and thus the porous mixes made with brick aggregate become too weak to sustain heavy loadings [4]. Using COBCB is one of the practical ways: it is not only economically sustainable, particularly, but also achieving a more environmentally friendly concrete [5].
LWC is defined as having an oven-dry density of up to 1,950 kg/m3; 25% lighter than the density of NWC, which is between 2,200 and 2,600 kg/m3 [6]. The main specialties of LWC are its low density and thermal conductivity. Thus, LWC is an effective solution to reduce the dimensions of the structure members, hence, minimize the earthquake force on the building and economize the project. Akhtaruzzaman AA and Hasnat A [1] used brick aggregate to produce high-grade quality concrete with a unit weight of about 2 to 2.08 t/m3 and a modulus of elasticity about 30% lower than that of NWC. Mansur et al. [2] used four basic mixes with different grades ranging from 30 MPa to 60 MPa to assess the suitability of crushed clay bricks as the coarse aggregate. The resulting concrete had very poor workability, and the modulus of elasticity was significantly decreased. Besides, comparable compressive and higher tensile strengths than control specimens, a lower drying shrinkage than conventional concrete. The use of COBCB is one of the practical ways: it is not only economically sustainable, particularly, but also achieving a more environmentally friendly concrete [5]. LWC is defined as having an oven-dry density of up to 1,950 kg/m3; 25% lighter than the density of NWC, which is between 2,200 and 2,600 kg/m3 [6]. The main specialties of LWC are its low density and thermal conductivity. Thus, LWC is an effective solution to reduce the dimensions of the structure members, hence, minimize the earthquake force on the building and economize the project.
Crushed clinker brick was 33% lighter and more porous than ordinary crushed stone. In addition, a reduction of 9.5% in unit weight of crushed brick concrete led to an average loss of 7% in concrete compressive strength when compared with concrete made with natural aggregates [7]. Khalaf FM, et al. [8] studied the thermal properties of brick aggregate concrete and it was observed that at high temperatures, clay brick concrete behaved similar or even better than granite concrete. A good bond could be achieved between the brick aggregates and the cement paste due to the angular shape of the brick aggregates [9]. The compressive strength of concrete made with crushed brick aggregate was even attained with a reduction in concrete density of between 8 and 15% compared to concrete produced with granite aggregate. The modulus of rupture of concrete produced with crushed brick aggregate was approximately 8% less than concrete made with granite aggregate. Previous research Bektas, F [5], Debieb F and Kenai S [10], Cachim PB [11] and Dang J, et al. [12] showed that as the brick replacement ratio increased, the mortar flowability reduced. The 10% and 20% brick replacements had no negative effect on the mortar compressive strength and very limited effect on the mortar shrinkage. A decrease in strength ranging from 20% to 30% was found depending on the degree of substitution. Gautam VK and Jaysawal MD [13] investigated different concrete mixes of crushed over-burn brick concrete by substituting 25%, 50%, 75%, and 100% COBCB by volume for the granite aggregate. Results revealed that it can provide COBCB concrete with characteristics like those of granite aggregate concrete with 25% replacement. Nematzadeh M, et al. [14,15] reported that replacing 100% of natural fine aggregate with recycled refectory brick fine aggregate in the concretes exposed to heat increased compressive strength by 25% at 800°C. In addition, silica fume showed good performance in terms of retaining the compressive strength of heated concretes.
Recently, Debnath B, et al. [4] experimental test results confirmed that the water-cement ratio of the pervious concrete made from crushed burnt bricks as a fine aggregate should be within a specified limit of 0.3–0.32. Rashwan MMM, et al. [16] substituted the gravel aggregate with COBCB with different replacement ratios (0, 20, 50, 100%) by volume. The mix had a 20% replacement ratio and displayed an improvement in all mechanical properties, compressive, tensile, and flexure strength. Also, COBCB had a greater effect on internal curing compared with the other types of curing. Uddin MT, et al. [17] studied the flexural performance of 24 reinforced concrete beams made with recycled brick aggregate. Utilizing recycled brick aggregate in concrete does not reduce the cracking moment as well as the ultimate moment capacity of reinforced concrete beams. Also, ACI 318-14 [18] provisions can be used to safely predict the cracking and ultimate moment capacity of reinforced concrete beams made with recycled brick aggregate. Rasol MA [19] demonstrated that mortar without silica fume has lower strength than that with silica fume at a constant water–cement ratio, while adding 5% silica fume resulted in high compressive strength compared to the control one. This improved bond is caused by the conversion of the calcium hydroxide, which tends to form on the surface of aggregate particles, into calcium silicate hydrate due to the incorporated reactive silica fume in the concrete mix. According to Wang X, et al. [20], adding 5 wt% SF increased the corresponding compressive strength by 14.4%. Praveen K, et al. [21] studied the performance of concrete with brick aggregate and micro-silica admixture. Test results showed that the optimum dose of micro-silica is 10% as a replacement of cement for M30 concrete [22,23].
In this paper, to deeply understand the behavior of LWC made from COBCB, an experimental study was carried out to study the following items:
• Utilizing COBCB as coarse aggregate to produce LWC and make a comparison with NWC.
• Effect of silica fume on the concrete mix properties.
• Using different reinforcement ratios to reinforce the concrete beams.
• Effect of silica fume on the behavior of LWC beams.
It is expected that the results of this study will augment the remarkably limited number of research studies on the behavior of lightweight, eco-friendly concrete structural applications.
Experimental program
The following sub-sections will provide details on the properties of the various raw materials used as well as the test parameters studied in this study.
Materials
Ordinary Portland cement was used for all concrete mixes to make normal strength concrete. Local medium type sand was used as fine aggregate. Local gravel and COBCB were used as coarse aggregate to produce normal and lightweight concrete, respectively. COBCB was reduced in size by using a Morse Jaw Crusher as shown in Figure. 1. The properties of the different types of aggregates used in this study are given in Table 1. To provide an acceptable workability and strength for all concrete mixes, ADECRETE BVF was added as an additive having a density of 1,210 kg/m3 to improve the mechanical properties of the mix. The average particle size is 0.1 μm, the specific surface area is (12-15 m2/g), and the specific gravity is 2.2. The slump test was used to evaluate workability and compare the results to the Egyptian code [24]. High tensile steel bars with diameters 12 and 10 mm were used as tension and compression reinforcement, respectively. However, mild steel stirrups with a diameter of 8 mm were used as stirrups. The mechanical properties of the steel bars are given in Table 2. The values in the table are the average of three standard specimens tested.
| Property | Sand | Gravel | COBCB | |
|---|---|---|---|---|
| Specific gravity | 2.5 | 2.5 | 1.35 | |
| Unite weight (t/m3) | Loose | 1.44 | 1.56 | 0.98 |
| Compact | 1.6 | 1.67 | 1.03 | |
| Shape Factor | 1.18 | 1.13 | 1.16 | |
| Maximum nominal size (mm) | - | 40 | 40 | |
| Fineness modulus | 2.45 | 7.11 | 7.7 | |
| Specific surface area (cm2/gm) | 56.24 | 2.06 | 2.03 | |
| % Water Absorption (By weight) | 1.2 | 0.64 | 13.25 | |
| % of Chloride ions | 0.04 | 0.008 | 0.018 | |
| % of Sulphates ions | 0.129 | 0.012 | 0.04 | |
| Power of Hydrogen (PH) | 8.5 | 8 | 10.5 | |
| % of Clay and Other Fine Materials Content | 2.5 | 0.7 | 0.8 | |

Figure 1. (a) Morse jaw crusher, (b) bricks before crushing and (c) bricks after crushing.
| Diameter (mm.) | Yield Stress (MPa) | Ultimate Stress (MPa) | Elongation (%) |
|---|---|---|---|
| 8 | 362 | 491 | 29.03 |
| 10 | 420 | 622 | 18.0 |
| 12 | 450 | 654 | 20.54 |
Tested beams
A total of 15 RC beams were 280 mm in depth, 120 mm in width and had an overall length 2000 mm. All beams are provided with steel shear stirrups, which were 8 mm in diameter with a spacing of 100 mm and reinforced with two 10 mm steel rebars as top reinforcement. The beams were divided into five groups: the first group (control group) was made from gravel aggregate to produce NWC, while the other groups were made from COBCB aggregate for producing LWC, which differed in silica fume content (0, 10, 15, 20%) by weight of cement (Note: silica fume was added to the mixture not as cement replacement). Each group had three beams with various reinforcement ratios, ρ = 1.15, 1.92, and 2.69% as bottom reinforcement. Reinforcement details of the beams are shown in Figure 2. The beams were labelled as (X-Y-Z) according to weight, silica fume content and the amount of longitudinal tensile reinforcement. The letters X, Y, and Z indicate normal or lightweight concrete, silica fume content, and the number of reinforcing rebars, respectively. For example, N0-3 represents NWC beam made from gravel aggregate without silica fume and reinforced with three steel bars at the bottom, while L15-5 corresponds to LWC beam made from COBCB aggregate with 15% of silica fume and reinforced with five steel bars at the bottom. The details of each beam are presented in Table 3. Aside from beams, three concrete cubes, 150 mm side from each mix were also cast to determine the compressive strength of the produced concrete.

Figure 2. Details of reinforcement, typical cross-sections and test set up and instrumentations.
| Group | Beam | Silica fume content (% by weight of cement) |
Reinforcement |
|---|---|---|---|
| Group I | N0-3 | 0% | 3Φ12 |
| N0-5 | 5Φ12 | ||
| N0-7 | 7Φ12 | ||
| Group II | L0-3 | 0% | 3Φ12 |
| L0-5 | 5Φ12 | ||
| L0-7 | 7Φ12 | ||
| Group II | L10-3 | 10% | 3Φ12 |
| L10-5 | 5Φ12 | ||
| L10-7 | 7Φ12 | ||
| Group IV | L15-3 | 15% | 3Φ12 |
| L15-5 | 5Φ12 | ||
| L15-7 | 7Φ12 | ||
| Group V | L20-3 | 20% | 3Φ12 |
| L20-5 | 5Φ12 | ||
| L20-7 | 7Φ12 |
Mix design and specimens’ preparation
Five concrete mixes were designed to produce normal strength concrete having a 28-days cubic compressive strength of 25 MPa (N0, L0, L10, L15 and L20). N0 is a normal weight mix made from gravel aggregate as a coarse aggregate without silica fume. The rest of the mixes, L0, L10, L15, and L20 are lightweight mixes produced using COBCB aggregate with specific content of silica fume of 0, 10, 15, and 20% by weight of cement, respectively. The required free water to cement ratio is 0.48. It is worth mentioning that water absorbed by COBCB should be added to the mixing water as given in Table 1. The optimum dose of admixture super plasticizer ADECRETE BVF was determined, which results in appropriate values of workability and compressive strength. Table 4 shows the amount of constituent materials for 1 m3.
| Concrete Mix |
Cement (kg) | Silica Fume Content (kg) | Fine Aggregate (kg) |
Coarse Aggregate (kg) |
Water (L) |
Superplasticizer (L) | |
|---|---|---|---|---|---|---|---|
| N0 | 350 | 0 | 779 | Gravel | 1066 | 168 | 7 |
| L0 | 0 | 458 | COBCB | 635 | 168+84.14* | ||
| L10 | 35 | ||||||
| L15 | 52.5 | ||||||
| L20 | 70 | ||||||
Test program and instrumentation
The beams were tested up to failure under three-point bending loading conditions over a clear span of 1800 mm using a testing machine (EMS 60-ton hydraulic actuator). The load cell was used to measure the applied loads (with a capacity of 300 kN), and the LVDT was positioned at the bottom mid-span to measure the corresponding deflections. In addition, three electrical strain gauges were attached to the concrete surface at the compression zone at depths of 35 mm, 80 mm, and 130 mm. In addition, one strain gauge was bonded to the tension-steel bars, as shown in Figure 2. The data measured by different monitoring devices was then connected to a portable data logger (TDS-150), which was attached to a computer to record the readings at preset load intervals until failure of the beam occurred, as shown in Figure 3. Accompanying the beam test, cubes and prisms were tested on the same day as the beam testing to determine the properties of the concrete. The increment of loading equaled 5 kN and was constant for a period equal to 5 minutes. During the test, crack propagation was marked, and the corresponding values of loads, deflection and strain were recorded.

Figure 3. Actual test set-up
The experimental results obtained from the tests (such as the density, compressive strength, crack patterns and failure mode, load-deflection response, deflection capacity, ductility, energy absorption, and strains in concrete and steel) are presented and analyzed in this section.
Density and compressive strength
Table 5 shows the density of the produced concrete and the value of the recorded compressive strength, for all design mixes. It is observed that COBCB aggregate produced concrete with a lower density than the gravel aggregate concrete. The density of COBCB concrete without silica fume was 1,910 kg/m3, while it was 2,587 kg/m3 for the concrete made from gravel aggregate. The reduction in density was 26.17% when gravel aggregate was replaced with COBCB aggregate to produce LWC. This reduction is attributed to the low density of the COBCB aggregate. The values of concrete density presented in Table 5 are lower than the ones recorded by Akhtaruzzaman AA and Hasnat B [1] and Khalaf FM [9], who produced concrete made with crushed brick with a density of between 2,000 and 2,300 kg/m3 respectively. It is important to note that the suggested amount of silica fume has little effect on the density of the resulting concrete. Even with low density, all the COBCB concrete mixes showed an acceptable compressive strength compared to the gravel concrete. The compressive strength of LWC was lower than that of NWC. This is due to the higher crushing value of COBCB aggregate compared to gravel aggregate. Furthermore, as the silica fume content increased, so did the compressive and modulus of rupture. For example, the compressive strength of L0 was 27.51 MPa, which was increased to 33.82 MPa with the addition of 10% SF (L10). Furthermore, when the SF content was increased to 20% (L20), the corresponding compressive strength increased to 45.59 MPa, representing a 65.72% increase over its counterpart L0.
| Concrete Mix | Density of Concrete (kg/m3) |
Compressive Strength, fcu, MPa |
|---|---|---|
| N0 | 2,587 | 32.78 |
| L0 | 1,910 | 27.51 |
| L10 | 1,937 | 33.82 |
| L15 | 1,956 | 39.76 |
| L20 | 1,984 | 45.59 |
Strain distribution
The results of the distribution of strain over the depth for all tested beams are presented in Figure 4. Firstly, the beams behaved as linear elastic prior to tensile cracking of concrete, wherein the curvature or slope of the strain profile in tension equaled that of the strain profile in compression, suggesting that the beams behaved as Bernoulli-Euler beams at small deflections. This can be expected since at lower loads, the tested beams undergo minimal shear stress, which results in a small shear deformation. Regarding beams with low reinforcement, the inclined cracking started from bending cracks, then rapidly extended up to the proximity of the neutral axis and finally developed rather slowly, leaving only a very narrow depth of the compression zone unaffected. The area of concrete available to participate in the tension field ought to be confined to the uncracked region in the compression zone of the beam to resist the applied load. A possible reason for failure is rupture of the reduced compression zone in the beam. Therefore, the increment in the strain as the baseplate accelerates. Furthermore, stress redistribution occurs within the specimen where the neutral axis descended, and the height of the compression zone ascended.

Figure 4. Strain distribution of test beams: (a) beam N0-3, (b) beam L0-3 and (c) beam L10-3.
Crack patterns and modes of failure of tested beams
Figure 5 show the typical crack patterns for all tested beams. LWC beams showed clearly similar flexural behavior to NWC beams. The first crack was initiated in the maximum moment region (below the point load). As the load increased, more cracks were formed and propagated from the lower tension side upward toward the compression concrete zone. As the load increased, more cracks appeared along the beam and the cracks in the shear spans acquired inclination toward the central zone. Finally, the failure occurred when one or more cracks extended to the upper concrete fibers in the maximum moment zone. All beams exhibited flexural tension failure characterized by the yielding of steel bars in the tension zone. With regard to LWC beams, considerable crushing of concrete in the compression zone was observed due to ultimate loading after steel yielding. This could be attributed to the weakness of lightweight aggregate (COBCB) used in LWC beams compared to gravel aggregate used in NWC beams. Figure 6 presents the modes of failure of the tested beams. Clearly, the reinforcement ratio had a significant impact on crack propagation and failure mode for beams. From observation by the naked eye, as the longitudinal steel reinforcement increases, smaller crack width and depth were observed than the other beam specimens. Regardless of concrete type, beams with low reinforcement ratios, such as N0-3 and L0-3, not only exhibited large deflections prior to failure and more flexural cracks but showed more plastic deformations before the flexural failure as well. Thus, the severity of failure increased as the reinforcement ratio decreased. On the other hand, beams reinforced with high reinforcement ratios, for example, L10-7, observed more flexural cracks with narrower widths compared to L10-3 and L10-5. These findings tended to ensure the impact of reinforcement ratio in restraining the width and length of the cracks, by distributing the cracks efficiently along the span of the beam. In addition, crack patterns and final modes of failure are slightly affected by the amount of silica fume. It was noticed that beams containing SF evidenced fewer and thinner cracks due to the concrete’s higher strength compared to their counterparts without SF.

Figure 5. Crack patterns of the tested beams.

Figure 6. Failure modes of the tested beams.
Cracking load and moment
Initial cracking load indicates to the load corresponding to the first visible flexural crack. For the tested beams in the same group, the first crack was similar because the behavior of the beams at this stage was primarily governed by the gross-concrete section, and not the presence of reinforcing bars. Using LWC produces a little decrease on the cracking load due to the reduction in the compressive strength. The cracking load of N0-3, N0-5 and N0-7 were found to be 14.03, 16.39 and 19.18% more than L0-3, L0-5 and L0-7. Moreover, the latter beams displayed its first crack at load of 17.54 kN, 10.31 kN, and 18.46 kN. Whereas the third group L15-3, L15-5 and L15-7 which is casted with 15% SF, the initial crack began at a higher load value of 22.31 kN, 26.38 kN and 20.53 kN. Which means delaying of the first crack due to the improvement of compressive strength, therefore, high tensile strength due to introducing SF to the concrete mix?
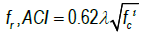
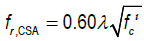
The experimental cracking moment, Mcr,exp was calculated corresponding to the first visible crack for each beam using Equation (1). The predicted cracking moment, Mcr,pre was determined using the expression given in Equation (2). The modulus of rupture fr value can be calculated using Equation 3 and 4 in accordance with the ACI 318-14 [17] and Canadian CSA- A23.3-14 [23], as follows:
 (1)
(1)
 (2)
(2)
 (3)
(3)
 (4)
(4)
Where Ig is the moment of inertia of the gross concrete section, yt is the distance from the extreme tension fiber to the neutral axis, λ is a reduction factor equal to 0.85 for structural LWC and 1.0 for structural NWC. Table 6 presents the ratio of the experimental cracking moment, Mcr,exp to those predicted by the ACI 318-14 and CSA- A23.3-14 design codes, Mcr,ACI, and Mcr,CAN, respectively. Comparisons of the cracking moment, ACI 318-14 equations yielded good yet conservative predictions, with an average Mcr,exp/Mcr,CSA of 2.27 ± 0.40. However, CSA- A23.3-14, showed very conservative results with an average Mcr,exp/Mcr,ACI of 1.92 ± 0.36. Such good agreement confirms the testing procedure, results of this study and implies that the ACI 318-14 and CSA- A23.3-14 code equations and recommended λ of 0.85 are acceptable for predicting the cracking moment of structural LWC beams.
| Group No. | Beam | Cracking Load (kN) |
Mcr,exp. (kN.m) |
Ultimate Load (kN) |
Mu,exp. (kN.m) |
ACI 318-14 | CSA-A23.3-14 | ||
|---|---|---|---|---|---|---|---|---|---|
 |
 |
 |
 |
||||||
| Group I | N0-3 | 20.15 | 9.0 | 87.32 | 39.29 | 1.90 | 1.16 | 1.96 | 1.17 |
| N0-5 | 12.36 | 5.4 | 129.34 | 58.19 | 1.14 | 1.11 | 1.18 | 1.12 | |
| N0-7 | 22.69 | 9.9 | 162.19 | 72.95 | 2.09 | 1.07 | 2.16 | 1.09 | |
| Group II | L0-3 | 16.2 | 9.9 | 75.93 | 34.16 | 1.74 | 1.05 | 2.12 | 1.03 |
| L0-5 | 10.08 | 11.7 | 92.37 | 41.54 | 1.05 | 0.85 | 1.27 | 0.83 | |
| L0-7 | 18.48 | 8.6 | 126.65 | 56.97 | 1.91 | 0.94 | 2.33 | 0.89 | |
| Group III | L10-3 | 24.45 | 10.8 | 88.57 | 39.83 | 2.25 | 1.19 | 2.73 | 1.18 |
| L10-5 | 21.72 | 9 | 107.42 | 48.15 | 1.97 | 0.94 | 2.39 | 0.92 | |
| L10-7 | 25.61 | 7.2 | 153.87 | 69.21 | 2.34 | 1.05 | 2.84 | 1.02 | |
| Group IV | L15-3 | 22.79 | 8.1 | 107.39 | 48.29 | 1.90 | 1.42 | 2.31 | 1.41 |
| L15-5 | 26.37 | 11.7 | 135.14 | 60.80 | 2.25 | 1.15 | 2.73 | 1.13 | |
| L15-7 | 20.14 | 4.5 | 172.63 | 77.67 | 1.73 | 1.13 | 2.10 | 1.10 | |
| Group V | L20-3 | 25.42 | 8.1 | 121.41 | 54.45 | 2.02 | 1.58 | 2.45 | 1.57 |
| L20-5 | 30.19 | 13.5 | 151.37 | 68.09 | 2.42 | 1.26 | 2.94 | 1.24 | |
| L20-7 | 26.43 | 11.7 | 182.35 | 82.04 | 2.10 | 1.15 | 2.55 | 1.13 | |
| Average Standard deviation Coefficient of variation (%) |
1.92 | 1.13 | 2.27 | 1.08 | |||||
| 0.36 | 0.04 | 0.40 | 0.05 | ||||||
| 18.52 | 3.73 | 17.48 | 4.68 | ||||||
Ultimate capacity
Table 6 illustrates the ultimate load capacity of the tested beams. Replacement of gravel aggregate with COBCB aggregate produced LWC had a significant effect on the failure load of the beams. It was evident that the failure loads of L0-3, L0-5 and L0-7 are 75.93, 92.37 and 126.65 kN, which is lower than the ultimate loads of N0-3, N0-5 and N0-7, which were observed to be 87.32, 129.34 and 162.19 kN. As mentioned before, the reason of the decrease in ultimate load is the weakness of the COBCB aggregate compared to gravel aggregate. Regardless of concrete type and SF content, the beam reinforced with the higher reinforcement ratio showed an increase in the ultimate load with respect to the beam reinforced with the lower reinforcement ratio. This might be clarified by the phenomenon that as the reinforcement ratio increased, the beam stiffness also increased. For example, increasing the reinforcement ratio from 1.15 to 1.92 and 2.69 for beams L10-3, L10-5, and L10-7 increased the ultimate load by about 20.90% and 73.79%, respectively. Due to containing 10% of SF, these beams also displayed an enhancement in the ultimate load by 16.60%, 15.63% and 21.48% higher than the beams L0-3, L0-5 and L0-7 without SF. This result is reliable with the results reported by Praveen K, et al. [21], when micro-silica is added, an improvement in the mechanical properties of concrete was observed owing to its high pozzolanic nature to form calcium silicate hydrate. Therefore, there is an enhancement in all the performance of the beam.
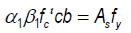
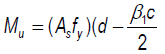
The moment capacities of the test beams from the ultimate load, Mu,exp were calculated using Equation 5, while the predicted ultimate moment capacity Mu,pre can be given from equations Equation 6a and b. The parameters, α1 and β1 were calculated from Equation 7 and 8, respectively, based on ACI 318-14 [17] and CSA- A23.3-14 [23].
 (5)
(5)
 (6-a)
(6-a)
 (6-b)
(6-b)
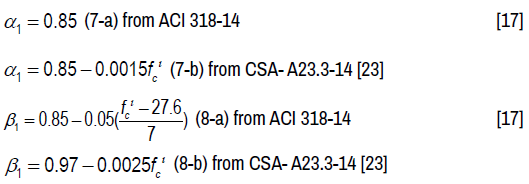
Where, As= area of tensile steel reinforcement (mm2), fy = yield strength of steel (MPa), fc' = compressive strength of concrete (MPa), d = effective depth (mm), and b = width of beam.
The accuracy of the available ultimate moment equations in ACI 318-14 and CSA-A23.3-14 design codes are assessed herein by comparing their predictions with the experimentally determined moment capacity of the 15 reinforced concrete beams. The safety factors included in all the ultimate equations were set to 1.0. The experimental-to-predicted ultimate moment ratios according to ACI 318-14 and CSA-A23.3-14. Mu.exp./Mu,ACI and Mu.exp./ Mu,CSA, respectively are reported in Table 4. From the predictions presented in Table 6, it can be concluded that both ACI 318-14 and CSA- A23.3-14 provisions showed reasonable yet conservative predictions, with an average experimental-to-predicted ratio of 1.13 ± 0.04 and 1.08 ± 0.05 and a COV of 3.73 and 4.68%, respectively. The comparison was suggesting the suitability of the various international codes equations in designing LWC beams made from COBCB aggregate with steel reinforcement.
Deflection
Figure 7 shows the relationship between the applied load, P and the midspan deflection (Δ) of each group of the tested beams. In order to understand the unique flexural behavior of LWC beams, the typical load-deflection curves are observed with two turning points: one is the cracking point, and the other one is the yield point. Hence, the load-deflection curve can be divided into three stages: the first stage is the uncracked response of the beams, represented by a linear elastic portion with a steep slope using the gross moment of inertia of the concrete cross section. As the applied load increased, another linear portion with a lower slopes seen, indicating the second stage or the cracked response of the beams. The secondary stiffness was affected by the reinforcement amount. High stiffness was observed when a large amount of reinforcement ratio was used. The third and final stage occurred after the steel bar yielded, the stiffness of the beam was significantly decreased, and the midspan deflection increased rapidly. As shown in Figure 7a-e, all beams satisfy the serviceability limit state requirement (SLS) for deflection (L/250). Uddin MT, et al. [17] also supported these results, because of the high reinforcement ratio made the beam stiffer, which resulted in lower deflections. At low and medium reinforcement, there was no significant effect on the cracked stiffness due to variation in concrete type, but, at high reinforcement, the cracked stiffness of the LWC beams was lower than that of the NWC beams, as shown in Figure 7f. Consequently, for the same applied load, the mid-span deflection in a L0-7 beam deflects more than that of an N0-7 beam. Besides, it was detected that the yield strength of NWC beams was slightly higher than the other groups of beams. The effect of SF on load-deflection curves with different main steel reinforcement ratios is shown in Figure 7g-i. Increasing the SF content with constant steel reinforcement ratio improves the flexural behavior and the stiffness, where 20% of the SF content by weight of cement decreases the deflection value by 4 times in comparison with 0%, especially after the cracking load.

Figure 7. Load-deflection relationships.
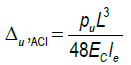
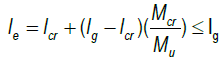
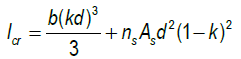
ACI 318-14 [17] proposed an equation for determining the maximum deflection at the mid-span for beams under three-point bending can be obtained from Equation 9:
 (9-a)
(9-a)
 (9-b)
(9-b)
 (9-d)
(9-d)
 (9-e)
(9-e)
 (9-f)
(9-f)

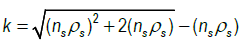
Where, a is the shear span, Pu is the ultimate load, L is the beam’s effective span and. Ig, Icr and Ie are the gross, cracked and effective moment of inertia for a reinforced concrete section. h is the height of the cross section and Mu is the ultimate moment. k is a factor that determines the height of the compressed area of concrete from the top surface. As and ρs are the total cross-sectional area of the steel rebars and the steel reinforcement ratio, respectively. n is the modular ratio between the steel reinforcement and the concrete. Es is the elastic modulus of steel.
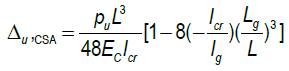
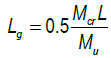
On the other hand, The CSA-A23.3-14 [23] gives an equation for estimating the maximum deflection as follows:
 (10-a)
 (10-b)
Where, Lg is the distance from the edge support to the point where the applied service moment is equal to the cracking moment.
Table 7 provides the experimental mid-span deflection, Δu,exp as well as those predicted by the ACI 318-14 and CSA-A23.3-14 design codes, Δu,ACI and Δu,CAN, respectively. Moreover, the table also gives comparisons between experimental ultimate deflections and those predicted by the ACI 318-14 and CSA-A23.3-14. This finding was observed by Alhassan M, et al. [25] experimental results found in this research also supported these results. The defection predictions are in better agreement with the experimental values with average experimental-to-predicted deflections of Δu,exp/Δu,ACI and Δu,exp/Δu,CSA of 1.67 ± 0.35 and 1.59 ± 0.35, respectively. It can be noticed that provisions yielded yet values, thus, ACI 318-14 and CSA-A23.3-14 can conservatively predict the deflection of LWC made from COBCB.
| Group No. | Beam | Mid-span Deflection | Ductility, µ |
Max. Steel Strain, με |
Max. concrete Strain, με |
|||
|---|---|---|---|---|---|---|---|---|
| ∆y (mm) |
Δu,exp. (mm) |
 |
 |
|||||
| Group I | N0-3 | 8.84 | 18.85 | 2.44 | 2.33 | 2.13 | 11475 | -2775 |
| N0-5 | 8.11 | 14.35 | 1.41 | 1.34 | 1.77 | 5400 | -2685 | |
| N0-7 | 9.29 | 12.90 | 1.18 | 1.12 | 1.39 | 5178 | -2946 | |
| Group II | L0-3 | 5.76 | 22.07 | 3.26 | 3.12 | 2.83 | 16000 | -3134 |
| L0-5 | 6.34 | 14.13 | 1.87 | 1.78 | 2.23 | 11375 | -1840 | |
| L0-7 | 7.81 | 12.25 | 1.36 | 1.29 | 2.17 | 9600 | -2866 | |
| Group III | L10-3 | 7.51 | 19.24 | 2.44 | 2.34 | 2.56 | 13988 | -2978 |
| L10-5 | 7.33 | 16.04 | 1.94 | 1.85 | 2.19 | 10386 | -2823 | |
| L10-7 | 8.86 | 12.77 | 1.18 | 1.12 | 1.92 | 8497 | -1365 | |
| Group IV | L15-3 | 6.81 | 17.83 | 1.74 | 1.66 | 2.47 | 9200 | -2932 |
| L15-5 | 7.89 | 15.92 | 1.52 | 1.45 | 2.02 | 7362 | -2514 | |
| L15-7 | 8.91 | 13.14 | 1.09 | 1.03 | 1.47 | 6119 | -1325 | |
| Group V | L20-3 | 2.26 | 15.74 | 1.32 | 1.26 | 1.84 | 4960 | -3011 |
| L20-5 | 4.24 | 13.15 | 1.07 | 1.02 | 1.91 | 5700 | -2667 | |
| L20-7 | 4.35 | 9.12 | 1.29 | 1.23 | 1.88 | 3692 | -2262 | |
| Average Standard deviation Coefficient of variation (%) |
1.67 | 1.60 | ||||||
| 0.3 | 0.80 | |||||||
| 49.81 | 50.24 | |||||||
Concrete and steel reinforcement strains
Figure 8 plot the relationships between the applied load and top concrete strain and bottom steel strain. All beams behave similarly, starting with linear elastic prior to tensile cracking of concrete, wherein the slope of the strain profile in tension equals that of the compression strain profile. This is evidenced by the fact that, at lower loads, the beams perform as Bernoulli-Euler beams at small deflections. Generally, at the same load level when the concrete strength did not vary significantly, the beams with higher longitudinal reinforcement ratio, ρ displayed lower concrete and reinforcement strains. In addition, increasing the reinforcement ratios restricted the growth of crack width in beams, as recorded from the lower tensile strain readings in the steel reinforcement. However, all beams showed a clear yielding of the steel bars. Figure 8f clearly depicts the influence of using SF on the concrete and reinforcement strains. Regardless of the reinforcement type and ratio, the concrete strains decreased as the amount of silica fume increased. This is caused by the high tensile strength, which delays beam cracking, and the higher modulus of elasticity, which contributes to reducing induced strains. Besides, the presence of SF exhibited lower strains in steel bars at early loading stages than in their counterparts without SF.

Figure 8. Load-strain relationships.
Table 7 gives the experimental maximum compressive strain from the top one, εcu, maximum tensile strains in the steel bars, εsu. The average εcu was equal to 4328 με, which was higher than the 3000–3500 με normally adopted for the analysis and design of conventionally reinforced concrete systems. The average εsue, equivalent to 3650 με, was higher than the yield strain of 2500 με, signifying that all the steel bars yielded before failure.
Ductility and energy absorption
The structural concrete element should significantly display deformation before collapse. The ductility index, µ in steel-reinforced concrete, is determined by the ratio of ultimate displacement, ∆u to that at yielding of the steel reinforcement, ∆y. Table 7 presents that LWC beams had a higher ductility index, µ than NWC beams. As stated before, LWC beams exhibited more ultimate deflection than NWC beams because the weakness of COBCB aggregate led to a higher ductility index. Further investigation, however, is needed. In addition, Figure. 9 shows the ductility of the beam is reduced with the increase in reinforcement ratio. The highest µ was obtained for beams that had the least reinforcement ratio (ρ=1.15%) and, conversely, the lowest value of µ was found for the highly reinforced beam (ρ=2.69%). In fact, increasing the silica fume content led to an improvement in concrete compressive strength, which resulted in lower values of maximum deflection. Therefore, better flexural stiffness due to the decreased number of formed cracks and their widening, then lower ductility index. The ductility reduced as the SF was added, but it is clearly detected that a significant enhancement in the strength of the beams occurred when SF was introduced to the concrete mix. So, the toughness and energy absorption results are more reasonable to consider in evaluating the influence of the SF on the overall flexural performance of the LWC beams. There is good agreement between the experimental results of this study and the results obtained by Uddin MT, et al. [16]. The main aim is to achieve a noticeable increase in strength while maintaining sufficient ductility.

Figure 9. Effect of different parameters on the ductility index, µ.
This study was conducted to investigate the potential of crushed over burnt clay brick (COBCB) to be used as coarse aggregate in concrete. Flexural tests were performed on LWC beams with different reinforcement ratios and silica fume content, and the results are compared with those of NWC beams. Based on the results of this investigation, the following conclusions are obtained:
• The density and compressive strength of the LWC made from COBCB as coarse aggregate was 26.17% and lower that their counterparts of NWC made from gravel. However, the reduction in compressive strength can be recouped by adding silica fume. Hence, the use of waste COBCB along with silica fume promises a sustainable approach to construction using lightweight, environmentally friendly concrete.
• All LWC beams showed typical structural behavior similar to NWC beams. In addition, as reinforcement ratio increases, the ultimate capacity increases. Increasing the reinforcement ratio from 1.15 to 1.92% for beams L10-3 and L10-5 improved the ultimate capacity by 20.90%.
• Adding SF by 10%, the ultimate capacity for beams L10-3 and L10-7 enhanced 16.60% and 21.48% compared to their counterparts without SF
• LWC beams exhibited a considerable amount of deflection, which provided ample warning of the imminence of failure. Moreover, the ductility of LWC beams was higher than that of NWC beams due to the weakness of COBCB.
• For all beams, ACI 31-14 and CSA- A23.3-14 equations in terms of cracking and ultimate moments can be used to give reasonable predictions for NWC and LWC beams. However, The deflection prediction gives conservative values with an average Δu,exp./Δu,ACI and Δu,exp./Δu,CSA of 1.67 ± 0.35 and 1.59 ± 0.35, respectively.
According to test results, COBCB assured its validity to produce structural lightweight concrete. This type of concrete can be used for the construction of residential and non-residential buildings in seismic areas. In addition, lightweight concrete can use for making a structure such as Precast wall blocks and panels, homes on weak foundations, roof and building aprons, partitions, boats, shipbuilding, lightweight blocks/bricks, thin shell roof structures, roof section in high-rise structures, doors, bridge decks, and girders, etc.
The authors would like to express their special thanks and gratitude to the technical staff of the structural lab of the Department of Civil Engineering, Faculty of Engineering at Assiut University.
Google Scholar, Crossref, Indexed at
Google Scholar, Crossref, Indexed at
Google Scholar, Crossref, Indexed at
Google Scholar, Crossref, Indexed at
Google Scholar, Crossref, Indexed at
Google Scholar, Crossref, Indexed at
Google Scholar, Crossref, Indexed at
Google Scholar, Crossref, Indexed at
Google Scholar, Crossref, Indexed at
Google Scholar, Crossref, Indexed at
Google Scholar, Crossref, Indexed at
Google Scholar, Crossref, Indexed at
Google Scholar, Crossref, Indexed at
Google Scholar, Crossref, Indexed at
Google Scholar, Crossref, Indexed at
Google Scholar, Crossref, Indexed at
Journal of Civil and Environmental Engineering received 1798 citations as per Google Scholar report


