Research Article - (2021) Volume 10, Issue 5
Received: 06-Apr-2021
Published:
30-May-2021
Citation: Fikadu Robi Borena, Teshome Seyoum. "Effect
of Drip and Furrow Irrigation at Different Irrigation Levels on Water Use
Efficiency and Economics of Maize (Zea Mays L.) at Werer, Middle Awash,
Ethiopia." Irrigat Drainage Sys Eng 10 (2021): 267.
Copyright: © 2021 Fikadu Robi Borena, et al. This is an open-access article
distributed under the terms of the Creative Commons Attribution License, which
permits unrestricted use, distribution, and reproduction in any medium, provided
the original author and source are credited.
Agriculture is the main contributor to the Ethiopian economy. Water is a vital resource to sustain civilizations and pecuniary development and most importantly agriculture. The field experiment was conducted at Werer Agricultural Research center to evaluate the effects of drip and furrow irrigation under different irrigation levels on maize water use efficiency. The experiment was laid out in a split-plot design where drip and furrow irrigations were assigned as the main plot and irrigation levels (100, 85, 70, and 55% of ETc) were assigned in the subplot arrangement with three blocks. The interaction effects of irrigation system and irrigation levels have shown a highly significant (p<0.01) effect on water use efficiency. The highest (2.38 kg/m3) and the lowest (0.81 kg/m3) water use efficiency were recorded from the plots treated with drip irrigation at 100% ETc and Alternative furrow irrigation at 100% ETc treatments, respectively.
Drip • Furrow • Main plot • Split plot • Subplot
The uniformity of the water distribution into the soil with a good application for adding water with alternative furrow surface irrigation interactive mainly associated with the soil state and field condition and practices for the implementation of the process of regular irrigation. Holding the current rates of agricultural water use efficiency constant, an estimated additional amount of 5700 km3 of fresh water will be required annually to meet the estimated food demand in 2050. Advance of water saving technologies in agricultural sector can alleviate the risk of water shortage. To cope up with periods of water shortage, efficient use of irrigation water is becoming increasingly important and water saving agriculture is an important option. Pressurized methods, such as sprinkler and drip irrigation, have proven to be successful in terms of water use efficiency and increased yield for a wide range of crops and environments. The identification of the best irrigation management strategies (methods, levels and timings) still remains an important issue in order to improve water management at farm level in semi-arid environments where water is scarce. Drip irrigation is an irrigation method that allows precisely controlled application of water and fertilizer by allowing water to drip slowly near the plant roots through a network of valves, pipes, tubing and emitters. Increasing the water use efficiency in semi-arid regions is very essential. Effectual irrigation systems design at farm level appear to be a very significant feature for the irrigated agriculture and a key factor due to the competition for water resources with other sectors and to allow the economic and environmental sustainability of agriculture. Rational scheduled irrigation programmes throughout the crop growing period, coupled with appropriate irrigation techniques that are applicable also in semi-arid environments, have been suggested in earlier studies. Maize is critical for food security in Ethiopia. Over 9 million smallholder farmers grow maize on about two million hectares (14% of total land area in Ethiopia) and around 88% of their production is used for food consumption [1]. The country needs to continue the recent observed increase in cereal yield (of which maize makes up the largest share) to maintain its current food self -sufficiency rate of 95% in 2050, as by as the population will have probably more than double and consumption per capita levels have increased in line with higher projected income level. This would be equivalent to a yield increase to around 50% of water limited potential yield of cereals. If the yield level stays at present level, Ethiopia will only be able to produce 40% of its cereal needs in 2050, which is a potential risk for food security. Crop failure due to moisture stress in Ethiopia is common experience especially in moisture stress area of the country which caused by low and erratic rainfall distribution. Different researchers worldwide and in the country also show the diverse effect of moisture stress on crop production. In view of the limited water resource in the semi-arid regions specifically, in middle Awash and the sensitivity of maize crop to moisture stress, this research is aimed at determining the water use efficiency and appropriate irrigation system during the maize crop growing period and produce optimum yield by using appropriate irrigation system with optimum irrigation amount that economically feasible.
Description of the study area
The experiment was conducted in the 2019/20 at Werer Agricultural Research Center experimental site, located in Afar Regional State and 280 km far away from Addis Ababa. It is located at 9° 16 ’8” latitude; 40°9’ 41”E longitudes and 740 m above mean sea level. According to the classification of Agroecological zones by Ministry of Agriculture and Rural Development the area is classified as semi-arid with average annual rainfall of 590 mm. Bestowing to meteorological data recorded at Agro meteorological observatory (Werer) the average minimum and maximum temperature is 19°C and 40.8°C respectively. The topography of the middle awash valley reflects the history of the middle awash valley, through which deposits from the Awash River have constructed an extensive alluvial plain. Gradients are generally very low, predominantly lying in the range of 1-2 percent [2]
Soil of the study are
The soils are brown and turn to dark brown when moist. Generally, the wide-spread occurrence of salinity and sodicity problem in irrigated area of Amibara District farms is mainly due to weathering of Na, Ca, Mg and K rich igneous rocks and poor irrigation water Management. Recent study indicated that the salt affected soils were generally clayey to silt clay loam in both soil types, slightly alkaline to strongly alkaline (7.53 to 8.45) and low in organic matter with high soluble salt (Figure 1).

Figure 1. Study Area Map.
Bulk density
The bulk density undisturbed soil sample of known volume was taken using core-sampler from six representative places in the trial plot at three different depths (0-30 cm, 30-60 cm, and 60-90 cm). The sampled soil was oven dried at 105 °C for 24 hours to a constant weight and weighed to determine the dry weight fraction. Then the bulk density was calculated as the ratio of dry weight of the soil to known cylindrical core sampler volume [3]
Vt Volume of core cutter (cm3)

Where : ρb Bulk density (g/cm3)
Mc Dry weight of soil (g)
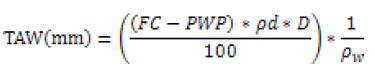
The total available water (TAW in mm) of the experimental field wasdetermined by using the following equation (Allen, 2000).
The moisture content (cm/cm) is obtained by following formula (Batjes, 2012).
Where,
TAW Total available water (mm)
FC Field Capacity (%)
PWP Permanent wilting point (%)
ρt Bulk density (g/cm?3)
D Effective root depth of crop(m)
ρw Water density (g/cm3)
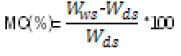
Where,
MC(%) Moisture content (gm)
Wws Weight of wet soil (gm)
Wds Weight of dry soil (gm)
Climate Condition of the Study Area
Werer Agricultural research center meteorological data shows that, the average annual rainfall is 590 mm, More than 85% of the rain occurs from June to September, with July and August being the wettest months. The average minimum and maximum temperature is 19°C and 40.8°C respectively. Mean relative humidity is lowest in June at 36% and the maximum in August which is 58%. Annual evapotranspiration rate of Amibara is 2829 mm. According to Werer Agricultural Research Center long term climatic data (1990 - 2019), the relative humidity ranges between 37 and 52.5%. The mean monthly rainfall distribution indicates that, July and August are the main rainy season followed by March and April (short rainy season) (Figure 2).

Figure 2. Climate of Study Area (1990-2019).
Yield Response Water
The water use-yield relationship was determined using the Stewart model in which dimensionless parameters in relative yield reduction and relative water consumption are used (Doorenbos and Kassam, 1979). The Ky is defined as decrease in yield per unit decrease in ETc (Lovelli et al., 2007).
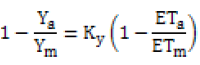
Where,
Ya Actual yield
Ym Maximum yield
Ky Yield response factor
ETa Actual evapotranspiration
ETm Maximum evapotranspiration
Experimental Treatments and Design
The experimental treatments include irrigation systems, viz., furrow (alternate furrow) and drip irrigation, and four irrigation levels (100, 85, 70 and 55% ETc). The experiment was designed as a split plot design experiment with three blocks. The experimental field was divided into 27 plots and a single plot size of 4.5 m by 6.0 m to accommodate six ridges with 6m length, representing a single treatment. The plots and blocks had a buffer zone of 1.5 m and 3 m length respective (Table 1).
| Main plot | Sub-plot | Treatment designation | ||||
|---|---|---|---|---|---|---|
| Irrigation level | ||||||
| Furrow Irrigation (MP1) | AFI | 100% ETc | T1 | |||
| AFI | 85% ETc | T2 | ||||
| AFI | 70% ETc | T3 | ||||
| AFI | 55% ETc | T4 | ||||
| Drip Irrigation (MP2) | DI | 100% ETc | T5 | |||
| DI | 85% ETc | T6 | ||||
| DI | 70% ETc | T7 | ||||
| DI | 55% ETc | T8 | ||||
Irrigation Scheduling
Atmospheric evaporating power (ETo)
Atmospheric evaporating power (ETo) expresses the evaporating power of the atmosphere at a specific location and time of the year and does not consider the crop characteristics and soil factors [4]
ETc=ET0*Kc
Where,
ETo Reference evapotranspiration (mm/day)
Kc Crop coefficient
To estimate the reference evapotranspiration by using or applying the FAO Penman-Monteith equation on a daily or shorter timescale, the equation and some of the procedures for calculating meteorological data should be adjusted for the smaller time step. Atmospheric evaporating power rate was estimated by the following equation (Allen et al., 1998)
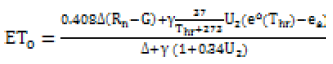
Δ Saturation slope vapour pressure curve at Thr [kPa °C-1]
Rn Net radiation at the grass surface [MJ m-2 hour-1]
G Soil heat flux density [MJ m-2 hour-1]
γ Psychometric constant [kPa °C-1]
Thr Mean hourly air temperature [°C]
eo Saturation vapour pressure at air temperature
ea Average hourly actual vapour pressure [kPa]
U2 Average hourly wind speed [m s-1]
Drip irrigation has been scheduled by considering the estimation of fraction of surface area wetted, depth of irrigation water applied, and wetted diameter of drip emitter. Therefore, two soil water distribution parameters has been taken as primary indicator of interest for describing water distribution around drip emitter and for irrigation scheduling. Those parameters estimated during the on field management of the experiment mentioned as follows.
Fraction of surface area wetted
Fraction of surface area wetted is estimated by the following e quation

Where,
P Fraction of surface area wetted
W Surface area wetted (m2)
Lr Plant row spacing (m)
Le Emitter spacing (m)
Depth application determined by using equation adopted from FAO (24).
 (8)
(8)
Where,
d Depth of application (mm)
TAW Total available soil water (mm/m)
Drz Plant root zone depth (m)
Ea Field application efficiency (%)
EUf Emission uniformity (%)
The number of days between irrigations during periods without rainfall. Irrigation interval have been determined by using the following formula
 (9)
(9)
Where,
i Irrigation interval (day)
ETc Crop Water Requirements (mm/day)
Working time was calculated by using the following equation
 (10)
(10)
Where,
T Flow duration (hr.)
qe Emitter flow rate (l/hr)
Irrigation was scheduled based on crop consumptive use rate and the amount of available moisture in the crop root zone.
Determination of drip lateral hydraulics
One empirical equation frequently used is the Hazen and Williams formula. Also, because of the possibility of laminar, turbulent or fully turbulent flow in trickles Darcy Weisbach equation was used to compute the head loss due to pipe friction
 (11)
(11)
Where,
Hf Head loss due to friction (m)
f Friction factor
L Length of pipe(m)
V Velocity(m/s)
g Acceleration due to gravity(m/s2)
d Pipe diameter(mm)
The flow variation have been estimated by the following formula

Where,
Qvar Flow variation
Hvar Pressure head variation
X=0.5 For laminar flow regime
Pressure variation along the drip line was estimated by using the following equation
Where,
Hvar Pressure head variation along the line
hmin Minimum pressure along the line
hmax Maximum pressure along the line
Results and Discussions
Effects of Irrigation System and Irrigation Level on Water Use Efficiency
The result of the study revealed that water use efficiency of maize significantly (p ≤ 0.01) influenced by furrow irrigation and drip irrigation. The highest water use efficiency was obtained from drip irrigation with 85% ETc (2.38 kg/m3) and minimum obtained from alternative furrow irrigation (0.81 kg/m3). Using drip irrigation system with 100% ETc shows that there is an increase the maize yield production by 57.53% and save 33.7% of irrigation water as compared to conventional furrow irrigation (farmers practice) but as compared to alternative irrigation with 100%Etc there is 71.5% of maize yield increment and 24.58% loss of irrigation water over alternative furrow irrigation. Deficit irrigation levels with drip irrigation has lower impacts on yields of maize grain production [5] (Table 2).
| Treat | BM | Yld | TSW | WUE | HI |
|---|---|---|---|---|---|
| AFI(100%ETc) | 13704b | 4753.1ef | 322.01ab | 0.81ef | 0.34efd |
| AFI(85%ETc | 14609b | 4711.9ef | 294.17b | 0.95ef | 0.32ef |
| AFI(70%ETc) | 12963b | 4732.5ef | 301.05b | 1.18de | 0.37cdef |
| AFI(55%ETc) | 13580b | 4043.7f | 258.02b | 1.26cde | 0.31f |
| DI(100%ETc) | 26132a | 16666.6a | 369.20a | 2.15ab | 0.64a |
| DI(85%ETc) | 24897a | 12962.9b | 332.24ab | 2.38a | 0.52b |
| DI(70%ETc) | 23251a | 9465.0c | 330.20ab | 1.77bc | 0.42bcde |
| DI(55%ETc) | 13992b | 6378.6ed | 289.43b | 1.56cd | 0.46bc |
| LSD | 3852.5 | 1680.4 | 53.01 | 0.56 | 11.10 |
| CV | 12.43 | 12.19 | 7.16 | 12.13 | 0.15 |
The result of using alternative furrow irrigation with 100% ETc shows that 32.8% of yield reduction and 49.99% saves irrigation water as compared to the conventional furrow irrigation. The result of the study revealed that using drip irrigation system with 100% ETc can increase the maize grain yield production by 57.53% and save 33.7% of irrigation water as compared to conventional furrow irrigation (farmers practice) but as compared to alternative furrow irrigation with 100% Etc there is 71.5% of maize yield Increment and 24.58% loss of irrigation water over alternative furrow irrigation.
Economic Analysis and Evaluation
According to CIMMTY (1988), the average yield was adjusted by 10% downwards. This is for the reason, researchers have assumed a better agronomic management and better application of wisdom than farmers. Based on this, the recommended level of 10% was adjusted from all treatments to get the net yield of maize Moreover, to attain the gross net benefits, it was vital to know the field price value of one kg of maize during harvesting time. The market price varies according to grain qualities. The gross returns were estimated by multiplying average market price rate with yield of respective treatments at the time of harvesting. The seasonal gross expenditure, net return and BC ratio for each treatment were estimated (Table 3).
According to the CIMMTY (1988) procedure for the dominance analysis, the treatment were arranged in their order of increasing total variable cost.
Treatment (T-3) showed that the least variable cost (13,500.00 birr) and treatment (T_6) showed the maximum variable cost (210538.00 birr) and all the remaining treatments were confined between these two treatments. As it is clearly indicated in table 3.Treatment (T-4) had TVC of (14,500.00birr) and a net benefit of (45,129.50 birr) was lower than treatment (T-6) as explained in the (table 4.9) however, treatment T-5,T-8 and T-9 are dominated and not included in further analysis of marginal rate of return. This dominated treatments have high total cost of variable but lower net benefit. Though, the rest of treatment had both higher variable cost and net benefit, hence not dominated and was considered for marginal rate of return. The economic analysis revealed that the highest net benefit of (251,146.2 birr) with higher total variable cost(210538.00 birr) was recorded from the application of 100%ETc with drip irrigation (T-6) and marginal rate of return 855.7%. The treatment (T-4) application of alternative furrow irrigation with 70% ETc gave the minimum benefit (45,129.50 birr) and marginal rate return of 774.10%. The minimum acceptable marginal rate of return (MARR %) should be between 50% and 100% CIMMYT (1988). This showed that T-1, T-2, T-4, and T-6 treatments are economically important as per the MRR is greater than 100%.Hence, the most economically attractive for small scale farmers with lower total variable cost and higher net benefits were in the application of alternative furrow irrigation at 70% ETc (T-4). Conversely, for resource full producers (investors), application of drip irrigation at 100% ETc (T-6) was also gainful with higher cost and highest net benefit is recommended as alternative option (Figure 3).
| Treat | UnYld (kg/ha) | AdYld | Tot/price | TVC (ETB) | NB (birr/ha) | MRR (%) | BCR |
|---|---|---|---|---|---|---|---|
| T-3 | 4711.9 | 4240. | 63,610.65 | 13,500.00 | 50,110.65 | - | 3.7 |
| T-5 | 4043.7 | 3639 | 54,589.9 | 13,500.00 | 41,089.95 | D | 3.0 |
| T-4 | 4732.5 | 4259 | 59,629.50 | 14,500.00 | 45,129.50 | 774.10 | 3.1 |
| T-2 | 4753.1 | 4277 | 62,027.96 | 14,821.55 | 47,206.40 | 645.90 | 3.2 |
| T-1 | 7078.2 | 6370 | 76,444.56 | 17,533.73 | 58,910.83 | 313.9 | 3.4 |
| T-7 | 12962.9 | 11666 | 349,998.3 | 198852.0 | 151,146.3 | 50.9 | 0.8 |
| T-9 | 6378.6 | 5740 | 172,222.2 | 198852.0 | -26,629.80 | D | -0.1 |
| T-8 | 9465 | 8518 | 255,555 | 198852.00 | 56,703.00 | D | 0.3 |
| T-6 | 16666.6 | 14999 | 449,998 | 210538.00 | 251,146.2 | 855.7 | 1.2 |

Figure 3. Economic return of drip and furrow irrigation.
The result of the study shows that, drip irrigation has improved water use efficiency by increasing yield of crop. The main objective of the study was to find the best irrigation system for maize production with higher water use efficiency with possibility of lower grain yield reduction of Maize production in limited irrigation water areas. Based on the objective, among the treatments used in this experiment, drip irrigation with 100% ETc was the best treatment selected to the investors and alternative furrow irrigation with 70% ETc selected for local farmers. When comparing drip with furrow irrigation there is a significant difference in grain yield production, yield parameter and water use efficiency.
Irrigation & Drainage Systems Engineering received 835 citations as per Google Scholar report


