Research - (2021) Volume 10, Issue 4
Received: 22-Feb-2021
Published:
22-Apr-2021
, DOI: 10.37421/2168-9768.2021.10.261
Citation: Nigusie Abebe, Elias Kebede, Yonas Derese, Fikadu Robi, Kebede Nanesa. "Determination Crop Coefficients and Water Requirement of Onion by Using Lysimeter at Werer, Middle Awash Valley of Ethiopia." Irrigat Drainage Sys Eng 10 (2021): 261.
Copyright: © 2021 Abebe N, et al. This is an open-access article distributed under the terms of the Creative Commons Attribution License, which permits unrestricted use, distribution, and reproduction in any medium, provided the original author and source are credited.
The development of crop coefficients (KC), the ratio of crop evapotranspiration (ETc) to reference evapotranspiration (ETo) is important for estimating irrigationwater requirements in relation to specific crop phenological development. This research was conducted to determine growth-stage-specific Kc and crop water use for onion at Werer Agricultural Research Center, Middle Awash Valley Ethiopia during the main season (July–October) and during cool cropping seasons (March–June) from 2012-2015. Three non weighing lysimeters of 1.6 m x 1.6 m in surface area and 2 m deep were used to measure crop water use and local weather data were used to determine the reference evapotranspiration (ETo).The results showed that the obtained Kc values for main cropping season planted onion during initial, crop development, mid season and late-season stages were 0.57, 0.78, 1.03 and 0.77 respectively. Meanwhile, the corresponding Kc values for cool cropping season planted onion were 0.49, 0.90, 1.01, and 0.79in the respective growth stages. The seasonal crop evapotranspiration was 525.83mm and 465.57mm during main and cool cropping season respectively. The measured Kc values were significantly different from the FAO-56 reported values. Therefore, local calibration of crop coefficients is an essential for efficient irrigation water management and precise water applications.
Onion • Crop coefficient • Growth stages • Water balance • Evapotranspiration • Lysimeter
Proper irrigation scheduling and efficient irrigation water management are crucial for the sustainability of irrigated agriculture. This is particularly important in the Middle Awash Valley, where continuous droughts, raising of salinity as a result of poor irrigation water management and increasing competition among irrigation water users have limited the availability of water supplies. Proper irrigation scheduling and efficient water management will be impossible without the exact estimation of crop coefficient values [1]. Crop coefficient is a key parameter commonly required for estimation of crop evapotranspiration, because it accounts biological characteristics of crops, crop condition, soil texture, soil tillage conditions and crop growing environment [2].
Crop coefficient is the ratio of crop actual evapotranspiration (ETc) to reference evapotranspiration (ETo) which can be calculated using the FAO-Penman- Monteith method [3]. The crop coefficient (Kc) values for the same crop may vary from place to place based on factors such as irrigation regime, management practices, local climate, soil types, and other environmental factors [4], and therefore, it is important to develop local Kc for accurate estimation of water use, under a specific climatic condition.
Several researchers have suggested deriving Kc locally for agriculture crops based on lysimeter data and local climatic conditions, which would be more relevant for quantifying site specific crop water requirements and for initiating sustainable management of water resources at the field, farm, or district scale [5]. Therefore, the proposed study was developed with the objective of determining crop evapotranspiration (ETc) and develop crop coefficients (Kc) specific to different growth stages for onion at Werer, Middle Awash Valley, Ethiopia.
The experiment lysimeter was conducted in non weighing lysimeters at Werer Agricultural Research Center. The experimental site is located at an elevation of 750 m altitude above mean sea level with latitude of 09°13 ′– 09°50 ′ N and longitude of 40°05 ′– 40° 25 ′E. The climate of Werer is semi arid.A mean monthly maximum temperature of 38.4°C was recorded during June and the lowest value of 14.9°C was measured during the month of December. The average monthly relative humidity was the lowest (40%) during June, while the highest value of 60% was observed during August. Average annual rainfall is 589 mm, of which 52% is received during July–September (Table 1).
| Month | Min.Temp (°C) |
Max.Temp (°C) |
RH (%) |
WS (m/sec) |
Sunshine (hours) |
ETo (mm/month) |
Rainfall (mm) |
|---|---|---|---|---|---|---|---|
| Jan | 16.0 | 31.6 | 55.0 | 2.8 | 8.8 | 168.6 | 19.3 |
| Feb | 17.3 | 33.3 | 51.0 | 2.7 | 8.8 | 167.9 | 26.2 |
| Mar | 19.2 | 35.0 | 51.0 | 3.1 | 8.5 | 208.3 | 72.6 |
| Apr | 20.4 | 35.7 | 51.0 | 3.2 | 8.4 | 209.8 | 75.3 |
| May | 21.0 | 37.4 | 44.0 | 3.6 | 9.2 | 247.0 | 26.6 |
| Jun | 23.6 | 38.4 | 40.0 | 5.2 | 8.7 | 290.0 | 25.3 |
| Jul | 21.9 | 35.2 | 54.0 | 5.0 | 7.2 | 235.3 | 123.1 |
| Aug | 20.9 | 33.5 | 60.0 | 3.6 | 7.3 | 192.8 | 131.1 |
| Sep | 21.0 | 34.7 | 56.0 | 4.3 | 8.1 | 214.9 | 50.5 |
| Oct | 17.6 | 34.1 | 51.0 | 3.3 | 9.1 | 210.8 | 21.7 |
| Nov | 15.0 | 32.4 | 50.0 | 2.9 | 9.4 | 178.9 | 12.1 |
| Dec | 14.9 | 31.4 | 53.0 | 2.6 | 9.1 | 164.3 | 5.3 |
Data were obtained from Were Agricultural Research Center. WS = wind speed and RH = Relative humidity
Onion evapotranspiration estimation method
The three lysimeters (non-weighing)type having dimension of 1.6m width x 1.6m length x 2m depth were used to directly measure onion evapotranspiration. Onion, Bombay variety was used as test crop. The crop was cultivated two times per year for three consecutive years of 2012-13, 2013-14 and 2014-15 during main and cool cropping season. In the area mainly onion production was two times per year during the main cropping season starting from May and during the cool cropping seasons starting from November. The seeds were drilled onto the well prepared raised nursery seed bed and covered with dry grass. Watering was done by using water can daily in the morning throughout the growing period of the seedlings in the nursery. The five weeks old onion seedlings from the raised nursery bed were transplanted in a row at row spacing of 60 cm and plant spacing of 10cm. All agronomic practices were done according to the recommendation made in the area.
Soil moisture measurement and irrigation application
Soil moisture content before and after irrigation of lysimeter was measured by Neutron moisture access tubes installed in the lysimeters. Measured soil moisture in weight basis was converted into volume basis by multiplying with bulk density. Drainage water fromlysimeter was measured by graduated cylinder and ETc was measured by water balance equations. The calculated onion crop evapotranspiration (ETc) was applied manually by using bucketof known volume when there was 25% depletion of the available soil moisture in the crop root zone,to avoid any water stress during the growing period (Figure 1).

Figure 1. Water application by using graduate cylinder to the Lysimeters and surrounded fields.
Reference crop evapotranspiration estimation method
Long term daily meteorological data, such as minimum and maximum temperatures, sunshine hours, wind speed and relative humidity recorded by Were Agricultural Research Center weather station was applied to Cropwat model version 8.0 to calculate daily ETo, based on FAO 56 Penman-Monteith equation(Allen et al., 1998)as follows using Eq. (1):
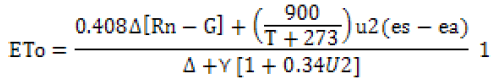
Where; ETo is the reference crop evapotranspiration (mm day-1), Δ is slope of the saturation vapor pressure curve (kPa-1), Rn is net radiation at the crop surface (MJm-2 day-1) , G is the soil heat flux density (MJ m-2 day-1), T is the mean daily air temperature at 2 m height (°C), U2 is the wind speed at 2 m height (m/s), es-ea is saturation vapor pressure deficit (kPa), es is the saturation vapor pressure at a given period (kPa), ea is actual vapor pressure (kPa), and γ is the psychrometric constant (kPa-1).
The FAO-56 Penman-Monteith method more advantages over many other methods because it is a physically based approach that has been tested using several lysimeters,it does not need other parameters than those regularly measures at most weather stations and it has been made available through CROPWAT software packages.
Onion evapotranspiration estimation method
The onion evapotranspiration was calculated using the change in soil moisture content and measurement of other water balance parameters from following water balance equationis given by Eq. (2):
ETc = P + I - R– D –ΔS 2
where ETc is the combined loss due to evaporation and transpiration from the lysimeter that stand for the crop water requirement, CWR, in mm, P is rainfall (mm), I is irrigation water applied (mm), R is runoff (mm), D is deep drainage of water below the root zone (mm), and ΔS is the change in water content inside the lysimeter (mm). In this experiment the contribution of runoff during irrigation events is nil because measured water was applied and the lysimeter is protected from incoming runoff by extended the rims on the lysimeter.
Crop Coefficient (Kc)
The Kc incorporates crop characteristics and averaged effects of evaporation from the soil, which is the ratio of ETc to ETo, and also integrates the effects of the filed environment, such as ground cover, canopy properties, and aerodynamic resistance. The onion crop coefficient (Kc) was determined as a ratio of crop evapotranspiration (ETc) to reference evapotranspiration (ETo) as suggested by Jensen (1968) and Allen et al. (1998):
Crop development stages
Allen et al. (1998) divided the crop cycle into four stages, namely initial, crop development; mid and late season stage. The initial stage refers to the period from germination to 10% canopy cover. The crop development stage denotes the vegetative period of the crop that includes from the end of the initial stage to full canopy cover (canopy cover 70 – 80%). The mid-season stage represents the period between full ground cover to the time of start of maturity (leaf yellowing, leaf drop, browning of fruit). A late season stage stands for the crop period from the end of the mid season stage to full maturity. The duration of each stage depends on the length ofthe growing season of a particular crop and climate (Doorenbos and Pruit, 1977; Smith et al., 1992). The duration of crops with respect to stage of growth is given in Table 2.
| S/N | Growth stage | Length of growth stages (day) |
|---|---|---|
| 1. | Initial | 25 |
| 2. | Development | 30 |
| 3. | Mid | 40 |
| 4. | Late | 25 |
| Total | 120 | |
Reference Evapotranspiration (ETo)
Table 3 shows values of reference crop evapotranspiration through the growth stages of onion during the main and cool cropping season. The values of ETo through growth season indicate that it is lowest with the beginning of the season and increased till development stage during both main and cool cropping season. This may be due to the changes in the climatic norms of the area, as the cultivation starts with both relatively low temperature and solar radiation and ended by high of it was. The total reference evapotranspiration value was 608.11 mm and 534.69 mm during the main and the cool cropping season respectively.
| Onion (Main season) |
Growth stage | Seasonal | ||||
|---|---|---|---|---|---|---|
| Initial | Development | Mid | Late | ETo (mm) | ETc (mm) | |
| ETo (mm/stage) | 72.23 | 151.82 | 271.20 | 112.86 | 608.11 | 525.83 |
| ETc (mm/stage) | 41.17 | 118.42 | 279.34 | 86.90 | ||
| Kclysimeter | 0.57 | 0.78 | 1.03 | 0.77 | ||
| (Cool season) | ||||||
| ETo (mm/stage) | 70.85 | 119.82 | 265.28 | 75.23 | 534.69 | 465.57 |
| ETc (mm/stage) | 35.07 | 107.66 | 267.93 | 57.56 | ||
| Kclysimeter | 0.49 | 0.90 | 1.01 | 0.79 | ||
Crop Evapotranspiration (ETc)
The crop evapotranspiration (ETc) during main and the cool cropping season was shown variation with growth stage (Table 3). The average stage- wise, ETc of onion planted during the main cropping season was 41.17 mm, 118.42 mm, 279.34 mm and 86.90 mm for the initial, development stage, middle-season stage and late-season stage, respectively. During the cool cropping season while it was 35.07 mm, 107.66 mm, 267.93 mm, and 57.56 mm for the initial stage, development stage, middle-season stage and late-season stage, respectively. The crop evapotranspiration (ETc) is low in initial and followed in late stage during both main and cool cropping season, which was due to low canopy cover in the initial stage and cessation of leaf growth in the late stage(Allen et al., 1998; Dirirsa et al, 2017). The seasonal ETc for onion was 523.83 mm and 465.57 mm during main and cool cropping season respectively. The mean seasonal value of ETc obtained during both main and cool cropping season was within the range reported by Doorenbos and Kassam (1979) for onion which varies from 350 mm to 550 mm depend on regions climate and variety.
As shown in the Figure 2a and b, the crop evapotranspiration (ETc) exceeded ETo only at the mid season stage, whereas in the rest stages ETo are higher than ETc during both cool and main cropping season. This indicates that during the mid season stage, the crop water demand is high because of the fully developed crop canopies and high evaporative demand to flower, fruit formation and filling. The result reported by Srinivasand Tiwari (2018) support this justification (Figure 2a, 2b).

Figure 2a. Reference evapotranspiration (ETo) and crop evapotranspiration (ETC) of onion planted during the main cropping season as a function of growth stage.

Figure 2b. Reference evapotranspiration (ETo) and crop evapotranspiration (ETC) of onion planted during the cool cropping season as a function of the growth stage.
Onion Crop Coefficient (Kc)
The average Kc values developed by the water balance method varied during cool and main cropping season was shown variation with growth stage (Table 3). The average stage - wise determined Kc values for onion panted during the main cropping season was increased from 0.57- 1.03 with crop development from the end of the initial stage to full canopy coverage, and thereafter, Kc decreased to 0.77 at crop physiological maturity. Similarly, the average determined Kc values for onion panted during the cool cropping season was increased from 0.49- 1.01 with crop growth stage from the end of the initial stage to full canopy coverage, and thereafter, Kc decreased to 0.79 at crop physiological maturity. The average Kc value was low at initial stage and high at the mid season stage during both main and cool cropping seasons. KC values for mid season in most crops are generally higher than those observed in other development stage (Allen etal., 2005 and Tyagi et al., 2004).During the mid-season stage, the highest value of Kc is obtained due to the crop attained peak value of leaf area index and maximum canopy cover, which leads to increase crop evapotranspiration (Jensen et al., 1990, Abedinpour, 2015; Srinivas and Tiwari, 2018). The KC tends to decline at a point after a full cover up to late or harvest stage during both main and cool onion growing season.
A comparison was carried out between the Kc values measured by lysimeter (Kc Lysimeter) and recommended by FAO 56.The Kc curve for onion developed in this study (Figure 3a and b) followed the similar trend with the estimated Kc curve by FAO 56 (Allen et al., 1998), where Kc is small at the beginning of the season and increases as the plant grows until it reaches a maximum value at crop maturity and decline in harvest during both cool and main cropping season.

Figure 3a. Crop coefficients recommended by FAO56 for the crop (Kc FAO) and determined by lysimeter (Kc Lys) during the main cropping season.

Figure 3b. Crop coefficients recommended by FAO56 for the crop (Kc FAO) and determined by lysimeter (Kc Lys) during the cool cropping season.
The Kc values obtained from the lysimeter during the main cropping season are slightly underestimated at initial and development and almost similar during the mid and late growth stage as compared to Kc values recommended by FAO 56 (Figure 3a). However as shown in Figure 3b, during main cropping season, the values are slightly underestimated at initial, development and mid stage and almost similar during the late stage as compared to Kc values recommended by FAO 56 (Allen et al., 1998).It is assumed that the different environmental conditions between regions allow variation in variety selection and crop developmental stage, which affect KC (Allen et al., 1998, Allen et al., 2005 and Ko et al., 2009). Such differences obviously reflect the difficulty not only in extrapolating crop coefficients to other environments, but also in applying crop coefficients to determine crop water requirement in individual year with differing crop development patterns (Daisuke et al., 2007 and Abedinpour,2016) (Figure 3b).
The present study was conducted with the objective of determining the ETc and Kc values by lysimeters and compares them with the values estimated by the FAO-56 method at the different stages of development of onion plants at Werer, Middle Awash. The results showed that the seasonal crop evapotranspiration (ETc) of onion were 525.83mm and 465.57mm during main and cool cropping season respectively. The average Kc values of onion planted during the main cropping season were 0.57, 0.78, 1.03 and 0.77 in initial, development, mid and late seasonal stage respectively. Meanwhile the Kc values of onion planted during the cool cropping season were 0.49, 0.90, 1.01 and 0.79 for the respective growth stage. The estimated values of crop coefficients for onion differ considerably during main season at initial and development stage and during the cool crop season at initial, development and mid stage from those Kc values suggested by FAO. Therefore, local calibration of crop coefficients is an essential for agricultural planning and efficient irrigation water management for cultivation of onionin the Werer and other similar semi-arid climates.
Irrigation & Drainage Systems Engineering received 835 citations as per Google Scholar report


