Research Article - (2022) Volume 12, Issue 6
Received: 03-Mar-2022, Manuscript No. JCDE-22-59142;
Editor assigned: 07-Mar-2022, Pre QC No. P-59142;
Reviewed: 21-Apr-2022, QC No. Q-59142;
Revised: 02-May-2022, Manuscript No. R-59142;
Published:
17-May-2022
, DOI: 10.37421/2165-784X.22.12.457
Citation: Ebsa DG, Dibaba WT and Balcha DB. "Assessing Sustainability Index of Urban Water Supply Distribution Network, a Case of Jaldu Town, Ethiopia." J Civil Environ Engg 12 (2022): 457.
Copyright: © 2022 Ebsa DG, et al. This is an open-access article distributed under the terms of the Creative Commons Attribution License, which permits unrestricted use, distribution, and reproduction in any medium, provided the original author and source are credited.
Background: The sustainability indexes in water distribution systems were measured for pressure junction and pipeline velocity based upon performance criteria (reliability, resilience, and vulnerability
Methods: The values of pressure and water velocity are used to determine these criteria, which Performances Sustainability Index (PSI) for pipeline velocity and PSI for pressure. The estimated PSI value evaluates the overall sustainability score for the entire zone in the water distribution network.
Results: This PSI was based upon performance for both pressure and velocity in the distribution systems by estimating its reliability, resilience, and vulnerability indicators through the systems. Therefore, the simulated hydraulic performance in the extended state was 19.6% high, 34.7% low, and 45.7% normal pressure junction due to low elevation and large pipe size. Whereas 6.4% is the lowest velocity <0.56 m/s and 11.8% is the highest water velocity >2.5 m/s recorded. Hence, for both pressure and velocity, the average reliability is 0.28, which is unsatisfactory, resilience 0.424, vulnerability 0.47. The overall sustainability index was 0.399, which represents the aggregate sum of the performance of the water supply distribution network based on the values of technical performance indicators, especially pressure and velocity.
Conclusion: Hence, the existing water supply distribution network of Jaldu town was unsustainable.
KAP • COVID-19 • Perceptions • Disinfection • Validity • Vulnerability • Iran
Rapid urbanization and climate change pose increasing pressures on integrated water resources management, especially in cities.
Increasing resulting from extreme events, such as floods and droughts, compel urban managers to strive for increased resilience. According to providing an adequate supply of safe water remains a preeminent goal of all urban water providers, of course, but the nature of the challenges inherent in continuously meeting that goal has changed dramatically since the first public water supply systems were developed thousands of years.
The earliest water supply systems date back to the period when human societies began shifting from hunting and gathering food and water to living in sedentary, agrarian communities. Thus, sustainability estimation procedures and methodologies would make it possible to translate today’s universally recognized priority objective into concrete applications.
Sustainable urban development must focus on the relationships between water, energy, and land use often on diversifying sources of water to assure reliable supplies. Hence, the sustainable water supply treasure the reliable and resilient approaches to various human needs for water for that does neither exhaust the water sources and the local economy nor have a long-term negative impact on the environment. Despite some shortcomings in their performance, urban water supply distribution has provided urban dwellers with water for years; nevertheless, there have been widespread criticisms of these systems functionality since the introduction of the sustainable development concept in the late 1980’s.
Therefore, the sustainability of the urban water distribution system has the vital persistence of supplying water for urban areas without interruption of the distribution. However, the sustainability index of urban water supply incorporates hydraulic parameters like junction pressure water velocity and leakage of water in the water distribution network.
The sustainability index of urban water supply was an estimation of the hydraulic parameters in the water supply distribution networks (Reliability due to pressure, Reliability due to velocity, Vulnerability due to pressure, andvelocity). The resilience and sustainability of urban water supply systems are challenged by global change pressures, including climate and land-use changes, rapid urbanization, and population growth. While the resilience and sustainability of urban systems are set as targets for policy and strategic management efforts, they remain the subject of ongoing scientific debate and agreed-upon methods to measure their attainment are lacking.
For estimation of sustainability index of hydraulic parameters of urban water supply, water GEMS tool was a power full application which was easily configured water supply distribution network and various industries were the company is using water. The main function of water distribution systems is to deliver water to consumers and a water distribution network, which is a part of the water supply system composed of a different set of pipes, hydraulic devices, and storage reservoir. Water distribution network connects consumers to sources of water using hydraulic components.
A distribution network may have different configurations depending upon the layout of the existing area, which may have different types of distribution networks for a configuration of the pipeline. Water GEMS tracks the flow of water in each pipe, the pressure at each junction, the height of water in each tank, and the attention of water throughout the network during a simulation.
Description of study area
This study was conducted in Oromia Regional State of Jaldu town, along the Addis Ababa-Gindbrat asphalt road about 72 km away from Addis Ababa. This town is located between geographical coordinates of 8º31’18.90” N to 8º32’25.46” N and 38º37’2.93” E to 38º38’19.03” E as shown in Figure 1.

Figure 1. Map of the study area.
Data and data processing
Input data collection for water GEMS: The input data required for hydraulic network modelling were associated with the component of the distribution network system. This data can collect in each node of the pipe link are, pipe labels, pipe material, pipe length, pipe diameter, starting node, stopping nodes, and pipe roughness are some of the pipe input data required for the modelling and simulation of the water distribution network sustainability.
The other input data associated are pressure junction at node/link, which includes junction label, junction elevation, and junction demand. Tank data required are base elevation, minimum elevation, maximum elevation, initial elevation, and tank diameters. The pump input data collection is design flow, maximum operation flow, design head, maximum operating head, maximum operating head, shut off design, and coordinates. Lastly, the source of water supply data with proper elevation and coordinate in the x and y-axis. In addition to the network pipe and node data, physical data must be obtained to that describing all valves and categories of water demand situations either in fixed or in pattern distribution networking.
Sustainability analysis
Reliability analysis of water supply distribution network: The reliability analysis of water supply was done by counting pressure and velocity under the permissible or satisfactory range to the ratio of total elements, which were found in the distribution networks with their respective variables.
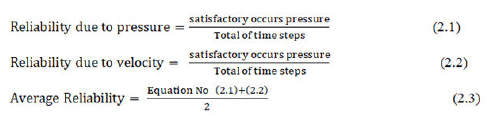
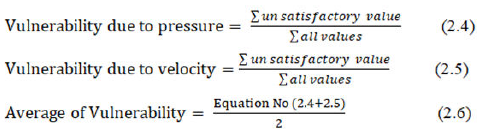
Vulnerability analysis of water distribution network: The summation of pressure and velocity value which have been below and above the satisfactory value which exists in distribution systems.
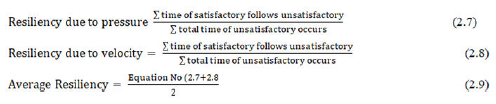
Resiliency analysis of water supply distribution network: The number of satisfactory values of pressure and velocity, which were, follows unsatisfactory values ratio.
Sustainability index: The sustainability index represents the aggregate sum of the performance of the water supply distribution network based on the values of technical performance indicators, especially pressure and velocity.
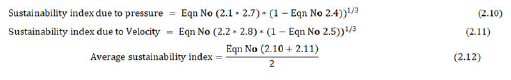
The overall sustainability index was computed by taking the average value of velocity sustainability index and pressure sustainability index, which characterizes the whole distribution, networks in the water supply.
Hydraulic performance analysis
The sustainability indexes analysis in distribution networks includes several hydraulic parameters like; water pressure, the flow rate of water, water velocity, head loss, capacity, and efficiency of pumps, reservoirs, and pipes.
Therefore, the component of the water distribution network has a great contribution to the hydraulic performance analysis and hence the value of each of its summations resulted to evaluate of its performance level.
Junction pressures performance
In the water distribution systems, pressure has two side effects (high water pressure and low water pressure or negative water pressure).
Adequate positive pressure should be provided throughout a distribution network to ensure adequate water service and protect the system against backflow. Thus, the normal pressures in the water distribution network should be range from a minimum of approximately 15 m H2O to a maximum of approximately 60 m H2O. The minimum pressure allowed in a distribution system is 10 m H2O and hence when pressures drop below 10 m H2O, a system could experience backflow conditions that could influence water quality.
Over junction pressure performance
The water supply distribution network should be designed to maintain a minimum pressure of 10-15 m H2O at ground level at all points in the distribution system under maximum day demand and fire flow conditions. Whereas the normal pressure in the water supplies distribution system were 15-60 m H2O, rare case 70-80 m H2O and (Figure 2) indicate the high-pressure junction.

Figure 2. High junction pressure recorded during extended state condition.
Among the existing total pressure junction, 18 nodes (J-182, J-104, J-150, J-105, J 103, J-95, J-161, J-122, J-52, J-113, etc.) is recorded ≥ 70 m H2O water pressure during this simulation as shown in Figure 2.
Thus, reducing high junction pressure will reduce the leakage flow rate as well as the possibility of pipe burst which frequent variations in pressure, are associated with a higher frequency of new leaks.
Mostly overpressure is reduced by using resizing pipe material and control valves, which are used to control the flow or pressure in a distribution system.
They are normally sized based on the desired maximum and minimum flow rates, the upstream and downstream pressure differentials, and the flow velocities.
Low junction pressure performance extended state condition
Pressure in an urban water system is typically maintained either by a pressurized water tank serving an urban area or by pumping the water up into a water tower.
Thus, to analyses the pressure performance indexes; it’s better to deal with which nodal demand is low and overpressure to calculate the summation of pressure contribution of a junction due to the change in demand at another junction.
Generally, about 34.7 % of the lowest water pressure occurred in the junction (J-220, J- 202, J-4, J-85, J-228, J-87, J-11, J-62, J-214, J-32, J-192, J-224, J-55, J-197, J-73, J-67) were recorded ≤ 15 m H2O due to high elevation and small pipe material diameters.
The pressure at nodes depends on the adopted minimum and maximum pressures within the network, topographic circumstances, and the size of the network.
The minimum pressure should maintain to ensure that consumers’ demand is provided at all times. This pressure junction is described from the distribution-networking layout of the water supply since the extended-state simulation as shown in Figure 3.

Figure 3. Lowest junction pressure performance since extended-state simulation.
Low and high-Pressure performance of contour maps extended state simulation
Normal contouring routines only include model nodes, such as junctions, tanks, and reservoirs whereas spot elevations are added to the drawing. However, this can build more detailed elevation contours and enhanced pressure contours.
These enhanced contours include not only the model nodes but also the interpolated and calculated results for the spot elevations. Thus, as described in Figure 1 and Figure 2 of the highest junction pressures in the distribution networks and the lowest junction pressure during the extended state of the simulation.
In the same manner, during this simulation, the low and high water pressure contour mapping was also identified as the following Figure 3 simultaneously and the Contour Smoothing option displays the results of a contour map specification as smooth, curved contours (Figure 4).

Figure 4. Low water pressure recorded of the contour during extended state simulation.
Pressure contouring maps of distribution networks during extended state simulation
The pressure of the distribution system was extrapolated by water GEMS to areas with pipe networks of 187 junctions. This extrapolation indicates the contour plot of pressure in the distribution system.
The pressure distribution is not an illustration of pressures at taps only, but it includes the pressure at all different nodes in the water distribution network system. The pressure contour plot works truly due to pump heads and flows. The pump curves and reservoir heads were displayed during the network analysis. There are extremes of high and low pressures throughout the system due to the topographic variation of the town. A pressure zone is defined as the area bounded by both a lower and upper elevation, all of which receive water from a given hydraulic grade line or pressure from a set water surface.
One usually provides the hydraulic grade line or more storage tanks located at the same elevations so they share high and low water surfaces (Figure 5).

Figure 5. Pressure junction contour maps during extended state simulation.
With the use of pressure zones, gravity service is provided and low pressure pumping from a treatment plant clears well or lower pressure zone storage tank only occurs to fill an upper zone storage tank. Pump control can be automated based on water levels in the storage tank.
When the tank’s level drops from water demands in the system, pumps in the lower zone activate and start to fill the tank and/or satisfy the demands. Since the pump’s design discharge pressure is set to overcome head loss enrooted to the tank’s high-water level, service taps essentially, receive the same pressure as they would if the water was flowing by gravity to them from the storage tank.
As described in the previous section, delivery pressures to service connections will be the difference between the tank’s water level, fewer head losses in the pipe, and less the ground elevation at the service connection. In addition, as stated, line losses are usually minimal since the pipelines are sized for peak flow conditions.
Pressure distribution during minimum hour consumption
During minimum hour consumption, 1.98% of residents get water at low pressure due to improper pipe size (the maximum diameters in this distribution zone is less than 40 mm), and this area is almost a long distance from the services reservoir.
Thus, the performance of junction pressure index at this minimum hour consumption rate was estimated as pre-described in equation 2.5 and which is for about 0.54. Additionally, in this distribution area the topographical it has a high elevation of the area, which creates a low level of reliability of water users on the supply system.
As shown in Figure 6, most of the identified nodes have pressure below 15 m H2O and some of the nodes have pressure above 70 m H2O. Thus, only 0.17% of the areas have pressure unfit to the recommended limit (15-70 m H2O) during minimum consumption of the extended-state simulation at averagely minimum water demand consumption.

Figure 6. Pressure Distributions during Minimum Hour Consumption.
Velocity distribution during peak hour consumption
During peak hour, water demand consumption for about 51.8% of velocity in the water distribution network is without the desired criteria of MoW 2006 hence only 30% distribution network was in standard value, whereas 6.4% and 11.8% of the velocity during peak hour consumption is less than 0.56 m/s and 2.5 m/s respect as shown in Figure 6.
The hydraulic parameters performance (velocity performance) in this distribution system at minimum hourly or average water day water demand consumption rate almost most of the pipeline were distribute water accordingly to water supply distribution guidelines.
However, some of them were beyond the standard level and below due to a mismatch of discharge flow versus the pipe size, due to this in certain areas even if at this minimum demand consumption rates it could not properly arrive at the required nodal demands.
In this session of peak hour, water demand consumption for about 97 of pipes lines conveyed 0.6-2 m/s of water flow velocity, which is in below standards level, whereas 56 pipelines distributed in normal and 34 of pipelines are distributed water flow without the limited criteria above the standards.
During this simulation model same as the selected junction in Figure 7; the water distribution network is low pressure in the distribution system due to the topographic variation of the town. The area of kebele keta near St. Church and mosques is marked by very low pressure <15 m.

Figure 7. Velocity distributions during peak hour consumption.
This minimum pressure should be maintained in the system to avoid the water column separation and to ensure that the consumer’s demand is provided at all times. As described in the following Figures 3, 8 and 9 the selected pipelines of water velocity within the pipe water distribution systems. Since this in same of the pipeline can be distributed in with the standard level due to its shortest length and small size of the pipe materials, in the same way, almost half of the selected lines were also distributed above and below the level of standard values throughout the pipelines as indicated in Figure 8 in the pipelines.

Figure 8. Flow of water in the selected pipes.
The velocity of water flow in a pipe is also one of the important parameters in hydraulic modelling performance evaluation of the efficiency of water supply distribution and transmission line.
The velocity ranges can also be adopted as the design criteria, low velocities for hygienic, while too high-velocity cause exceptional head loss reason are not preferred velocity distribution is also varying with demand pattern changes. At the peak time demand, the values are different as compared to minimum consumption hour and hence, water distribution network velocity during peak hour demand is concise in Figure 9.

Figure 9. Velocity distribution at peak hour consumption. Sustainability index.
The sustainability indexes levels against the flow velocity in pipes and the pressure of nodes (junction pressure). According to the value of excellent levels of performance index, shows 0.75, 0.5, and 0.25 describe the suitable, acceptable, and unacceptable performance of the system, respectively and this performance index, which is obtained from the penalty curves, are related to the elements of WDNs.
Accordingly, the results of finding for both pressure and velocity averagely its reliability 0.28 which unsatisfactory, resiliency 0.424, vulnerability 0.47. The overall sustainability index was 0.399, which represents the aggregate sum of the performance of the water supply distribution network based on the values of technical performance indicators, especially pressure and velocity.
Thus, the overall sustainability index was 0.399 off the estimated sustainability urban water supply indexes for the study, which indicates its unacceptable ranges according to the sustainability analysis indexes range.
The performance of the distribution system has shown 16.7% within allowable velocity, which is too low, and the pressure of consumption nodes has the performance of 39.9% nodes have acceptable pressure limits between (15-80 m H2O).
The average reliability, resiliency, and vulnerability value of the distribution network of sustainability performance indicators were 0.25, 0.5, and 0.75, respectively. This sustainability index was based upon performance for both pressure and velocity in the distribution systems by estimating its reliability, resiliency, and vulnerability indicators through the systems.
The results of finding for both pressure and velocity averagely its reliability 0.28 which under satisfactory, resiliency 0.424, vulnerability 0.47. The overall sustainability index was 0.399, which represents the aggregate sum of the performance of the water supply distribution network based on the values of technical performance indicators, especially pressure and velocity.
Google Scholar, Crossref, Indexed at
Google Scholar, Crossref, Indexed at
Google Scholar, Crossref, Indexed at
Journal of Civil and Environmental Engineering received 1798 citations as per Google Scholar report


