Murtala AM
Abstract
This study is about climate change and the implication it portends for rural resource elements in Katsina State. The research adopted a cross-sectional research design. Data for the study were generated from the administration of a questionnaire on respondents in the study area. The data obtained for the study were presented in tables and statistical diagrams. The findings include; the causes of climate change were noted to be emission of obnoxious gases such as CO2, CO, CH4, O3 and CFCs (17.35%) into the atmosphere, deforestation, land clearing/burning of bush for agricultural and constructional works (19.6%) heating of homes, burning of fossil fuels as well as the smelting of iron (15.8%), gas flaring and other industrial activities (15.6%) and volcanic eruption and other natural phenomenon (14.8%). The rural resources at risk due to climate change include vegetation cover (18.6%), Grasslands (20.7%), livestock and bush meat (17.9%), arable land (18.4%), water resources (15.6%) and fisheries resources (8.9%). The use of modern varieties of farm inputs (58.5%) and soil erosion prevention measures (45.8%) are some of the adaptation measures to climate change. The implication of the threat of climate change to the locals is that their major sources of income and livelihood is threatened, effects of which could escalate migration, crime, theft, hunger, malnutrition or death. As a result of the findings, the study thus recommends diversification of the sources of income, afforestation and reforestation and intensify campaign for the complete reduction in the emissions levels of obnoxious gases.
Keywords:
Rural-resources; Climate-change; Deforestation
Introduction
Climate change is any significant long-term change in the statistical properties (principally it is mean and spread) of meteorological variables of a region (or the whole Earth) over a significant period, regardless of cause. All the theories of climate change attempt to account for variations in the amount of solar energy received by the earth and the spatial and temporal distribution of the energy over time [1-5]. It has been noted also that sector-wise, the combustion of fossil fuels is the main source of carbon dioxide emission, followed by deforestation and land clearance for agriculture [2]. In the last decades, researches have shown that man can influence climate change through the following: a) alteration in the albedo of the earth surface as a result of deforestation, land clearing, for cultivation or construction and animal grazing; b) Increase in CO2 content of the atmosphere as a result of bush burning and burning of fossil fuels through transportation such as coal, gas, oil etc.; c) Interface and interference with ozone layer by pollution deriving from human activities. Currently, fossil fuel burning worldwide alone account for the release of about 6 million tons of carbon per year while deforestation and land clearance account for another 1 billion tones [6-13]. With respect to the contribution of individual countries to the emission of greenhouse gases, United State Environmental Protection Agency study estimated that in 1989 the United States of America which contains only 5% of the world’s population contributed the highest amount of 21%, followed by the Soviet Union to the European Economic Community [14-16]. The culpable culprits in the depletion of the Ozone layer are CFCs, CH4, N2O, CO2, a major cause of global warming the reduction in the global ozone layer has been noticed over the past two decades [17,18]. The contribution of chlorofluorocarbons (CFCs) to the depletion of the ozone layer and the subsequent causing of climate change is tremendous. On the other hand deforestation and the clearing of vegetated surfaces for road construction, building of houses, farming and timber logging have aided the phenomenon of climate change. Deforestation is a factor of climate change as it denies the earth's surface carbon exchange with the atmosphere, forest ecosystem loss; accelerates soil erosion, and reducing sink for pollutants [19].
Nevertheless, there are indicators of climate change. The indicators are provided that one could use to assess the evidence of climate change in a region [20]. These include increasing temperature, increasing evapotranspiration, decreasing rainfall amount in the continental interiors, increasing rainfall in the coastal areas, increasing disruption in climate patterns and increasing frequency and intensity of unusual or extreme weather-related events such as; thunderstorms, lightning, floods, droughts, unpredictable rainfall patterns, sea-level rise, increase desertification and land degradation, drying up of rivers and lakes and constant loss of forest cover and biodiversity.
Generally, it is anticipated that climate variability and change
in Nigeria will have an overwhelming impact on agriculture and land use, ecosystem and biodiversity, human settlements, diseases, livelihood, hydrology and water resources. It is also pointed out that, with respect to agriculture and land use, climate change will likely elicit a significant change in agricultural production both in terms of the quantum of products as well as the location or area of production [21,22]. Identification of a shift from the production of long duration guinea corm to millet, which requires a shorter duration of rainfall [19]. He further revealed in Borno, Yobe, Sokoto and Zamfara state the percentage production of Guinea corn and Millet was 70% and 30% respectively in 1980, as in the year 2000, it has changed to 40% and 60% respectively. This clearly shows that rainfall duration and amount is fluctuating in northern Nigeria.
Climate change has also been found to either dry up rivers or reduce their depth. This was also revealed that for the past 52 years (1950-2001) drastic ecological changes have occurred in the semiarid region of Nigeria [14,23]. While temperature has been on the increase, rainfall has been declining. This climatic change and the pressure on the land from farming, overgrazing, deforestation, and ndiscriminate bush burning have led to desert encroachment and its associated ecological degradation, such as loss of vegetal cover, crop failure, and water scarcity. For instance, Lake Chad, which had a mean depth of 3 m in the early 1960s, is less than 2m as at 2000. The surface area of the lake which was 23,500 km2 in 1963 has shrunk to between 2,300 km2 and 2,500 km2.
Nigerian urban centres have been feeling the impacts of climate change with incessant annual flooding that affect large areas and a large number of people. For example, in 2010, flood in Northern Nigeria affected 2 million people in Jigawa State and another 40,000 people were displaced in Sokoto State where Usmanu Dan Fodio University was forced to close down for weeks as a result of bridge collapse associated with the flood. Similar floods were reported in Lagos where 689 people were to be relocated in Ajegunle as a result of the flood [1,20,24].
Available evidence also shows that climate change in Nigeria has impacted on crop production and livelihood. It has been pointed out that, there is an increase in rainfall amount in the coastal areas since the 1970s, and a constant decline in rainfall amount and duration in the continental interior of the semi-arid region of Nigeria [14]. The increasing temperature and decreasing rainfall in the semi-arid region of Northern Nigeria- Sokoto, Katsina, Kano, Nguru and Maiduguri may have resulted in the increasing evapotranspiration, drought and desertification in the region. offered MBA degrees with an agriculture specialty, it is obvious this type of a degree is applicable to many employment fields. There are a variety of fields available for study, which would allow all potential students to choose a college with a specialty degree of their liking whether it is business or hands-on farm oriented. I have concluded from my study that a Master of Business degree with an agriculture specialty is a viable degree that is relevant to a divers employment field.
Furthermore, between 1901 and 2005 temperature increase of 1.1°C was observed in Nigeria for the 105 years while the rainfall amount dropped by 81 mm. whereas the rainfall amount is generally decreasing in Nigeria, the coastal region of the country has been experiencing slightly increasing rainfall since the early 1970s. The short-dry-season popularly known as August break is currently being experienced more in the month of July as against August. Sea-level rise is observed to have inundated 3400 km2 of Nigeria coastal region while desert encroachment is reducing arable lands from the northern part of the country by 1-10 km a year [21,22]. A shift in crops cultivated by farmers from long to short duration is also noticed. Looking at these established facts, it is therefore feared that the impact of climate change is impacting natural resources and by extension the income of the people. This study thus investigated the climate change problems and the implication for rural resource elements in Katsina State.
Material and Methods
Katsina state is located approximately between latitude 12°15’00” and 12°25’00” N and longitude 7°30’00” and 7°500”00” E of the Greenwich meridian (Figure 1) (National Geo-Spatial Intelligence Agency, 2015).
The area enjoys a hot semi-arid climate according to the Koppen climate classification system. The temperature of Katsina is usually high all year round with the highest values from the months of January to May being within 43°C to 56°C and the lowest values from the months of June to September about 12°C and again rises from the months of November and December being 63°C to 125°C (Climate Datasheet for Katsina state, 2012).
The vegetation of Katsina state is the Sudan Semi-Arid enriched with varieties of Grasslands, Shrubs, trees and the spare droughtresistant trees [21]. Many of the trees are also resistant to fire as they are involved in Nitrogen fixation and also provide shades and nesting sites for animals. The predominant animals of the Sudan Savanna vegetation belt of Katsina are the Grazers, Kangaroos, Antelope, Rodents, birds, insects and reptiles. There is usually about 50-150 cm of rain per year which is not distributed evenly throughout the year [20].
The people of Katsina state are mainly agricultural and fishing society. They cultivate rice, yam, millet, Guinea corn, onions, tomatoes, sorghum, maize [25]. Due to the availability of vast landmass, the people practiced large scale cultivation of crops and commercial agriculture [6]. The people also engage in artisan fishing as there is the presence of several rivers and water bodies in the state. Also, trading, craft making such as the building of cane chairs, hats boat making, etc. to earn a living. These activities are tremendously important as they provide huge economic potential to the people of the area. A huge amount of revenue is generated and the people in the rural areas depend on the revenues from them. The people also engaged in wanting wildlife, lumbering and local craft production. The people also engaged in a local cottage industry in which they produced goods that are sold to the outside world. They produced groundnut, groundnut oil and sugar. These activities the Katsina people engage in are activities that can easily be affected by climate change. This research adopted a cross-sectional research design. The data for this study were generated from the administration of a questionnaire on respondents in the study area. As for the
Lorena De Medina-Salas
Abstract
Although most of the developing countries have serious problems with the issue of waste management, there have been some success stories including the development of environmental public policies, which had led to better life quality. In most developing countries, waste management considers only two stages: collection and final disposal. The collection system does not include a differentiated collection of the municipal solid waste (MSW), this implies that the valorization of the different waste fractions becomes more difficult to separate and most of them are dumped on uncontrolled sites. Meanwhile, the landfilled sites are limited and usually are about to exceed their capacity. In certain rural and semi-urban localities is common the practice of burning their waste, polluting the air, soil and even water. Local authorities are making some efforts to prevent this type of pollution, but it does not always work properly. However, there are certain successful cases like Teocelo, Veracruz in Mexico. This is a semi-urban locality where the inhabitants have been contributing to waste management in different ways since the year 2000. All the people separate their waste in organic and inorganic. Only the inorganic fraction is managed to the collection system, while a part of the organic fraction is usually composted in homes and the rest is treated in a composting plant. Until now, people of the locality keep this way of living and consider that the care of the environment is important for this generation as well as the new ones
Keywords: Municipal solid waste (MSW); Developing countries; Waste management; Collection; Final disposal
Introduction
Developing countries are those nations that have low living standards, undeveloped industrial base and low human development index; economically and socially trying towards betterment by economic and social maintenances and proper policy implementation and have an annual per capita income between US$875 and US$10,725 [1].
Around the world there are about 145 developing countries facing similar problems due to urbanization, economic activity and quality of life that have caused an increase in the consumption of products and services in the population, accelerating the waste generation [2].
In 2016, the world generated 2.01 billion tons of waste, but global waste is expected to grow to 3.40 billion tons by 2050. The Latin American and the Caribbean region generated 231 million tons of waste and the municipal solid waste (MSW); East Asia and Pacific 468 and Middle East and North Africa 129 million tons of waste. In addition, generation per capita was 0.99, 081 and 0.56 kg per inhabitant a day, respectively. The main categories of the average waste composition for the three region included: food and green 52-58 %, paper and cardboard 13-15 % and plastic 12 % [3]. Table 1 shows some examples of cities from different parts of the world including the MSW generation per capita.
In developing countries, most of the MSW generated is disposed in landfills and open-air sites causing serious risks to public health and environment. In addition, in highly populated countries such as China, India, Turkey, Mexico, and Brazil, almost 90% of the solid waste (major part is organic), considered as the principal source for producing methane is usually destined to landfills and dumps generously liberating huge quantities of carbon dioxide and methane to the atmosphere [4].
Shobitha Sunil
Abstract
Air pollution has become one of the most hazardous global concerns, killing an estimated 7 million people worldwide every year. Bengaluru, the city of India’s high-tech industry has been developing economically scaling up the luxuries of living lifestyle. Due to the rapid development of this metropolitan city, it has been facing deteriorating environmental conditions. The sole objective of this paper is to critically analyze the air pollution trend from 2011- 2018 at various industrial, residential, sensitive and moderate locations in Bengaluru on various factors that contribute to air pollution.
Keywords: Air Pollution; Environment; Bengaluru
Introduction
Collection of certain pollutants in the air which counter affects the health of a wellbeing human, animal and plant life is known as air pollution. According to the World Health Organization (WHO); 1.4 million deaths from strokes every year, 2.4 million deaths from heart diseases every year, 1.8 million deaths due to lung disease and cancer every year and 7 million premature deaths every year are attributable to air pollution. Air is everywhere and so is its influence polluted air can adversely affect the human health, buildings, monuments, plants, ecosystems and the list is endless. Polluted air has been linked to climate as particulate matter absorbs or reflects sun light and affect cloud formation and rainfall pattern of a place [1].
Pollutants such sulphur dioxide, nitrogen dioxide and carbon monoxide are released into the atmosphere through various combustion processes; burning of fossil fuels such as coal, oil, natural gas and gasoline are the main sources of these pollutants. Particulate matter pollutants is a mixture of solid particles and liquid droplets that are added into the air by dust ash, fly ash, soot, smoke, aerosol and condensing vapors suspended in the atmosphere for longer periods of time [2].
Bengaluru is often manifested through the arduous battles that are fought by the citizens to save the city. The IT capital of the country has an ever growing population, now estimated to be over 1.2 crore [3].The rise in the population is directly related to the rise in the number of vehicles, around 1750 new vehicles are getting registered in the city every day and the vehicle population in Bengaluru has crossed 80.45 lakhs [4]. This has substantially had a tremendous effect on the city’s ambient air quality and health. This paper is an attempt to analyze the critical pollutants such as SO2,NO2 and RSPM, together constituting the Air Quality Index, using this information this paper also tries to analyze the general health effects these pollutants cause on both long and short term exposure. Due to the socio-economic and environmental challenges associated with rapid urbanization, it is connected with increasing levels of ambient concentration of air pollution. Main contributor of air pollutants in Bengaluru is the transport sector.
In the year 2018, there has been a report that the number of vehicles in Bangalore has crossed 80 lakhs, by this number we can estimate the amount of unprecedented emission into the air that is going to pollute the air up to a great extent. Increase in number of non transport vehicles (mostly two wheelers) is caused due to the rapid expansion of city without development of proper infrastructure. These vehicles not only cause emission of RSPM, SO2 and NO2 but also HC and CO which has led to increase in their concentration in air. Diesel consumption in vehicles emits SO2 and particulate matter of all size. Particulate matter of size less than 2.5 and 1 μm is expected to have increased due to increase in consumption of diesel. High concentration of RSPM level due to construction activity can be managed if propercare is taken during construction [5].
On a global perspective, the effect particulate matter has proven that women are at a greater risk and also sometimes fatal due to prominent effect of particulate matter. Women showed a relative risk for fatal CHD of 1.42, 1.38, and 1.22 with each increase of 10 micrograms per cubic meter (μg/m3) of airborne PM2.5, PM10 – 2.5, and PM10, respectively, in the air pollution they encountered during the four years preceding death. Postmenopausal women showed higher relative risks of 1.49, 1.61, and 1.30 for each 10 μg/m3 increase in PM2.5, PM10–2.5, and PM10, respectively. Neither O3, SO2, nor NO2 was associated with fatal CHD on its own. O3 and to a lesser degree SO2 (but not NO2) increased the effect of all sizes of PM [6].
Population increase causes a significant positive impact on ambientc air pollution [7]. Demand for land, food, transport, energy, natural resources and environmental infrastructures increases with the population rise and ecological balance is disturbed which in turn increases human and socio economic activities leading to increase in ambient air pollution. Backbone of economic development is energy consumption. However environmental pollution and its degradation are caused by unsustainable production and consumption patterns [8]. Reduction in life expectancy and increasing mortality is significantly caused by increased ambient air pollution. However, sustained economic development, along with energy efficiency are potential options for reducing ambient air pollution while improving quality of life and environmental sustainability [9]. By evaluating all the analysis done by various other researchers, RSPM contributes the most to the air pollution throughout the world. In the recent past all the other gaseous components seems to be under control except for the levels of RSPM.
Materials and Methods
Field sampling
Under National Ambient Air Quality Monitoring Programme (N.A.M.P), Karnataka State Pollution Control Board is monitoring Ambient Air Quality at 7 ( Graphite India Limited, KHB Indl Area, Peenya Industrial area ,Victoria Hospital , Amco batteries, Yeshwanthpur Police Station and International Machine tools accessories at Peenya ) locations using ‘ Respirable Dust Sampler’ (RDS) in Bangalore City by Conventional method. Four air pollutants viz., Sulphur Dioxide (SO2), Oxides of Nitrogen as NO2 and Suspended Particulate Matter (SPM) and Respirable Suspended Particulate Matter (RSPM/PM10), have been identified for regular monitoring at all the locations. The monitoring of pollutants is carried out for 24 hours (4-hourly sampling for gaseous pollutants and 8- hourly sampling for particulate matter) with a frequency of twice a week, to have 104 observations in a year.
Data Quality
A majority of the air pollution monitoring stations across the country are operated manually and it is unclear how the 8-h samples are used for regulatory purposes of assessing whether locations are meeting the 24-h NAAQS, since an 8-h sample only captures a snapshot of the actual levels. Further, it is likely that singular pollution episodes are either not accounted for, or have an undue influence on the measurements resulting in under- or over-reporting of PM10 concentrations. Manual monitoring also results in a delay in data collection, transmission, and availability, although the increasing number of CAAQMS are allowing data to be streamed to the CPCB website in near real-time overcoming some of the aforementioned concerns [10].
Calculation of AQI
On the Field Data Log, fill in the top portion of the form including: the date/time of visit, the site identification, sampler identification, site name, filter ID number, sample start and stop dates and times, and field operator initials. 10^3=unit conversion factor for milligrams (mg) to micrograms (µg)
The index of specific pollutant is derived mainly from the physical measurement of pollutants like SPM, RSPM, SO2 and NOx. There are several methods and equations used for determining the AQI. In the present study AQI for each location in the study area has been estimated with the help of a mathematical equation given below.
AQI=1/3[{SO2/SSO2}+{NOX/SNOX}+{RSPM/SRSPM}}] × 100
Where,
SO2=Individual Values of sulphur dioxide
NOX=Individual values of oxides of nitrogen
RSPM= Individual values of Respirable suspended particulate matter and SSO2, SNO2 and SRSPM=Standards of ambient air quality of sulphur dioxide, oxides of nitrogen, Respirable suspended particulate matter [11].
Calculation of Exceedance Factor
Also, the Central Pollution Control Board (CPCB) developed a formula known as the Exceedance Factor (EF) so that it is easy for everyone to understand the pollution level.
EF=Observed Annual Mean of Criteria Pollutants/Annual Standard
For Respective Pollutant
Therefore, Air Quality can be classified into the following:
Critical Pollution (C):EF>1.5
High Pollution (H): EF belongs to [1.0-1.5]
Moderate Pollution (M): EF belongs to [0.5-1.0]
Statistical Analysis
The statistical analysis was performed using Microsoft Excel 2010 to obtain graphs with respect to the trends that are being observed in the obtained data from KSPCB. Along with excel, we also used R Software to analyse the relationship between the pollutants and the Air Quality Index. Pearson correlation analysis (CA) was employed to analyse theinner relationships among elements.
Results and Discussion
Air pollution measurement in Bengaluru
Under the National Ambient Air Quality Programme (NAMP), the Karnataka State Pollution Control Board (KSPCB) has installed pollution recording apparatus at various locations throughout the city (Table 1). In this paper, the following locations are used for the analysis:
• ITPL (Industrial Belt)
• Yelahanka (Industrial Belt)
• Peenya (Industrial Belt)
• Yeshwanthpur (Residential Belt)
• S.G.Halli (Residential Belt)
• Amco Batteries (Moderate Belt)
• City Railway Station (ModerateBelt)
• Victoria Hospital (Sensitive Belt)
Also, the Central Pollution Control Board (CPCB) developed a formula known as the Exceedance Factor (EF) so that it is easy for everyone to understand the pollution level.
EF= Observed Annual Mean of Criteria Pollutants/Annual Standard For Respective Pollutant Therefore, Air Quality can be classified into the following:
• Critical Pollution (C): EF>1.5
• High Pollution (H): EF belongs to(1.0-1.5)
• Moderate Pollution (M): EF belongs to(0.5-1.0)
• Low Pollution (L): EF <(0.5-1.0)
Otieno AA
Abstract
Physico-chemical parameters were studied in five stations along River Kisat from March, 2016 to August, 2016. The aim of the study was to establish whether the river water meets the set quality standards for surface water. It was established that the river water is negatively impacted by wastewater from various human activities along the stretch of the river. The averages of the physico-chemical parameters were; electrical conductivity 657.27 ± 208.78 µ cm-1, temperature 24.84 ± 0.65°C, pH 7.87, dissolved oxygen 4.19 ± 0.7 mg l-1, turbidity 89.90 ± 9.76 NTU, flow rate 0.14 ± 0.05 ms-1, total alkalinity 150.85 ± 28.23 mg l-1, total nitrogen 885.39 ± 227.56 µg l-1, total phosphorus 677.18 ± 20.87 µg l-1, Silicates 4.11 ± 0.52 mg l-1 and chlorophyll a 130.54 ± 40.15 mg l-1 respectively. The study revealed that DO, pH, alkalinity and silicate showed significant difference along the river (P 0.05). The results indicate that the water of River Kisat is polluted with pollutants from domestic wastewater, agricultural and/ or surface run off. Therefore there is need for measures to be put in place to reduce water pollution along the river in order to improve the water quality.
Keywords: Water quality; Pollution; Physico-chemical parameters; River Kisat
Introduction
Water is essential for the survival of all forms of life and the availability of good quality water is an indispensable feature for preventing diseases and improving the quality of human life [1]. Rivers play a major role in integrating and shaping the landscape, and moulding the ecological setting of a basin. They are key in controlling the global water cycle and are the most dynamic agents of transport in the hydrological cycle [2].
Water resources are of high importance for human life and economy and are the main source to fulfill drinking water needs, irrigation of lands and for industry. Therefore lack of water is considered as socioeconomic obstructive factor of a country [3].
Industrial development and modern urbanization have resulted in the formation of large urban zones [4], industrial zones [5] and intensive development of agriculture [6]. This has not only increased the need for water, but also growth of urban and industrial waste discharges to the rivers with no prior treatment at the same time, decrease the ability of water to self-cleanse/auto purify. Pollution of a river first affects its chemical quality and then systematically destroys the community disrupting the delicate food web [7,8] and many rivers become short-lived and end up drying.
Today, the need for clean water is considered as one of the biggest environmental global problems. Currently, more than 1.2 billion people in the world have no access to drinking water and 3 billion people have inappropriate sanitary services and more than 200 diseases have been linked to contaminated water [9]. About 6,000 people die daily from diarrhea diseases. According to WHO (2011), it is estimated that every year around 5 million people die due to consumption of contaminated water and based on current trend of urbanism in the world until 2025, around 3 billion people will need water supply and more than 4 billion
people will need access to sewerage services.
Water quality can be monitored either by direct measurement of both the physical and chemical parameters of water or by analyzing the inhabiting biota thus quality of an aquatic ecosystem is dependent on the physico-chemical qualities of water and the biological diversity of the system [10]. The physico-chemical monitoring approach includes the analysis of different parameters such as pH, turbidity, conductivity, total suspended solids, total dissolved solids, total organic carbon, nutrients and heavy metals [11]. These parameters affect the drinking water quality, if their values are in higher concentrations than the safe limits set by the regulatory bodies [12]. Therefore, there is need to investigate the quality of drinking water to ensure adequate access to clean and safe water by the growing human population.
Materials and Methods
Study area
The study area is River Kisat, located in Kisumu County of Kenya which drains into the eastern part of the Nyanza Gulf of Lake Victoria. The study catchment area is within Latitudes 0°18’S to 0°04’N and Longitudes 34°43’E to 35°30’E (Figure 1).
Data collection and analysis
Measurements of physical parameters were done in situ at
each sampling site using respective meters [13]. Dissolved oxygen concentration (mgl-1) and temperature (°C) were measured using an oxygen meter model YSI 15B; pH was measured using a Digital Mini Model 49 pH meter; conductivity (μS cm-1) was measured using a conductivity meter model LF 96. The three meters all had automatic temperature compensations at 25°C. Turbidity (NTU) was measured using a turbidimeter model Hach 2100P. All the meter probes were immersed 30 cm below the water surface and the measurements taken after the readings were allowed to stabilize. The flow/velocity of the river was determined by use of a current meter.
Water samples for chemical analysis were collected from five different sampling sites of the river. Sampling site C1 was located at the river source, site C2 was 3 km from the source, site C3 was after the industrial and municipal sewerage treatment works, site C4 was located under a bridge, 1.5 km away from the river mouth and site C5 was at the river mouth (Figure 2). Sampling was done monthly for six months at each site. The samples were taken at a depth of 30 cm and water transferred into clean bottles and transported to Kenya Marine and Fisheries Research Institute (KEMFRI) laboratory in Kisumu for analysis. Total alkalinity was determined titrametically using 0.02 N standard HCl and Bromocresol green-methyl red indicator [13]. Total nitrogen, total phosphorus and silicates were determined colometrically using UV/VIS spectroscopy machine T80+ [13]. Chlorophyll a was extracted from the sample using ethanol. The absorbance was measured using a spectrophotometer at a wavelength of 750 nm and 665 nm [13]. The chlorophyll-a concentration was calculated using the formula: Chl-a, μg l-1=(11.40 (E665 - E750) * V1)/(V2 *L)
Where: 11.40 is the absorption coefficient for chl-a; V1=volume of extract in ml; V2=volume of the filtered water sample in litres; L=light path length of cuvette in cm; E665, E750=optical densities of the sample.
Results and Discussion
Mean values of temperature were 25.07 ± 0.78°C, 24.78 ± 0.67°C, 24.95 ± 0.71°C, 24.75 ± 0.54°C and 24.63 ± 0.42°C at sampling sites C1, C2, C3, C4 and C5, respectively with an average of 24.84 (Table1). ANOVA test revealed that the recorded temperature values at the sampling sites along the river were not significantly different (P=0.447>0.05). Water temperature changes with seasonal variations, exposure to solar radiation, flow rate, depth of water, humidity and cloud cover in the area. Although mean temperatures recorded at all
sites were high, site C5 recorded a slightly low temperature and this could be attributed to the shading by the Eichhornia crassipes that cover the river as it enters into the lake.
Physico-chemical parameters
Electrical conductivity varied between 390.75 ± 118.40 µS cm-1 in C1, 839.65 ± 323.01 µS cm-1 in C2, 796.45 ± 253.32 µS cm-1 in C3, 840.93 ± 330.32 µS cm-1 in C4 and 659.43 ± 226.15 µS cm-1 in C5 with a mean EC of 657.27 ± 186.78 µS cm-1 (Table 1). One way ANOVA test showed no significant difference (P=0.267>0.05) in conductivity. Conductivity levels in rivers are influenced by total dissolved solids deposited in water. The load of total dissolved solids is determined by the type of soils at the catchments area and human activities. In tropical waters, marked seasonal variation in temperature and rainfall also influence the conductivity of rivers as well as time of residence, evapotranspiration and the flow rate of the river [14]. High conductivity mean value recorded in sampling sites C2 and C3 may be due to the high volume of a combination of partially treated and untreated industrial effluents which contained dissolved solids and are regularly discharged into
the river. There are also fish processing industries and together with household products contribute to high amounts of dissolved solids.
The mean pH in the sites were 6.85 ± 0.16 in C1, 6.29 ± 0.17 in C2, 6.17 ± 0.22 in C3, 5.49 ± 0.24 in C4 and 5.72 ± 0.24 in C5 (Table 1). One way ANOVA test showed that mean pH values in the sites along the river were significantly different (P 0.001). pH under natural conditions is dependent on the amount of carbonate and bicarbonate alkalinity and carbon dioxide in solution while in aquatic ecosystems pH is dependent on the balance between photosynthesis and respiration [15]. The acidic pH recorded in the sampling sites could be attributed to the high decomposition rates of organic wastes deposited in the river through run-off from industrial and agricultural activities. Decomposition of these organic wastes makes use of the dissolved oxygen in water and leads to the production of humic acids lowering the pH levels. pH levels were below the set standards by the National Environment Management Authority (NEMA) which ranges between 6.5-8.5.
The highest mean dissolved oxygen was recorded in sampling site C1 (5.92 ± 0.75 mgl-1) while the lowest was at site C5 (3.42 ± 0.4 mgl1) (Table 1). One way ANOVA test showed significant difference (P0.001) in dissolved oxygen between the sampling sites. The amount of dissolved oxygen in the water is a function of various factors that include metabolic activity rates, diffusion, atmospheric pressure, temperature and flow rate [16]. The high dissolved oxygen levels recorded in C1 could be attributed to the area having minimal disturbance from human activities such as waste dumping that deplete oxygen due to decomposition whereas low dissolved oxygen levels in C5 may be due to the high productivity rate that makes use of oxygen noted by the high chlorophyll levels. In addition C5 has a slow flow rate which reduces the solubility of oxygen in water. Mean dissolved oxygen level recorded was 4.19 mg l-1. This value was lower than the NEMA set standard of 8 mg l-1. Mean flow rate recorded in the sampling sites was 1.4 ± 0.05 km h-1 in C1, 1.5 ± 0.05 km h-1 in C2, 1.3 ± 0.01 km h-1 in C3, 1.7 ± 0.07 km h-1 in C4 and 1.00 ± 0.02 km h-1 in C5. (Table 1). ANOVA test showed no significant difference in flow rate of the river’s sampling sites (P=0.0.358>0.05). The low flow rate of the river is due to the river having a relatively short distance of about 4 km, a width that range between 0.6 m at the river’s upstream to 4.3 m at the river mouth and a depth of between 0.2 m to 0.4 m thus it has a low flow rate. The lowest flow rate at C5 can be attributed to the site being overgrown with water hyacinth that interferes with water flow.
Turbidity along the river showed a wide variation during the sampling period with a low recorded value of 32.37 ± 5.15 NTU and a high value of 195 NTU. Mean turbidity in the sampling sites were 32.37 ± 5.15 NTU in C1, 97.7 ± 17.11 NTU in C2, 108 ± 35 NTU in C3, 88 ± 8.85 NTU in C4 and 122.98 ± 18.97 NTU in C5 (Table 1). One way ANOVA test on turbidity in the river’s sampling sites showed no significant difference (P=0.358>0.05). Turbidity in rivers is influenced by presence of phytoplankton, sediments from erosion, re-suspended sediments from the bottom, waste discharge, algae growth, urban runoff, matter from decaying vegetation and industrial waste and sewage [17]. Sampling site C1 recorded the lowest mean turbidity; this could be attributed to the filtering effect of the swamp before the site, which removed most of the sediments before they could be deposited in the river. Sampling site C5 recorded the highest mean turbidity during the study period; this could be as a result of the cumulative effects of sampling sites C2, C3 and C4. Turbidity as per NEMA requirements should be 5 NTU and this was way below the recorded river value that was 89.90 NTU.
The average alkalinity was 150.85 ± 28.23 with a wide variation ranging from 107 mg l-1 CaCO3 in C1 to 199.67 ± 28.93 mg l-1 CaCO3 in C3. One way ANOVA test revealed significant difference (P 0.001) in the sampling sites (Table 1). Alkalinity is influenced by the presence of bicarbonate, carbonate and hydroxyl ions that are formed as a result of the interaction between carbon dioxide in water with basic materials such as calcium carbonate from chalk or limestone [18]. High alkalinity levels in site C3 could be attributed to the low rate of water flow which led to an increased length of time the water was in contact with the parent rock that promoted the weathering process. Alkalinity levels in C3 could also be from effluent discharge from detergent and fish processing industries. Lower levels in site C5 may be as a result of high rates of photosynthesis process by the water hyacinth that have excessively grown and make use of carbon dioxide and also due to the low evaporation rates that increase dilution of the carbonate and bicarbonate ions as limited amount of the sun’s rays reach the water body as most of the sun’s energy is blocked by the canopy formed by Eichhornia crassipes.
Total nitrogen and total phosphorus values increased downstream. TN ranged from 400.77 ± 124.50 µg l-1 to 857.88 ± 363.96 µg l-1 with an average mean 657.274 ± 208.78 µg l-1 whereas TP ranged from 342.17 ± 112.48 µg l-1 to 1227.38 ± 424.28 µg l-1 with an average of 885.39 ± 227.56 µg l-1 (Table 1). One way ANOVA test showed no significant difference for both the nutrients in the sampling sites. Variations in TN and TP concentrations in rivers is attributed to anthropogenic activities, domestic and industrial inputs of phosphorus such as sewage disposal and phosphorus rich detergents [19], agricultural run-off [20], rainfall frequency and vegetation type at the catchments [7]. Low records of the nutrients in sampling site C1 could be due to minimal human activities at C1. High TN and TP downstream may be attributed to the accumulation of the nutrients downstream as well as surface runoff of fertilizers used to maintain the golf course situated before the sites. Means of total nitrogen and total phosphorus recorded were higher than the set standards by NEMA.
Silicates showed moderate variations in all the sampling sites along river Kisat. The values ranged from 2.2 mg l-1 to 5.54 mg l-1 in C1, 2.76mg l-1 to 4.97 mg l-1 in C2, 3.17 mg l-1 to 5.04 mg l-1 in C3, 2.50 mg l-1 to 5.73 mg l-1 in C4 and finally 2.65 mg l-1 to 5.55 mg l-1 in C5. One way ANOVA test, the mean silicate of the river’s sampling sites showed that there was a significant difference among the sampling sites (P=0.0040.05) (Table 1). Sampling site C5 recorded the lowest mean silicates and this can be attributed to the high diatom composition that made use of silica, in addition, low silica concentration may be due to the uptake by water hyacinth as the make use of this nutrient for chlorophyll synthesis. Similarly, the low mean silicates at sampling site C1 may be as a result of the high diatom composition in the station which uses the silicates to build up their structures.
Chlorophyll-a levels ranged from 64.76 mg l-1 to 144.11 mg l-1 with means of 95.82 ± 21.15 mg l-1 in C1, 105.86 ± 24.59 mg l-1 in C2, 113.98 ± 33.47 mg l-1 in C3 and 123.88 ± 35.16 mg l -1 in C4 and 213.14 ± 74.30 mg l-1 in C5 (Table 1). ANOVA test showed no significant difference (P=0.455>0.05) in chlorophyll a levels between the sampling sites.
Chlorophyll a levels were observed to increase downstream along the river. The high chlorophyll a recorded in sampling site C5 during the study period could be attributed to the accumulated effects of nutrient flow downstream that causes high productivity hence a rise in chlorophyll level.
Conclusion
Four of the eleven environmental parameters (dissolved oxygen, alkalinity, pH and silicates) showed significant differences along the river (P<0.05). These parameters were not within the recommended standards according to NEMA and so not suitable for domestic use. Contaminated water bodies is an indication of their mismanagement and with time may face serious environmental problems which may not support healthy living. There is therefore need for stringent measures to be put in place to curb water pollution along the river in order to improve water quality.
Acknowledgement
We sincerely acknowledge Kenyatta University, Research Unit for providing research materials which have been used in conducting this research and Kenya Marine and Fisheries Research Institute-Kisumu for allowing us use their laboratory in analyzing the various parameters herein discussed in this paper.
Maryam Shehab and Amjad Moinuddin
Toluene and NO2 pollutants have an adverse effect on human health.
Objective: In this research, we measured the concentrations of both Toluene and NO2 during 2019 in selected areas in Kuwait and their sources, including the Shuwaikh industrial area which has a large number of car service shops which may be the source of high concentrations of toluene. Methods: Datawere obtained from the Envista software used by the Kuwait Environmental Public Authority (KEPA) which measures the pollutants every minute daily in different locations in Kuwait.
Results:Toluene results from the Shuwaikh industrial area showed the highest concentration reading (17.465 ppb) in November at 20:00. As for NO2, the highest concentration readings for the Shuwaikh industrial area, Al Salam, and Al-Mutla were (68 ppb) in May at 21:00 hours, (128 ppb) in February at 07:00 hours, and (83 ppb) in January at 21:00 hours and 22:00 hours respectively.
Conclusion:The higher concentrations for both toluene and NO2 in the Shuwaikh industrial area are correlated with higher levels of traffic. High concentrations of NO2 in Al-Salam and Al-Mutla are also related to traffic.
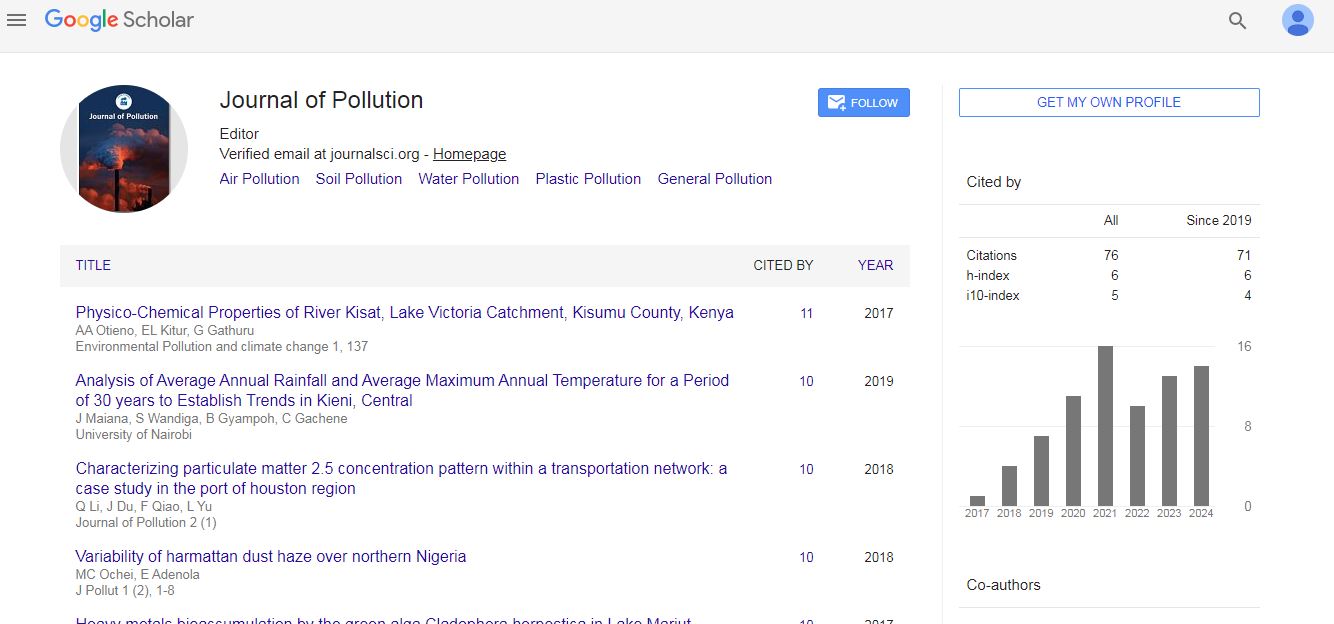
JOURNAL OF POLLUTION
I am pleased to mention that during the year 2019, all issues of volume 2 were published online well within the time and the print issues were also brought out and dispatched within 30 days of publishing the issue online. During the calendar year 2019, HGEC received a total of 57 papers, out of which 44 articles (80%) were rejected in the preliminary screening due to plagiarism or being out of the format and peer review process. During 2019 around 10 articles were subjected for publication after they are accepted in the peer review process. In the 2 issues of Volume 2 published during the year 2019, a total of 8 articles were published (at an average of 4 articles per issue) of which, articles were published from authors all around the world. A total of 50 research scientists from all over the world reviewed the 8 articles published in volume 8. Average publication lag time of an article was further reduced to 2-3 weeks.
Journal of Pollution received 64 citations as per Google Scholar report

 Spanish
  Chinese
  Russian
  German
  French
  Japanese
  Portuguese
  Hindi
Hindi 