Shobitha Sunil
Abstract
Air pollution has become one of the most hazardous global concerns, killing an estimated 7 million people worldwide every year. Bengaluru, the city of India’s high-tech industry has been developing economically scaling up the luxuries of living lifestyle. Due to the rapid development of this metropolitan city, it has been facing deteriorating environmental conditions. The sole objective of this paper is to critically analyze the air pollution trend from 2011- 2018 at various industrial, residential, sensitive and moderate locations in Bengaluru on various factors that contribute to air pollution.
Keywords: Air Pollution; Environment; Bengaluru
Introduction
Collection of certain pollutants in the air which counter affects the health of a wellbeing human, animal and plant life is known as air pollution. According to the World Health Organization (WHO); 1.4 million deaths from strokes every year, 2.4 million deaths from heart diseases every year, 1.8 million deaths due to lung disease and cancer every year and 7 million premature deaths every year are attributable to air pollution. Air is everywhere and so is its influence polluted air can adversely affect the human health, buildings, monuments, plants, ecosystems and the list is endless. Polluted air has been linked to climate as particulate matter absorbs or reflects sun light and affect cloud formation and rainfall pattern of a place [1].
Pollutants such sulphur dioxide, nitrogen dioxide and carbon monoxide are released into the atmosphere through various combustion processes; burning of fossil fuels such as coal, oil, natural gas and gasoline are the main sources of these pollutants. Particulate matter pollutants is a mixture of solid particles and liquid droplets that are added into the air by dust ash, fly ash, soot, smoke, aerosol and condensing vapors suspended in the atmosphere for longer periods of time [2].
Bengaluru is often manifested through the arduous battles that are fought by the citizens to save the city. The IT capital of the country has an ever growing population, now estimated to be over 1.2 crore [3].The rise in the population is directly related to the rise in the number of vehicles, around 1750 new vehicles are getting registered in the city every day and the vehicle population in Bengaluru has crossed 80.45 lakhs [4]. This has substantially had a tremendous effect on the city’s ambient air quality and health. This paper is an attempt to analyze the critical pollutants such as SO2,NO2 and RSPM, together constituting the Air Quality Index, using this information this paper also tries to analyze the general health effects these pollutants cause on both long and short term exposure. Due to the socio-economic and environmental challenges associated with rapid urbanization, it is connected with increasing levels of ambient concentration of air pollution. Main contributor of air pollutants in Bengaluru is the transport sector.
In the year 2018, there has been a report that the number of vehicles in Bangalore has crossed 80 lakhs, by this number we can estimate the amount of unprecedented emission into the air that is going to pollute the air up to a great extent. Increase in number of non transport vehicles (mostly two wheelers) is caused due to the rapid expansion of city without development of proper infrastructure. These vehicles not only cause emission of RSPM, SO2 and NO2 but also HC and CO which has led to increase in their concentration in air. Diesel consumption in vehicles emits SO2 and particulate matter of all size. Particulate matter of size less than 2.5 and 1 μm is expected to have increased due to increase in consumption of diesel. High concentration of RSPM level due to construction activity can be managed if propercare is taken during construction [5].
On a global perspective, the effect particulate matter has proven that women are at a greater risk and also sometimes fatal due to prominent effect of particulate matter. Women showed a relative risk for fatal CHD of 1.42, 1.38, and 1.22 with each increase of 10 micrograms per cubic meter (μg/m3) of airborne PM2.5, PM10 – 2.5, and PM10, respectively, in the air pollution they encountered during the four years preceding death. Postmenopausal women showed higher relative risks of 1.49, 1.61, and 1.30 for each 10 μg/m3 increase in PM2.5, PM10–2.5, and PM10, respectively. Neither O3, SO2, nor NO2 was associated with fatal CHD on its own. O3 and to a lesser degree SO2 (but not NO2) increased the effect of all sizes of PM [6].
Population increase causes a significant positive impact on ambientc air pollution [7]. Demand for land, food, transport, energy, natural resources and environmental infrastructures increases with the population rise and ecological balance is disturbed which in turn increases human and socio economic activities leading to increase in ambient air pollution. Backbone of economic development is energy consumption. However environmental pollution and its degradation are caused by unsustainable production and consumption patterns [8]. Reduction in life expectancy and increasing mortality is significantly caused by increased ambient air pollution. However, sustained economic development, along with energy efficiency are potential options for reducing ambient air pollution while improving quality of life and environmental sustainability [9]. By evaluating all the analysis done by various other researchers, RSPM contributes the most to the air pollution throughout the world. In the recent past all the other gaseous components seems to be under control except for the levels of RSPM.
Materials and Methods
Field sampling
Under National Ambient Air Quality Monitoring Programme (N.A.M.P), Karnataka State Pollution Control Board is monitoring Ambient Air Quality at 7 ( Graphite India Limited, KHB Indl Area, Peenya Industrial area ,Victoria Hospital , Amco batteries, Yeshwanthpur Police Station and International Machine tools accessories at Peenya ) locations using ‘ Respirable Dust Sampler’ (RDS) in Bangalore City by Conventional method. Four air pollutants viz., Sulphur Dioxide (SO2), Oxides of Nitrogen as NO2 and Suspended Particulate Matter (SPM) and Respirable Suspended Particulate Matter (RSPM/PM10), have been identified for regular monitoring at all the locations. The monitoring of pollutants is carried out for 24 hours (4-hourly sampling for gaseous pollutants and 8- hourly sampling for particulate matter) with a frequency of twice a week, to have 104 observations in a year.
Data Quality
A majority of the air pollution monitoring stations across the country are operated manually and it is unclear how the 8-h samples are used for regulatory purposes of assessing whether locations are meeting the 24-h NAAQS, since an 8-h sample only captures a snapshot of the actual levels. Further, it is likely that singular pollution episodes are either not accounted for, or have an undue influence on the measurements resulting in under- or over-reporting of PM10 concentrations. Manual monitoring also results in a delay in data collection, transmission, and availability, although the increasing number of CAAQMS are allowing data to be streamed to the CPCB website in near real-time overcoming some of the aforementioned concerns [10].
Calculation of AQI
On the Field Data Log, fill in the top portion of the form including: the date/time of visit, the site identification, sampler identification, site name, filter ID number, sample start and stop dates and times, and field operator initials. 10^3=unit conversion factor for milligrams (mg) to micrograms (µg)
The index of specific pollutant is derived mainly from the physical measurement of pollutants like SPM, RSPM, SO2 and NOx. There are several methods and equations used for determining the AQI. In the present study AQI for each location in the study area has been estimated with the help of a mathematical equation given below.
AQI=1/3[{SO2/SSO2}+{NOX/SNOX}+{RSPM/SRSPM}}] × 100
Where,
SO2=Individual Values of sulphur dioxide
NOX=Individual values of oxides of nitrogen
RSPM= Individual values of Respirable suspended particulate matter and SSO2, SNO2 and SRSPM=Standards of ambient air quality of sulphur dioxide, oxides of nitrogen, Respirable suspended particulate matter [11].
Calculation of Exceedance Factor
Also, the Central Pollution Control Board (CPCB) developed a formula known as the Exceedance Factor (EF) so that it is easy for everyone to understand the pollution level.
EF=Observed Annual Mean of Criteria Pollutants/Annual Standard
For Respective Pollutant
Therefore, Air Quality can be classified into the following:
Critical Pollution (C):EF>1.5
High Pollution (H): EF belongs to [1.0-1.5]
Moderate Pollution (M): EF belongs to [0.5-1.0]
Statistical Analysis
The statistical analysis was performed using Microsoft Excel 2010 to obtain graphs with respect to the trends that are being observed in the obtained data from KSPCB. Along with excel, we also used R Software to analyse the relationship between the pollutants and the Air Quality Index. Pearson correlation analysis (CA) was employed to analyse theinner relationships among elements.
Results and Discussion
Air pollution measurement in Bengaluru
Under the National Ambient Air Quality Programme (NAMP), the Karnataka State Pollution Control Board (KSPCB) has installed pollution recording apparatus at various locations throughout the city (Table 1). In this paper, the following locations are used for the analysis:
• ITPL (Industrial Belt)
• Yelahanka (Industrial Belt)
• Peenya (Industrial Belt)
• Yeshwanthpur (Residential Belt)
• S.G.Halli (Residential Belt)
• Amco Batteries (Moderate Belt)
• City Railway Station (ModerateBelt)
• Victoria Hospital (Sensitive Belt)
Also, the Central Pollution Control Board (CPCB) developed a formula known as the Exceedance Factor (EF) so that it is easy for everyone to understand the pollution level.
EF= Observed Annual Mean of Criteria Pollutants/Annual Standard For Respective Pollutant Therefore, Air Quality can be classified into the following:
• Critical Pollution (C): EF>1.5
• High Pollution (H): EF belongs to(1.0-1.5)
• Moderate Pollution (M): EF belongs to(0.5-1.0)
• Low Pollution (L): EF <(0.5-1.0)
Share this article
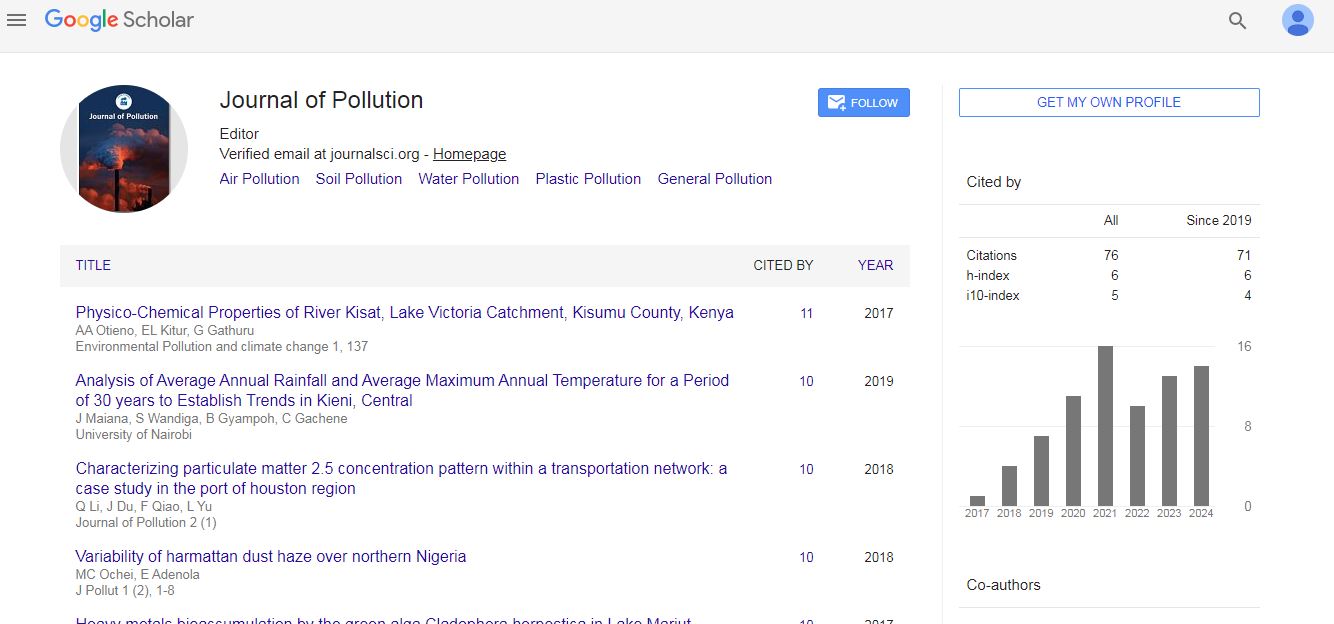
Journal of Pollution received 64 citations as per Google Scholar report