Bwede DD*, Wuana RA, Khan ME, Egah GO, Itodo AU and Duwong EB
In this study, a non-destructive analytical techniques (Energy dispersive X-Ray fluorescence) was used to analyze the concentration of seven heavy metals (Pb, Cr, As, Ni, Cd, Cu and Zn) in tin mine tailing from mining and control sites in Rim, Sharubutu and environs. The physicochemical results showed the pH for S1 and S2 from the mining and control sites were (5.31 and 4.97) and (6.32 and 5.71) respectively indicting that the mine sites is more acidic than the control sites. While their bulk density and electrical conductivity was good for planting. The concentration of the heavy metals were within the maximum permissible limits except for Pb and As in mining and control sites of range (270-300) mg/kg and (60-80) mg/kg, which are above the permissible limits (80 mg/kg and 0.07 mg/kg) respectively. This could be attributed to the mining activities and atmospheric depositions on the sites. The enrichment factor values for Pb, Cr, As, Ni, were S1 (1.07, 1.18 1.14 and 1.14) respectively while Cd, Cu and Zn were not detected, S2 (1.11, 1.19, 1.33, 1.14 and 1.11) for Pb, Cr, As, Ni, and Zn respectively, while Cd and Cu were not detected. The geo accumulation factor for S1 were (0.22, 0.24, 0.23 and 0.23) for Pb, Cr, As and Ni, while Cd, Cu and Zn were not detected, S2 (0.22, 0.24, 0.27, 0.23 and 0.22) for Pb, Cr, As, Ni, and Zn respectively, while Cd and Cu were not detected. This indicates environmental pollution. The result obtained for risk indent Ri where S1 (24.81) and S2 (28.04), these shows that the risk index of heavy metals in tin mine tailings of the studied areas posed low ecological risk to the ecosystem. The Fourier transform infra-red (FTIR) spectra analysis shows the functionality of Ag+, Ca2+, K+, and Mg2+ were within the band range of 700-2200 cm-1. S1 showed absorption bands at (779.0 cm-1) for silver bromate, (1038.2 cm-1) for calcium sulphate and potassium metaborate, (2108.7 cm-1) for magnesium per chlorate and sodium chromate. S2 showed absorption band at (2173.0 cm-1) for magnesium per chlorate and sodium chromate. The surface morphology of the tin mine tailings through the use of Scanning electron microscopy (SEM) technique revealed Homogeneous small size and heterogeneous crystalline irregular shape.
PDFShare this article
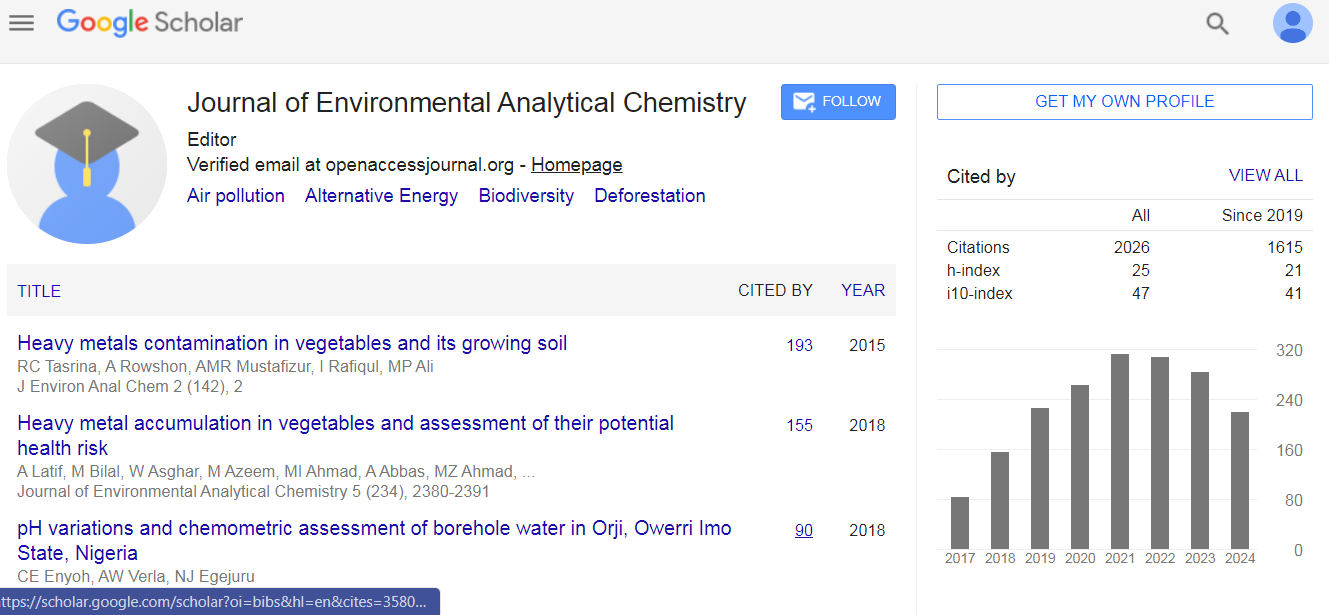
Journal of Environmental Analytical Chemistry received 1781 citations as per Google Scholar report