Research Article - (2023) Volume 12, Issue 4
Received: 03-Nov-2021
Published:
24-Nov-2021
, DOI: 10.37421/2168-9768.2022.11.387
Citation: Ahimed Bayan,Gemeda Fekadu. "Technical Performance Evaluation of Selected Small Scale Irrigation Scheme in Arsi and Western Arsi Zone ." Irrigat Drainage Sys Eng 10 (2021) : 295.
Copyright: © 2021 Ahimed B, et al. This is an open-access article distributed under the terms of the creative commons attribution license which permits unrestricted use, distribution and reproduction in any medium, provided the original author and source are credited.
In Ethiopia small scale irrigation schemes play a vital role in improving the livelihoods of the smallholder farmers’. However, existing small-scale irrigation schemes face various problems related to operation and maintenance, water management and sustainability. This study was conducted to technical performance evaluation of selected Small Scale Irrigation Scheme in Arsi and Western Arsi Zone using irrigation performance indicators. For this two scheme selected were Bubisa from Lemu-Bilbilo district of Arsi zone and Koma Arba from Adaba district of West Arsi Zone. From the study conducted on Bubisa and Koma Arba irrigation scheme using performance indices such as conveyance efficiency (Ec), application efficiency (Ea), on farm water lost (ROR+DPF), storage efficiency (Es), overall efficiency (Eo) and distribution uniformity (DU) and finally identifying problems of the scheme. For these study three farmers’ fields located at head, middle and tail of the two irrigation scheme were selected. From the result, parameters like Ec, Ea, on farm water lost (ROR+DPF), Es, DU and Eo were 67%, 60.27%, 39.73%, 89.59%, 90.50%and 39.77%, respectively for Bubisa irrigation scheme and 78%, 62.25%, 37.25%, 82.33%, 92.78% and 48.70% respectively for Bubisa irrigation scheme. Water Use efficiency (WUE) of Bubisa and Koma Arba scheme were 4.59 and 3.05kg/m3. This means that the yield from one meter cube of irrigation water for Bubisa irrigation scheme was higher than that of Koma Arba irrigation scheme. Sustainability of Irrigation System of the Bubisa and Koma Arba schemes were decreased by 42.7% and 62.5%compared with the planned. Therefore, for the improvement of the irrigation system management and the irrigation practice frequent performance evaluation is very important and solves problems related to operation and maintenance, water management and sustainability.
Small Scale, Irrigation Schemes, Irrigation Efficiency, Crop Productivity, Conveyance Efficiency, Application Efficiency, Storage Efficiency, Distribution Efficiency
Irrigation is one means by which agricultural production can be increased to meet the growing food demands in the country. In Ethiopia, although irrigation has long practiced at different farm levels, there is no efficient and well managed irrigation water practice. The reason could be little efforts made to investigate the irrigated land management and water use in the country. Even some research results have indicated that sometimes no difference observed between rain fed and small scale irrigation user smallholders in their food security status. Improving irrigation performance to increase productivity is one of the main visions formulated by national and international organizations involved in water development. Water productivity for food production was a major issue at the second Water Forum held in March 2000 organized by the World Water Council in Hague, where a frame work for achieving water security was formulated. The conference set a target to increase food productivity of water by 30 percent by the year 2015. This goal calls for evaluation of irrigation schemes aimed at increasing farm performance. There is increasing pressure to improve the water use efficiency of irrigated agriculture in developing countries. Over irrigation and excessive drainage losses are wide spread. Significant water savings can be achieved with an integrated approach to irrigation and drainage management [1].
In Ethiopia small scale irrigation schemes play a vital role in improving the livelihoods of the smallholder farmers. However, existing small-scale irrigation schemes face various problems related to operation and maintenance, water management and sustainability. These problems have greatly reduced their benefits and challenged their overall sustainability. Besides the poor performance of irrigation projects in the country, evaluation of irrigation projects is not common: lack of knowledge and tools used to assess the performance of projects adds to the problem. Bubisa and Koma Arba small scale irrigation are one of small scale irrigation which are community managed small scale irrigation scheme that is developed for surrounding Farmers. However, due to lack proper water management, the farmers at the head irrigation scheme use over irrigation and that of the middle and tail face the shortage of water resulting conflicts on water users many times. Hence, this study was conducted on Bubisa and Koma Arba small scale irrigation with the objective of technical performance evaluating the schemes [2].
Description of Study Area
The study was conducted at Bubisa and Koma Arba Small scale irrigation Scheme. Bubisa scheme was located in Arsi zone of Lemu Bilbilo woreda and Koma Arba scheme was located at west Arsi zone of Adaba woreda of Oromia Regional State. From each scheme three farmers field located at head, middle and tail of the scheme were selected for evaluation [3].
Data Collection
The secondary and primary data were collected. Secondary data collected were scheme design document and metrological data from Zone and National Metrological Agency. The primary data collected were physico-chemical properties of soil, water discharge measurement at head works, in main canals, at three field inlets and water application practices related to water management on field [4].
Soil parameters measurements
The moistures were measured to determine how much water was depleted below the field capacity before irrigation and how much water was applied to the root zone after irrigation. For these purposely, soil samples for soil moisture content, bulk density, organic matter content , soil pH , texture ,field capacity, and permanent wilting point of the soil was taken from two depth (0-30 and 30-60cm) and analyzed [5].
Bulk density
Bulk density was determined using undisturbed composite soil samples collected from different location with core samplers’ volume of 98.4cm3 at a depth of 0-30 and 30-60cm. The samples were placed in an oven and dried at 105°C for 24 hours. After drying, the soil and container were again weighed. The dry weight of the soil were analyzed by core method i.e. oven drying of the sample for 24 hours at 105°c and weighed for calculating dry density using equation (2.1) given by Hillel.
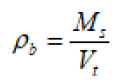
Where, soil bulk density (gm/cm3), M s=mass of dry soil (gm) and Vt=total volume of soil in the core sampler (cm3)
Soil Moisture Content
Soil samples were collected to determine moisture content of soil from field before and after irrigation period using manually driven soil auger. The soil samples were placed in the air tight container and weighed prior to placing in an oven dry at 105 °c and were left in the oven dry for 24hrs. After the soil moisture sampler collected and oven dried, the moisture was calculated as a percentage of dry weight of the soil (W) as stated Walker
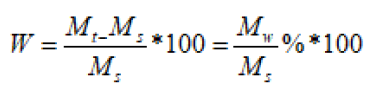
Where, W=weight of soil sample (gm) Mt=weight of fresh sample gm) Ws=weight of over dried sample (gm) Ww=weight of moisture (gm)
To convert these soil moisture measurements into volumes of water, the volumetric moisture content ( ) was calculated as
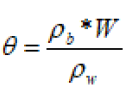
Where, =volumetric moisture content (%), = soil bulk density (gm/ cm3), W= moisture content on dry weight basis (%), = unit weight of water (1gm/cm3)
2.3.3 Total Available Water (TAW) Total available water is the water which crop can use for its normal functioning and survival. Then TAW was calculated as the following formula.
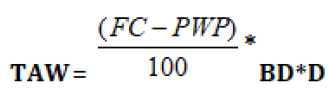
Where: TAW = total available water (mm), FC = field capacity (% by weight bases), PWP = permanent wilting point (% by weight bases), D = depth of root zone (mm) and BD = specific density of soil (bulk density of soil)
Soil Texture
To determine soil texture, composite samples of disturbed soil were collected from different locations in the field and for the determination of soil textural class soil samples at the specified depths were taken at each stratum (head, middle and tail). Soil particle size composition of each composition was determined in laboratory. Based on the percentage of composition, the soil class was determined by USDA soil textural triangle method.
Infiltration Rate
Doublering infiltrometer method was used to identify the basic infiltration rate of the field soil. Ringinfiltrometer are thin-walled, open-ended metal cylinders with the bottom-end sharpened to ease insertion into the porous medium. Ring infiltrometer were operated by inserting two rings (30 cm and 60 cm diameters were used) into the
soil to a depth of 10 cm, ponding one or more known heads of water inside the rings, and measuring the rate of water flow out of the rings and into the unsaturated porous medium. Measuring rod graduated in mm (20 cm ruler) was used.
Crop Water Requirement (CWR) and Irrigation Water Requirement (IWR)
The climatic data using CROPWAT model-8 was used to calculate the reference evapotranspiration (ETo) of the study area. In addition, mean monthly rainfall data of Bokoji Arsi and Adaba station were collected from National Metrological Agency. The monthly net crop water requirement (CWR) and the net irrigation water requirement (IWR) of the crop were computed by CROPWAT software
ETc = ETo x Kc
Where, ETc = crop evapotranspiration (mm/day), ETo = reference crop evapotranspiration (mm/day) and Kc = crop coefficient
Canal Discharge Measurement
Discharge measurement was done by float method at main and secondary canals. A tennis ball, plastic bottle and lemon were floats on the surface of water. It was done by making mark off a known length of the 30m length interval. Release of the float material at upstream of the marker to reach last mark, the time it takes to pass between the two markers was recorded to calculate velocity. Ideally, it should time three passages of the float and average the three times a reduction factor of about 0.85 should be used to convert surface velocity to average velocity
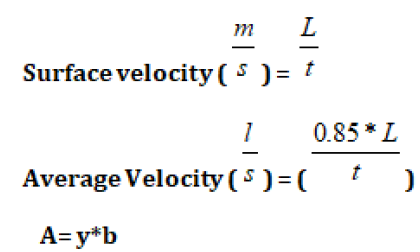
Where: b is base width of canal and y is water depth in the canal
Discharge can be calculated by multiplying average velocity and cross sectional area of the irrigation canal
Field Discharge Measurement
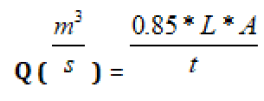
The flow of water into field was measured using 3" parshall flume to be installed at the entrance of the water flow to field. Then the flow depth observed on the flume was converted to the corresponding discharge using equation (2.10). Then the total volume of water applied (Va) was calculated using equation (2.11) and the total depth of applied water was calculated based on the representative irrigated area
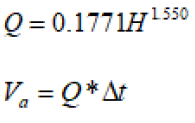
Where; Q= discharge through the flume (l/s), H= water depth in meter, Va= total volume of water applied (m3), =flow time to the field
Determination of Irrigation System Performance Indicators
The performance of irrigation water management can be stated as “the extent to which the land and water resources in the irrigation schemes planned for allocation to different users and their spatial and temporal distribution in planning and operation stages follow the objectives of the irrigation scheme.
Conveyance efficiency
The water conveyance efficiency is typically defined as the ratio between the irrigation water that reaches a farm or field to that of diverted from the water source and was calculated as expressed as
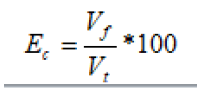
Where, Ec= Water Conveyance Efficiency (%),Vf= Volume of irrigation water that reaches the farm or field ( m3/s or ha-m) and Vt= Volume of irrigation water diverted from water source (m3/s or ha-m)
Application efficiency
The application efficiencies (Ea) in the selected fields were calculated using equation below
Where Ea= water application efficiency %, Ds = water stored in the soil root zone during the irrigation mm, Da = water delivered to the farm mm
The depth (Ds, m) of water retained in the soil profile in the root zone was determined using the following equation given b.
Where θAI and θBI are moisture content of the ith soil layer after and before irrigation on oven dry volume basis (%), respectively. Di is thickness of ith soil layer (mm) and n is number of layer in the root zone
Storage Efficiency
The water storage efficiency refers to how completely the water needed prior to the irrigation root zone during irrigation. It is the ratio of water stored in the root zone during irrigation to the quantity of water needed in the root zone before irrigation. Based on the FC, PWP and bulk density of the soils of the selected irrigation fields and the root depth of the crop irrigated, the depth of irrigation water required by the crop was calculated as actual soil moisture depletion level. After determining the water stored in the root zone of the plants and water needed in the root zone prior to irrigation, the storage efficiency was computed as
Where; Ds is depth of water retained in the soil compartments of the root zone (mm) which is computed by equation 2.14 and Dreq is water depth required in the root zone (mm) prior to irrigation and was estimate by the following equation
Where; θBI = ith layer of volumetric moisture content before irrigation (fraction) θFC = ith layer of volumetric moisture content at field capacity (fraction) Di = ith layer of crop root depth (mm) n = number of layers in the root zone
Distribution Uniformity
To determine the distribution uniformity of irrigation water in the selected farmer’s field samples were taken from the selected points. For computing average depth of water infiltrated over the field (Dav), moisture content of the field was measured before and after irrigation. Their difference and mean of their difference were calculated. For computing average depth of water infiltrated in the low one-quarter of the field (Dlq), moisture content of the field was measured before and after irrigation. Their difference was calculated for the least four from descending order and then mean of their difference was computed. From Dav and Dlq distribution uniformity (Du) were computed for selected fields (by dividing mean of difference of overall sample for mean of difference of least quaItr twear)s. expressed as:
Where, Du=Distribution Uniformity (%),Dlq=Average depth of water infiltrated in the low one-quarter of the field (m) and Dav= Average depth of water infiltrated over the field (m).
Overall scheme efficiency
The most common way to express the efficiency of irrigation systems is to subdivide it in to Conveyance and application efficiencies. Once the conveyance and application efficiencies had determined, the scheme irrigation efficiency (Eo) can be calculated, using the following formula
Irrigation water losses
Irrigation water losses in canals are due to evaporation from the water surface, deep -percolation to soil layers underneath the canals, seepage through the bunds of the canals, overtopping the bunds, bund breaks, runoff in the drain, and rat holes in the canal bunds (In addition to these, the water losses in the cropped area are in the form of runoff and deep percolation
Runoff ratio
The amount of runoff from each field was collected and measured using known volumes of runoff collector buckets and parshall flume was installed at the lower end of the field and runoff was calculated using the equation given by Walker
Where: RR=runoff ratio (%), Dr=volume of runoff in terms of depth (mm) and Da=total depth of water applied to the field (mm)
Deep percolation fraction
Deep percolation fraction (DPF) was calculated indirectly from the measured values of application efficiency (Ea) and runoff ratio (RR) as given by FAO
DPF=100-Ea-RR
Water productivity and relative irrigation supply of the scheme
The water utilization by crop is generally described in terms of water use efficiency (kg/hacm, kg/m3 or q/ha-cm) Water use efficiency (WUE) and irrigation water use efficiency (IWUE) were determined by dividing the yield to seasonal ET and total seasonal irrigation water (IW) applied
Where, WUE = water use efficiency (kg/m3),ya is actual yield (kg/m2) and ETc = seasonal crop evapotranspiration (m3/m2)
Where IWUE- is irrigation water use efficiency (kg/m3),ya - actual yield (kg/m2) and IW - irrigation water applied (m3/m2)
Sustainability of Irrigation System
The simplest measure of sustainability is that quantifies the cumulative effect of negative impacts is “sustainability of irrigated area (SIA)” that may be calculated by the expression given by Nelson cited by Awel as;
Where: AC= current total irrigated area, AI= total irrigated area when the system development way completed
Data Analysis
Collected data during the test of the system were analyzed by descriptively using Micro soft excels
From table 1 the textural class of soil for Bubisa scheme was Clay loam and that of Koma Arba Scheme was clay. The soil pH, Electrical Conductivity and organic matter content values of Bubisa scheme were 5.93, 0.200 and 3.19 and for Koma-Arba scheme 5.17, 0.098 and 3.22 respectively. From the result the soil was acidic for the two scheme but the Electrical Conductivity in the rage of recommended according to Garg, soil electrical conductive between 0.1 to 0.25 mmhos/cm at 25°C can be used for irrigation for almost all crops and for almost all kinds of soils.
Physical Properties of Soil
Table 2 blow show the physical properties of soil. From the result the bulk density was 1.38- 1.31 g/cm3 for Bubisa and 1.31 to 1.26 g/ cm3 for Koma Arba Scheme. Field capacity and Permanent wilting point of the soil were 36.63% ,35.36%,32.02% and 22.5%,20.63% , 19.8%) at head, middle and tail reach for selected farm field of Bubisa and 43.8% , 42.7% , 42.2% and 30.5%,28.7% , 28.4% Koma-Arba Irrigation scheme respectively. The average field capacity and permanent wilting point of Bubisa Irrigation Scheme 34.67% and 20.97% and were as for Koma Arba Scheme were 42.9% and 29.2% respectively. In general the total available water holding capacity of soil in selected fields for Bubisa irrigation Scheme ranges 101.18-115.77 mm and Koma Arba Scheme 104.33-108.36 mm
Infiltration Rate of Scheme
The infiltration rate of the study area was found to be 7.2 and 3 mm/hr for the Bubisa and Koma-Arba irrigation schemes. The result shows that it was consistent with the report of Savva and Frenken that the basic infiltration rate of Clay loam is in the range of 5 to 10 mm/hr and for Clay is also 0 to 5 mm/hr. The soil being clay loam and clay moderately low infiltration rate had therefore, high water storage capacity.
Irrigation water requirements
The potential crops in the study area were potato and evaluation was done on potato crop. The seasonal irrigation water requirements of potato were estimated for the two irrigation schemes were 218.2mm and 225.6 mm for Bubisa and Koma Arba Scheme respectively.
Field flow measurement
During Farmer’s field evaluation the area of selected farmers were 2500m2 at three location for Bubisa scheme and 3063, 2750, 2687m2 for Koma-Arba at head, middle and tail of scheme respectively. The average depth of water applied by a farmers during irrigation period were 234.44, 197.79mm 194.42mm and 247.56mm, 226.79mm and 200.59mm at head, middle and tail of Bubisa and Koma Arba Scheme respectively. This show that the farmers at head of irrigation scheme applied water above the irrigation water requirement of the crop
Conveyance efficiency
Conveyance efficiency of the systems was computed using equation (2.12) considering the total flow delivered by conveyance system and total inflow into the system. During the study period, average conveyance efficiency of the main canal from main intake up to the tail end was measured at different location along the canals using float-velocity method. The average conveyance efficiency values were 67% and 78% for Bubisa and Koma Arba Irrigation Scheme respectively as indicated in (Table 3). The conveyance efficiency both scheme were below the recommended value i.e.70% for poorly managed canals as stated by MoAFS. This due to the growing of weeds, theft of water and sedimentation deposed in canal which results canal linkage and water loss.
Application efficiency
From table 4, the application efficiency of three locations of two schemes was indicated and values were (56.97%, 61.25%, 62.58%) and (60.45, 62.05, 65.75%) at head, middle and tail for Bubisa and Koma Arba scheme respectively.
From the result high application efficiency was observed at the tail than head and middle for the two schemes although depth of water applied was high at head and middle. According to Bos the three irrigation location was in recommended value of 50-70% for furrow irrigation.
H= Head, M= middle, T= Tail d=water applied in field in mm Ea= application efficiency in %
Storage efficiency
Storage efficiency refers to how completely the water needed prior to irrigation has been stored in the root zone during irrigation water application. Using equation (2.13) storage efficiencies (Es) were computed by monitoring soil moisture before and after irrigations.
From table 5 storage efficiency of Bubisa irrigation scheme was 89.59% and that of Koma Arba was 82.33%. According to Raghuwanshi and Wallender, the recommended storage efficiency is 87.5%.
Thus, the storage efficiency of Bubisa scheme was below recommended and Koma-Arba is in the range of recommended to fulfilling the soil moisture required for good productivity of the crops
Ds = depth of water retained in the soil compartments of the root zone (mm) Dreq = water depth required in the root zone (mm) prior to irrigation
Distribution Uniformity
From Table 6, DU of the three locations of two irrigation schemes were 94.90%, 92.07% and 84.54% for Bubisa and 93.69%,92.84% and 91.82% fo Koma Arba at head, middle and tail respectively.
According to DU less than 60% low and DU greater than 75% recommended. So the DU of the two irrigation schemes at three locations was greater than 75% so it is recommended.
The result support to Eisenhauer distribution efficiency (ηd ) ≤60% indicates that the irrigation water is unevenly distributed, while ηd ≥ 60% indicates that the application is relatively uniform over the entire field
Overall scheme efficiency
From table 7 the overall efficiencies of the irrigation schemes at Bubisa and Koma Arba scheme were found to be 39.77% and 48.7%, respectively.. The overall efficiency of the Bubisa and Koma Arba irrigation scheme was within the range of values (40-50%) commonly observed in other similar African irrigation schemes. According to FAO overall scheme efficiency around of 40% is reasonable. Therefore the scheme was reasonable.
Irrigation water losses
The average water lost in the form of deep percolation and run off at Bubisa irrigation scheme were 39.73% and that of Koma Arba scheme was 37.25%. From the result obtained a higher deep percolation ratio was observed in lower application. According to FAO 40 percent or more of the water diverted for irrigation is wasted at the farm level through either deep percolation or surface runoff.so the result for Bubisa and Koma Arba Scheme agreed with the FAO.
Water productivity and relative irrigation supply of the scheme
The average irrigation water use efficiency for selected crop (potato) at head, middle and tail of Bubisa and Koma Arba Scheme were 4.91kg/m3,4.26kg/m3, 4.61kg/m3 and 3.47kg/ m3,3.15kg/m3,2.53kg/m3 respectively with overall average of 4.59 and 3.05kg/m3.
Sustainability of Irrigation System'
As per the design document, the intended command area that a Bubisa and Koma Arba Irrigation scheme could potentially irrigate 75ha and 160ha respectively, however the actual irrigated area was 43ha and 60ha for Bubisa and Koma Arba scheme respectively. Hence, sustainability of irrigation calculated was 57.33% and 37.50%for Bubisa and Koma Arba scheme using equation (2.24). Therefore, irrigated area of the Bubisa and Koma Arba schemes were decreased by 42.7% and 62.5% compared with the planned. This due to water diverted was lost along the canal and on farm water application was problem.
Recommendation
Huge amount of money invested to investment cost for construction of modern irrigation scheme and farmers must be expected to use water efficiently. The lined canal must maintained and unlined must be lined to reduce water loss along the canals and the district expert give training for farmers on water use and fix the schedule depending on crop water requirement to avoid excess field water application.
The results show that the effect of participatory management on employees’ performance remained significant even when employees’ commitment was enjoined model predicting employees’ performance. Based on this, the current study rejected null hypothesis that employees commitment has no significant mediating effect on the relationship between participatory management and employees’ performance in water service providers in Murang’a County, Kenya. The study concludes that employees commitment failed to influence mediating interaction amongst the two variables participatory management and employees’ performance. According to this results, the implication was that participatory management would increase performance in organisation regardless of the employees commitment. The findings were inconsistent with who found an advanced connection between affective commitment and employees’ performance. On the same note, the finding failed to agree with which established that employees commitment is a significant component in increasing service delivery whereas the finding agrees with who found no evidence that employees commitment promotes participatory management.
management to enhance employees’ performance. The study recommends water service providers in Murang’a County to engage more in these practices as participatory management positively and significantly affects performance of employees. The study recommends water service providers in Murang’a County to focus more on these practices for the purpose of enhancing employees’ performance. Evidence that employees commitment partially mediates the relationship between participatory management and employees’ performance is a call to the management of water service providers in Murang’a County, Kenya to institute programmes that will ensure employees are committed to the job and organization as this is vital in enhancing effectiveness of participatory management.
Irrigation & Drainage Systems Engineering received 835 citations as per Google Scholar report


