Research - (2021) Volume 10, Issue 4
Received: 19-Mar-2021
Published:
22-Apr-2021
, DOI: 10.37421/2168-9768.2021.10.265
Citation: Fikadu Robi, Teshome Seyoum, Tilahun Hordofa. "Response of Maize (Zea mays L.) Yield under Drip and Furrow Irrigation at Different Irrigation Levels at werer, Middle awash, Ethiopia." Irrigat Drainage Sys Eng 10 (2021): 265.
Copyright: © 2021 Robi F, et al. This is an open-access article distributed under the terms of the Creative Commons Attribution License, which permits unrestricted use, distribution, and reproduction in any medium, provided the original author and source are credited.
Field experiment was conducted at Werer Agricultural Research center to evaluate the effects of drip and furrow irrigation under different irrigation levels on maize yield and water use efficiency. The experiment was laid out in split plot design where drip and furrow irrigations assigned as main plot and irrigation levels (100, 85, 70 and 55% of ETc) assigned in the sub plot arrangement with three blocks. The highest seasonal water requirement of maize was 701.7 mm at 100% ETc under conventional furrow irrigation which is considered as control while the lowest was 192.9 mm at 55% ETc under alternative furrow irrigation. The analysis of variance revealed that there was significant (p<0.05) difference in yield among treatments and the interaction effect of irrigation system and irrigation levels show highly significant (p<0.01) difference among treatments. The highest yield (16.7t/ha) was obtained from drip irrigation with 100% of ETc application and while the lowest (4.04 t/ha) was obtained from plots treated with alternative furrow irrigation 55% ETc treatment.
Experiment • Main plot • Sub plot • Split plot
Water is the vital resource to sustain civilizations and pecuniary development and most importantly agriculture. In Ethiopia, irrigation development is a priority for agricultural transformation, but poor practices of irrigation management discourage efforts to improve livelihoods, and expose people and the environment to risks. Although available in abundance in some regions, increasing number of river basins of arid and semi-arid regions are facing problem of water scarcity as well as decline of water quality, due to population growth and increased water use [1]. One fifth of the global land area is arid or semiarid, where water scarcity can limit crop productivity in agricultural and native vegetation. Increasing fresh water scarcity has called for researchers into new irrigation technologies with the purpose of improving water use efficiency in plant [2]. About 75 of the global fresh water are used for agricultural irrigation. Most of the water is applied by conventional surface irrigation method. Maize is critical for food security in Ethiopia. Over 9 million smallholder farmers grow maize on about two million hectares (14% of total land area in Ethiopia) and around 88% of their production is used for food consumption. Nevertheless, the increasing need for crop production due to the growing population in the world is necessitating a rapid expansion of irrigated agriculture throughout the world. Irrigation in Ethiopia is considered as a basic strategy to alleviate poverty.
The uniformity of the water distribution into the soil with a good application for adding water with alternative furrow surface irrigation interactive mainly associated with the soil state and field condition and practices for the implementation of the process of regular irrigation. Holding the current rates of agricultural water use efficiency constant, an estimated additional amount of 5700 km3 of fresh water will be required annually to meet the estimated food demand in 2050. According to 56% water savings, a 22% increase in yield and a two-fold increase in water use efficiency have been found for drip irrigation in comparison with furrowirrigation [3].
Description of the study area
The experiment was conducted in the 2019/20 at Werer Agricultural Research Center experimental site, located in Afar Regional State and 280 km far away from Addis Ababa. It is located at 9° 16 ’8” latitude; 40°9’ 41”E longitudes and 740 m above mean sea level. According to the classification of Agro-ecological zones by Ministry of Agriculture and Rural Development of Ethiopia the area is classified as semi-arid with average annual rainfall of 590 mm. Bestowing to meteorological data recorded at Agro meteorological observatory (Werer) the average minimum and maximum temperature is 19°C and 40.8°C respectively (Figure 1).

Figure 1. Climate of the study area (1990-2019).
Soil sampling and analysis
Before sowing the maize, composite soil samples was taken at random from the experimental field at a depth of 0-30 cm, 30-60 cm, and 60-90 cm. Soil samples were taken in Zigzag way across the experimental plot according to CSOSS recommendation and analyzed as suggested procedure by international soil reference and information center [4] (Table 1).
| Soil physical characteristics | Soil depth (cm) | |||
|---|---|---|---|---|
| 0-30 | 30-60 | 60-90 | ||
| Texture (Particle size distribution) | Sand (%) | 11.8 | 12.6 | 12.8 |
| Silt (%) | 31 | 31 | 34 | |
| Clay (%) | 57.1 | 55.3 | 53.0 | |
| Textural class | Clay | Clay | Clay | |
| Field Capacity (%) (Weight basis) | 40 | 39.5 | 39 | |
| Permanent Wilting Point (%) (Weight basis) | 24 | 23 | 22 | |
| Bulk density (g/cm3) | 1.29 | 1.30 | 1.31 | |
| Total Available Water (mm/m) | 206.4 | 214.5 | 222.7 | |
Infiltration characteristics of the experimental site
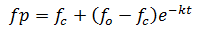
The infiltration rate which is the speed at which water enters into the soil is measured by the depth (in mm) of the water layer that can enter the soil in one hour. The equation of infiltration curve was developed by using Horton’s infiltration equation.
 (1)
(1)
fp Infiltration rate at any time (mm/hr)
fc Steady state infiltration rate (mm/hr)
fo Initial infiltration rate (mm/hr)
k Horton’s decay coefficient
t Time elapsed (hr)
The basic infiltration rate in this experiment site was found to be 5.2 mm/hr. This means that a water layer of 5.2 mm on the soil surface will take one hour to infiltrate which was in the upper range of clay soil (1-5 mm/hr.) (Figure 2).

Figure 2. Soil infiltration curve of study area.
Chemical properties of irrigation water
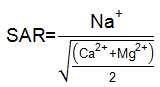
The sodium adsorption ratio (SAR) is estimated to determine the sodicity or alkalinity effect of irrigation water. The sodium adsorption ratio (SAR) was estimated from relative concentrations of sodium, magnesium, and calcium cation concentrations in a saturated paste extract (Table 2).
| Sample | PH | ECw(ds/m) | [ca+Mg](Meq/L) | [Na](Meq/L) | SAR |
|---|---|---|---|---|---|
| Water | 8.20 | 0.92 | 2.2 | 6.85 | 6.70 |
 (2)
(2)
Where,
SAR Sodium absorption ratio
Na+ Sodium concentration (mg/l)
Ca+2 Calcium concentration (mg/l)
Mg+2 Magnesium concentration (mgl0
Hydraulic evaluation parameters of drip irrigation
During field installation of drip irrigation before planting the drip emitter discharge rate was calibrated at field condition and the emitter distribution uniformity were estimated (Table 3).
| No | Hydraulic Parameter | Calculated Value | Classification |
|---|---|---|---|
| 1 | Emitter flow variation | 8% | Desirable |
| 2 | Field Emission Uniformity | 92.2% | Excellent |
| 3 | Coefficient of variation | 0.07 | Average |
| 5 | Coefficient of uniformity | 90.8% | Excellent |
| 6 | Application uniformity | 85% | good |
Experimental Treatments and Design
The experimental treatments include irrigation systems, viz., furrow (alternate furrow) and drip irrigation, and four irrigation levels (100, 85, 70 and 55%ETc). The experiment was designed as a split plot design in RCBD experiment with three blocks (Table 4).
| Main plot | Sub-plot | Treatment designation | |
|---|---|---|---|
| Irrigation level | |||
| Furrow MP1 |
AFI | 100% ETc | T1 |
| AFI | 85% ETc | T2 | |
| AFI | 70% ETc | T3 | |
| AFI | 55% ETc | T4 | |
| Drip Irrigation MP2 |
DI | 100% ETc | T5 |
| DI | 85% ETc | T6 | |
| DI | 70% ETc | T7 | |
| DI | 55% ETc | T8 | |
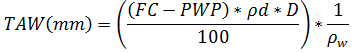
The Maize Variety “BH-546” was sown by keeping row-to-row distance at 75 cm and plant-to-plant distance at 30 cm. Two seeds were planted per hole. Once the crop attained 100% germination and then thinned to one plant per stand. Each application of water for alternative furrow irrigation was measured using partial flume with 3 inch dimension. The source of water is from Awash River brought to the field under gravity using open canal. The total available water (TAW in mm) of the experimental field wasdetermined
 (3)
(3)
Where,
TAW Total available water (mm)
FC Field Capacity (%)
PWP Permanent wilting point (%)
ρd Bulk density (g/cm3)
D Effective root depth of crop(m)
ρw Water density(g/cm3)
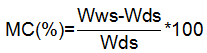
The soil moisture content was determinedto estimate the initial soil moisture content to apply the first irrigation and refill the soil moisture content to field capacity
 (4)
(4)
Where,
MC (%) Moisture content (gm)
Wws Weight of wet soil (gm)
Wds Weight of dry soil (gm)
According to Allen et al (1998) atmospheric evaporating power rate was estimated by
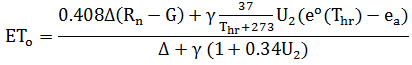 (5)
(5)
Δ Saturation slope vapour pressure curve at Thr [kPa °C-1]
Rn Net radiation at the grass surface [MJ m-2 hour-1]
G Soil heat flux density [MJ m-2 hour-1]
γ Psychometric constant [kPa °C-1]
Thr Mean hourly air temperature [°C]
eo Saturation vapour pressure at air temperature
ea Average hourly actual vapour pressure [kPa]
U2 Average hourly wind speed [m s-1]
The net irrigation requirement was calculated using the following equation
 (3.15)
Where,
NIR Net irrigation requirement(mm)
ETc Crop evapotranspiration(mm/day)
Pe Effective rainfall(mm)
Main effect of drip and furrow irrigation on yield
Analysis of variance showed that the mean values of plant height were statistically significant (p ≤ 0.05) different due to the main effect of irrigation system (Table 5). Statistically significantly higher mean yield (11368.3 kg/ha) was recorded from drip and lower mean yield (5065.8 kg/ha) was recorded from furrow irrigation method. While, there was statistically (p ≤ 0.05) significant difference between drip and furrow irrigation system in weight of five cobs, weight of five cobs seed, weight of thousand seed, Above ground biomass, yield, water use efficiency and harvest index.
| Treat | WFC(g) | WFCS(g) | WTS(g) | BM(kg/ha) | Yld(kg/ha) | WUE(kg/m3 | HI |
|---|---|---|---|---|---|---|---|
| Drip | 207.30a | 929.63a | 326.53a | 22067.9a | 11368.3a | 1.96a | 51.1a |
| Furrow | 192.07b | 837.66b | 298.96b | 14181.1b | 5065.8b | 0.96b | 35.5b |
| Lsd(0.05 | 14.6 | 61.23 | 18.52 | 1827.4 | 797.07 | 0.25 | 5.26 |
| CV | 8.84 | 8.39 | 7.16 | 12.43 | 12.19 | 12.13 | 14.92 |
Means within columns and rows indicated by the same letter are not statistically significant at 5% level of significancy.WFC=weight of five cobs, WFCS, =weight of five cobs seed, WTS=weight of thousand seed weight, BM=above ground biomass, Yld=yield, WUE=water use efficiency, HI=harvest index. Effects of irrigations system and irrigation levels on yield parameters grain yield production of maize has significantly influenced by irrigation system in combination with different irrigation level [5].
Yield-Irrigation Relationship
The result of studies shows that there is a linear relationship between yield and irrigation amount. Some investigation similarly good linear relationships between yield and irrigation water applied in maize subject to drip and furrow irrigation under different irrigation level (Figure 3).

Figure 3. Yield-irrigation amount relationship for drip irrigation system.
However, other studies found a nonlinear relationship between yield and seasonal irrigation amount. The relationship between yield and irrigation amount is affected by factors such as climate, soil properties and irrigation method. This results in lined with the works of Farre and Faci. These factors should be taken into account when proposing deficit irrigation approaches (Figure 4).

Figure 4. Yield-irrigation amount relationship for furrow irrigation system.
In this study, the field experiment under drip and furrow irrigation system was compared in terms of yield. The finding shows that using drip irrigation with 100%ETc gave a yield increase of about 71.48% compared to alternative furrow irrigation at 100%ETc. When comparing drip with furrow irrigation there is a significant difference in grain yield production.
Irrigation & Drainage Systems Engineering received 835 citations as per Google Scholar report


