Research Article - (2023) Volume 12, Issue 4
Received: 19-Jul-2022, Manuscript No. IDSE-22-69593;
Editor assigned: 22-Jul-2022, Pre QC No. IDSE-22-69593(PQ);
Reviewed: 08-Aug-2022, QC No. IDSE-22-69593;
Revised: 19-Sep-2022, Manuscript No. IDSE-22-69593(R);
Published:
27-Sep-2022
, DOI: 10.37421/2168-9768.2022.11.383
Citation: Abelti, Chari. "Performance Evaluation of
Furrow Irrigation using WinSRFR Model: The Case of Batu
Degaga Small Scale Irrigation Scheme." Irrigat Drainage Sys Eng 11 (2022):
361.
Copyright: © 2022 Abelti C. This is an open-access article distributed under the terms of the creative commons attribution license which permits unrestricted
use, distribution and reproduction in any medium, provided the original author and source are credited.
Furrow irrigation is the dominant surface irrigation method applied worldwide. However, the performance of furrow irrigation is low. Advanced simulation models of surface irrigation have been proved to be effective for the evaluation of system design and management. Batu degaga irrigation scheme is one of the small-scale irrigation schemes in ethiopia. Therefore, this study aimed to evaluate the hydraulic performance of furrow irrigation at batu degaga small scale irrigation scheme using the WinSRFR model. A field experiment was conducted and all measurements used for input parameters were collected from the field. The collected data were processed by Microsoft EXCEL and data analysis was conducted using WinSRFR 4.1.3 software. The statistical indicators of NRMSE, R2, RE, d, and λ were used for the comparison between measured and simulated advance time, and recession time. The results of these indicators were 10.5%, 0.98, 0.97, 0.97, and 0.98 for advance time; 2.86%, 0.99, 0.99, 0.9, and 0.995 for recession time which was very good and showed that WinSRFR simulation was acceptable.
Hence, WinSRFR software was employed to evaluate the performance of basic indicators of furrow irrigation such as application efficiency, distribution uniformity, and deep percolation. The study revealed that the average application efficiency, deep percolation, and distribution uniformity were 58.2%, 41.8%, and 89% under 1ls-1 inflow rate respectively, and 54.3%, 45.7%, and 91% under 1.5 ls-1 inflow rate respectively for 100 m furrow length with 0.2% bed slope. This indicates the hydraulic performance of the furrow irrigation system of the study area was poor, even though the greater performance was attained under 1ls-1 inflow rate compared to 1.5 ls-1 inflow rate, Finally, the optimum combination of furrow hydraulic parameters should be identified and suggested for effective management and use of irrigation water to improve performance of furrow irrigation of the study area.
Furrow irrigation • Performance evaluation • WinSRFR • Simulation • Batu degaga irrigation scheme
Background
Furrow irrigation is a widely used irrigation method; however, the systems are often inefficient because of poor irrigation performance [1]. It is considered as low water application efficiency and distribution uniformity [2].
Water application efficiency is influenced principally by the amount of water applied, the intake characteristics of the soil, and the rate of advance of water in the furrows [3]. The inappropriate management, design, and implementation are the important reasons for the poor performance of surface irrigation systems [4]. According to Manisha, the reduced level of performance in a furrow irrigation system can be attributed to incorrect dimensioning, and also the poor design and evaluation managements are generally responsible for inefficient irrigation, leading to the waste of water, waterlogging, salinization, and pollution of surface and groundwater resources. To reduce costs and decrease time in the analysis of performance indicators, it is essential to use mathematical models to simulate surface irrigation [5]. Simulation in surface irrigation systems is the process of mathematically describing the hydraulic characteristics of water as it flows from one end of the field to the other based on mathematical equations known as Saint Venant equations [6]. So, this study focuses on evaluating the hydraulic performance of the furrow irrigation systems using the WinSRFR model.
Description of the study area
Batu Degaga Irrigation Project is located in the upper valley of Awash river basin near Sodare, around 7 km on the left side of the road from Melkassa town to Sodare in East Shoa administrative zone, Adama Woreda. Geographically, the farm is located at a latitude of 80 25’ North and a longitude of 390 25’ East. Based on the climatological data of Melkassa research center, the nearest weather station, the rainfall in the region can be estimated to vary between 700 mm to 860 mm mainly received from June to September followed by a distinct dry spell up to January. The average monthly minimum and maximum temperatures in the project area are in the order of 11°C and 33°C, respectively. The area is belonging to the semi-arid drought-prone region of the country. The land for the irrigation projects is characterized by plain land of a very gentle slope, which is suitable for surface irrigation (Figure 1).

Figure 1. Location map of the study area.
Field measurements
A field experiment was carried out at the Batu Degaga irrigation scheme starting from 1 March to 15 May 2020. The experimental field had a size of 3.6 m × 100 m with six blocked ended furrows of 0.6 m furrow spacing and 0.2% bed slope. There were two treatments 1ls-1 and 1.5ls-1 with three replications of irrigation events. The inflow to every furrow was applied using a g 4.2 cm inner diameter siphon. All data were collected from four middle furrows and the other two furrows were taken as buffer furrows. Soil lab analysis was conducted at Melkassa agricultural research center. The soil moisture sampling of the 60 cm root zone was conducted at 0 cm-20 cm, 20 cm-40 cm, and 40 cm-60 cm depth intervals using a core sampler.
Furrow infiltration rate
Infiltration in a furrow was determined through inflow and outflow analysis by taking a representative segment of the furrow.
Where,
y-equivalent depth of infiltration (mm);
L-length of the furrow segment (m);
p-adjusted wetted parameter (m);
Vin-volume of inflow (l);
Vout-volume of water outflow (l);
Vs-volume of stored (l);
s-furrow slope in (m/m);
n-roughness coefficient and Q-discharge (l/s).
Furrow configuration
The geometry of furrows is important when evaluating their hydraulic characteristics. Furrow cross-sections such as width, depth, and cross-sectional area were determined using installing wooden pieces along each furrow. The slope of the furrow’s bed was measured by using a surveying instrument. The staff level was set up in-furrow at a convenient location from where several stations could be read. The weighted average method was used to calculate an average furrow’s slope.
Advance and recession time
The advance rate of the waterfront down the furrow is the rate at which the waterfront advances through the furrow. For determining the advance rate, stakes were fixed at every 5 m distance along the furrow length. The time was recorded when the irrigation water supply was applied to each furrow and when the advancing front reaches each station. After the irrigation is terminated, the tailwater recedes downstream of the furrow. Recession times were recorded at times when the water disappeared from the furrow bed at each station.
WinSRFR software
WinSRFR is a new software for evaluating and simulating surface irrigation. WinSRFR needs diff erent data to analyze irrigation performance. Data required for software include inflow, geometric properties, and depth of water application. WinSRFR software consists of zero-inertia and kinematic wave model. The WinSRFR is coded into four colors worlds with the names Event Analysis World (Irrigation event analysis and parameter estimation functions), physical design world (Design functions for optimizing the physical layout of a field), operations analysis world (Operations functions for optimizing irrigations) and Simulation World (simulation functions for testing and sensitivity analysis) [7].
Calibration of infiltration parameters
Due to the sensitivity of furrow irrigation performance to infiltration parameters, it is necessary to calibrate them. In this paper, Kostiakov- Lewis coefficients were calibrated using Event Analysis World and Merriam and Keller’s method in the WinSRFR software.
In which t=opportunity time k (L/Ta)-constant, a (.)-Exponent, b (L/ T)-steady infiltration rate, and c (L)-instantaneous infiltration depth (through cracks and macro-pores). In practice, b is a fitting parameter determined from infiltration measurements. The equation is commonly identified in the literature as the Kostiakov-Lewis equation. In many field situations, infiltration is dominated by water flow through cracks and macro-pores. To account for this effect, the Kostiakov equation was further modified in the SRFR program by adding a constant c. To estimate k, diff erent combinations of a, b (fo), and c were tested over an approximate range until the measured and simulated advancerecession curve could find the best convergence.
Statistical analysis
The advance-recession curve was simulated by the WinSRFR software. In this study, four statistical criteria were used to analyze software's accuracy. These statistical criteria were: Normalized Root Mean Square Error (NRMSE), Distribution to 45°line (λ), Wilmot agreement (d), coefficient of determination (R2), and Relative Error (RE) as follows equations (5) to (8). In addition, the Relative Error (RE) criterion was used to compare the field and simulated performance parameters (equation 9).
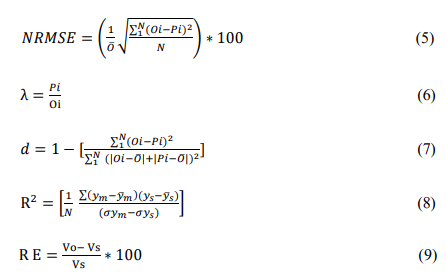
Where in equations (5, 6, and 7) Oi and Pi are the observed and predicted values of the advance and recession times, respectively; and (O) is the average measurement. In equation (8) ym and ys are observed and predicted values of the advance and recession times, respectively; (ys) (ym) and (ys) are the average observed and predicted values of the advance and recession times, respectively; σym and σys are the standard deviation of observed and predicted values of the advance and recession times, respectively and N is the number of measurements. In equation (9) Vs and Vo is the simulated and observed performance indicator values, respectively.
Irrigation performance analysis
Anwar reported that application efficiency and distribution uniformity are the common indicators for the evaluation of surface irrigation; while, gonzalez used distribution uniformity as a performance indicator. Chen used application efficiency, average depth applied, and distribution uniformity. Kifle used different indicators such as application efficiency, distribution uniformity, and deep-percolation and runoff volume, as indicators. In this study, three performance parameters were determined including application efficiency, distribution uniformity, and deep percolation. For this purpose, soil moisture samples were taken using the Auger core sampler before and after two days (48 h).
Application efficiency: Application Efficiency (AE) is the ratio between the depth of water held in the root zone of the soil profile after the irrigation and the total depth of water applied during the irrigation.

Where Zi and Zd are the depths of water added to the root zone (mm) and the depth of water applied to the furrow (mm), respectively.
Deep percolation: It is the ratio of the depth of water percolated below the bottom boundary of the root zone to the total depth admitted into the subject region.
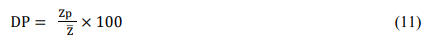
Where depth ZP and (Z) are the depths of deep percolated water (mm) and the mean of depths infiltrated over the furrow length (mm), respectively.
Distribution uniformity: Distribution Uniformity (DU) was determined as the minimum infiltrated depth divided by the average infiltrated depth.
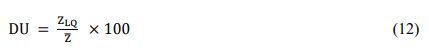
Where ZLQ and (Z) are the mean water depth infiltrated in the lower quarter (mm) and the mean of depths infiltrated over the furrow length (mm), respectively.
Simulation of furrow irrigation
In this study, the event analysis world was used to estimate and calibrate the infiltration parameters. Furthermore, the operation analysis and physical design world were used to evaluate the irrigation and geometric parameters and the zero-inertia model was used to simulate and evaluate furrow irrigation performance. After execution, the accuracy of the WinSRFR software in simulating advance and recession times was evaluated by comparing them with the measured data. The result of the field experiment indicated that the measured data of advance and recession time was not the same for three irrigation events under both 1 ls-1 and 1.5 ls-1 inflow rates.
The measured and simulated advance times expressed with NRMSE, d, λ, and R2 were 5.22%, 0.947, 0.999, and 0.998 for the first irrigation event; 5.54%, 0.964, 0.999, and 0.999 for second irrigation event and 11.76%, 0.976, 0.994 and 0.996 for third irrigation event respectively under furrow inflow rate of 1 l/s which indicate the high accuracy of simulating the advance time [8].
The measured and simulated recession times NRMSE, d, λ and R2 were 2.88%, 1, 0.996 and 0.987 for first irrigation event; 2.27%, 1.01, 0.997 and 0.991 for second irrigation event and 1.71, 0.997, 0.998 and 0.996 for third irrigation event, respectively, under furrow inflow rate of 1 ls-1. The average statistical comparison between simulated and measured expressed with NRMSE, d, λ, and R2 was 7.50%, 0.962, 0.997, and 0.997 for advance time; 2.29%, 0.999, 0.997 and 0.992 for recession time which indicates the accuracy of the simulation is very good as shown in Table 1 [9].
| I.no | In. rate (l/s) | Advance time | Recession time | ||||||
| NRMSE (%) | λ | D | R2 | NRMSE (%) | λ | D | R2 | ||
| 1 | 1 | 5.215 | 0.947 | 0.999 | 0.998 | 2.88 | 1 | 0.996 | 0.987 |
| 2 | 5.536 | 0.964 | 0.999 | 0.999 | 2.27 | 1.01 | 0.997 | 0.991 | |
| 3 | 11.76 | 0.976 | 0.994 | 0.996 | 1.71 | 0.997 | 0.998 | 0.996 | |
| Average | 7.504 | 0.962 | 0.997 | 0.998 | 2.29 | 0.999 | 0.997 | 0.992 | |
| 1 | 1.5 | 12.27 | 1.04 | 0.993 | 0.998 | 4.34 | 1.03 | 0.997 | 0.988 |
| 2 | 14.1 | 1.04 | 0.991 | 0.993 | 3.74 | 0.999 | 0.994 | 0.991 | |
| 3 | 14.3 | 1.04 | 0.991 | 0.994 | 2.21 | 0.969 | 0.998 | 0.995 | |
| Average | 13.56 | 1.04 | 0.992 | 0.994 | 3.43 | 0.999 | 0.996 | 0.994 | |
For furrow inflow rate of 1.5 ls-1 the relationship between the measured and simulated advance time expressed with NRMSE, λ, d and R2 were 12.27, 1.04, 0.993, and 0.998 for the first irrigation event; 14.1, 1.04, 0.991 and 0.993 for second irrigation event and 14.3, 1.04, 0.991 and 0.994 for third irrigation event respectively. And also for the measured and simulated recession time NRMSE, λ, d and R2 were 4.34%, 1.03, 0.997, and 0.988 for the first irrigation event; 3.74%, 0.999, 0.994, and 0.991 for second irrigation event and 2.21, 0.969, 0.998 and 0.995 for third irrigation event. The average statistical comparison between simulated and measured expressed with NRMSE, λ, d, and R2 were 13.56%, 0.994, 0.992, and 1.04 for advance time; 3.43%, 0.999, 0.996, and 0.994 for recession time which indicates the accuracy of the simulation was very good. But the accuracy of the simulation was high under 1 l/s than 1.5 ls-1. Overall measured and simulated recession time was in the same trend as the comparison of measured and simulated advance time under the experimental conditions with very good predictions and acceptable outputs [10,11].
Performance analysis of furrow irrigation
The irrigation status of small farms is always sensitive to irrigation management. Performance evaluation of furrow irrigation was done based on the measurement undertaken on selected furrows using the WinSRFR model. In surface irrigation mainly Furrow irrigation, the factors influencing performance are field length, width, furrow crosssection shape, bottom slope, and soil infiltration and surface roughness parameters. The feasible way to study the combined influence of some variables, or all of them at the same time, is through simulation models. The irrigation indicators such as application efficiency, deep percolation, and distribution uniformity were evaluated.
The study shows that the performance of furrow irrigation was poor. The furrow irrigation has an average application efficiency of 58.2% and 54.3% under 1 l/s and 1.5 ls-1 furrow inflow rates. This indicates application efficiency was not in the recommended range for all irrigation events. On the other hand, the deep percolation was high during all irrigation events which indicates more amount of irrigation water lost before the crop conception. The furrow irrigation has an average deep percolation of 41.8% and 45.7% under 1 l/s and 1.5 ls-1 furrow inflow rates respectively. The reason for this may be that the inflow volume and cut-off time were greater than the required. Despite poor application efficiency, there is a very good distribution uniformity under both inflow rates which is above 89% (Table 2).
| Performance indicator | Furrow inflow rate (Qo=1 l/s) | Furrow inflow rate (Qo=1.5 l/s) |
|---|---|---|
| Application Efficiency | 58.2 | 54.3 |
| Deep Percolation | 41.8 | 45.7 |
| Distribution Efficiency | 89 | 91 |
The irrigation performance of the furrow irrigation system in the case of Batu’s small-scale irrigation scheme was evaluated. Simulation using WinSRFR 4.1.3 provided a quantitative illustration of existing irrigation performance.
This study was conducted to evaluate furrow performance indicators using WinSRFR software. The modified Kostiakov-Lewis equation was employed to estimate the infiltration characteristics and calibrated using the merriam-claire volume balance method. The statistical indicators of NRMSE, R2, RE, d, and λ were used for the comparison between measured and simulated advance time and recession time. The results of these indicators were very good and showed that the WinSRFR simulation was acceptable. The existing irrigation application efficiencies of irrigated fields at batu small scale irrigation have a mean value of AE of less than 60%. In general, the performance of the furrow irrigation system in the study area was poor that needs more design and management decisions to improve the performance.
The performance of furrow irrigation at the batu small scale irrigation scheme can be significantly improved by using a combination of furrow irrigation parameters. So, to improve the performance of furrow irrigation the optimal furrow length, inflow rates, and cutoff times at suitable furrow slopes should be identified and suggested. Finally, still, most studies were focused on long furrows, hence, further study concerning the short furrow hydraulics is important, and optimal design of furrow irrigation systems should be practiced.
The author declares that there are no conflicts of interest.
Irrigation & Drainage Systems Engineering received 835 citations as per Google Scholar report


