Research - (2021) Volume 10, Issue 12
Received: 09-Dec-2021
Published:
30-Dec-2021
Citation: Tokuma Adamu, Mekonen Ayana, Gebremeskel Aregay. “Optimization of Furrow Irrigation Decision Variables: The case of Wonji Shoa Sugarcane Plantation, Ethiopia.." Irrigat Drainage Sys Eng 10 (2021): 304.
Copyright: © 2021 Tokuma Adamu, et al. This is an open-access article distributed under the terms of the Creative Commons Attribution License, which permits unrestricted use, distribution, and reproduction in any medium, provided the original author and source are credited.
Surface irrigation type is one of the most widely used in the world due to its low cost investment. However it is complex methods of applying water to soil, because of extremely difficult to achieve good control over the highly variable nature of the movement of water across a soil surface and its infiltration into the soil over a season. This complexity leads low efficiency of the system because of failure in management and design. In this study, it is attempted to optimize furrow irrigation decision variables at Wonji sugar estate using field experiment and two simulation models. The hydraulic performance of the existing system was evaluated using two systematically selected furrows. Accordingly, an application efficiency of 43% and 25% were obtained. The performance of the system was evaluated as poor due to excess application of water and less management skills of irrigation application. One experimental site was selected at field number of 85 for optimization of decision variables. The field data (before irrigation, during irrigation and after irrigation event) of experimental site (at field number 85) was measured as input for models and simulated using the SIRMOD software and Win SRFR software package. Furrow length of 32m, 48m, and 64m, slope of 0.05%, 0.075% and 0.1%, and flow rate of 3l/ sec, 4l/sec and 5l/sec were analyzed with three replication using volume balance method and two simulation models. Therefore, from the current findings, the optimum decision variables that gave maximum application efficiency and distribution uniformity was slope 0.1%, furrow length 32m,and inflow flow rate 4 l/sec at cut-off time 15.79 minutes. Thus, to improve the performance of furrow irrigation practice, optimal furrow length, inflow rates and cut-off time found by this study could be adopted.
Furrow Irrigation • Decision Variables • Optimization • Irrigation Efficiency
Abbreviations: AE= Application Efficiency • DU= Distribution Uniformity • ES= Storage Efficiency • FAO= Food and Agricultural Organization • TAW =Total Available Water • Tco =cut-off time • USDA= United State Development Agricultural • VBM =Volume Balance Model
Surface irrigation is the most common method of irrigation and accounts for 95% of irrigation in the world. It is well suited for use on both small and large schemes [1]. Relatively to surface irrigation, pressurized irrigation method has high efficiency and requires high cost for its installation which may not be affordable for majority of the poor in developing countries. As an alternative, surface irrigation method is widely used due to low capital investment involved, low operating costs and ease of operation and maintenance [1]. Also surface irrigation systems are less affected by climatic and water quality characteristics. However, surface irrigation systems are typically less efficient in applying water than pressurized irrigation systems because of, extremely difficult to achieve good control over the highly variable nature of the movement of water across a soil surface and its infiltration into the soil over a season. Therefore, the land under surface irrigation tends to be more affected by water-logging and soil salinity if adequate drainage is not provided [2]. Even though, it is unrealistic to apply irrigation without loss. These loss appear in the application of irrigation water too less or too much and too short or too large of furrow length. Deep percolation results when water is applied too long to the field and/or the variation of intake opportunity time is too large (inflow rates are too small). These two problems can be remedied by adjusting the time of cutoff (tco) and inflow rate (Qo) [3].
Availability of irrigation water itself is becoming a constraint in some sites, possibly because more farmers have started irrigating than schemes were designed to support [4]. Adequate water management for irrigated agriculture holds a considerable significance for the future of the Ethiopian agriculture. Irrigation water for Wonji-Shoa Sugar Estate scheme is supplied via a pumping station on Awash River [5]. In Awash Basin, many industries and major cities abstract water from Awash River. This creates a risk as growing volumes of industrial effluent and urban wastewater are contaminating the water and causing scarcity by reducing the quality of surface water available for downstream users [6]. Further, stated there was a high water application rates compared to irrigation water requirement of crops in most irrigated areas [6]. Poor water management and excess irrigation water application in turn created the problems of environmental issues (water-logging and salinization), escalating multi-sectoral water demands in the basin and conflict between upstream user (Wonji) and downstream user (Merti) [7]. For this reason, water management at Wonji-Shoa Large-scale Irrigation Scheme needs critical attention which failed under low efficiency of the system because of failure in management and design [5].
Significant water savings can be achieved through improving the application of irrigation water at the field level by reducing the amount of water lost to the crop through deep percolation and surface runoff [8]. This can be achieved only by efficient irrigation systems designed at farm level combined with optimization of management decision variables like: the furrow discharge, cut of time and furrow length as decision support variables [9].
Decision variables are those parameters or variables that an irrigation designer or operator can adapt to find the best irrigation performance for given or selected field parameters. These are normally the field dimensions (length and width), the flow rate and the cutoff time [1]. The main design and managing irrigation events in surface irrigation considers choosing of decision variables [10]. These variables are unknown and should be specified by the optimization. The furrow length is a function of depth of irrigation water and bed slope of the furrow and soil texture. The optimized variables are used to modify future irrigations in order to achieve the desired level of performance. Based on principal of cost minimization and irrigation efficiency maximization described that result of the calculations related to inflow rate , length of furrow, irrigation time and irrigation efficiency. The authors stated that with the minimization of cost results of minimized inflow rate and time cutoff in respect to the irrigation efficiency is maximized.
Okereke, also optimized the inflow rate using simulated advance and recession curves and gets 0.03m3/min/m. The authors stated that the optimized inflow rate gave satisfactory water distribution uniformity and application efficiency for three growth stages of maize: 87% and 89% for emergency stage, 75% and 60% for development stage, and 95% and 89% for maturing stage respectively.
In addition, for the existing furrow length (100m) with uniform inflow rate, obtained optimum inflow rate (5l/sec) and cut-off times (45min) that showed better application efficiency (81.16%) and better distribution uniformity (93.43%) of Irrigation System at Tendaho Sugar Estate.
Different researchers in Wonji/Shoa plantation estate have conducted researches focusing on performance assessment of pumps, canals and night storage reservoir. But for water use efficiency, an assessment of performance of on-farm irrigation is vital and resulted from optimization of decision variables which obtained by both numerical and simulation model. The objectives of this paper is to optimize furrow irrigation decision variables (inflow rate, cutoff time and furrow length) using algebraic equation and simulation model based.
Experimental site
The field experiments were carried out at Wonji Shoa Sugarcane Plantation, Oromia, Ethiopia located at latitude of 8030' to 8035' N and longitude of 39010' to 39020' E at an altitude of 1540 m above mean sea level [Fig. 1]. The Estate was established in 1951 G.C.by foreign private investors, Ethiopian government and Netherland’s H.V.A. Company. Wonji sugar factory is one of the first modern sugar industry in Ethiopia with initial production capacity of 140 tons of sugar per day. Then, Shoa Sugar Factory was established in 1962 with 170 tons of sugar production capacity per day. The two factories are known by the name of Wonji Shoa Sugar Factory (WSSF) and administered as one factory (Figure 1).

Figure 1. Map of Study Area (Source: Degefa and Saito, 2017).
Climate
The estate experiences a bimodal rainfall pattern, receiving the major rains during July-September and March–April. Wonji-Shoa Sugar Estate has more than 30 year’s weather data base including the rainfall, minimum temperature, maximum temperature, and average annual rainfall in the area. Mean maximum and minimum temperature of the area are 27.60ºC and 15.30ºC respectively. The mean annual, mean evapo-transpiration, Annual irrigation demand, and Average measured annual irrigation supply rainfall is about 820 mm, 4.6 mm/ day, 80 Mm3 and 121 Mm3 respectively.
Soil and crop type
Clay loam soil textures are the most dominant soil type in the area with few places of sandy loam, clay loam and silt loam. The main crops grown at the area is sugarcane that used as raw materials for the sugar industries’ production.
Data Collection Techniques/Procedures
Prior to any activities, the land had sloped by machine to predetermined single (adjusted once) slope level which was adopted by organization and then, sloped furrow back leveled to zero percent by human power for experiment. After all furrows were leveled, change in elevation of each slope was calculated and drilled at downstream end of the furrow. The primary data was collected from field focusing on furrow irrigation practices and the secondary data also was collected from the Wonji Sugar Estate of planning and plantation office. The primary data used as basic input for SIRMOD and WinSRFR models were collected from the furrows field are: field topography; inflow rate; furrow geometries (furrow length, furrow depth, furrow width, furrow spacing, furrow bottom slope, furrow cross sectional area and wetted perimeter); soil infiltration parameters, soil roughness, application depth and cut-off time. The required data such as furrow characteristics and soil moisture contents were collected from March to June 2020. The experiment was prepared with aim of optimizing that furrow length, inflow rate and cut-off time of the existing system in practice. The treatments applied were slopes, furrow lengths and flow rates. Each treatment has three levels with three replications. The treatment levels were 0.05, 0.075, 0.1% furrow slopes (S), 32, 48, 64 m furrow lengths (L) and 3, 4, 5 lit/s flow rates (Q) depending on the maximum non erosive stream size with split-split plot design where slopes constituted the main plot factor, furrow lengths constituted the sub-plot factors and flow rates constituted the sub-sub-plot factors.
Each furrow set was consisting of four furrows having 5.8 m and flow rates were assigned randomly. The middle three furrows were used for testing of irrigation event parameters and the outer furrows used as a buffer to control the effects of lateral flow and the field layout was shown in Figure 2. The experiment was conducted under normal field conditions over two irrigation events. Amount of water to be applied during each event was determined based on soil moisture deficit level at root depth assuming equal to required depth of application during each irrigation event. Furrow cross sections were determined using profile-meter and the data were used to compute infiltration parameters by volume balance analysis following procedure. And the computed parameters values were shown in Table 1.

Figure 2. Field layout of the Experimental plot.
| Irrigation Event | Surface roughness(n) | fo(m3/min/m) | k(mm//hra) | a(-) |
|---|---|---|---|---|
| First | 0.04 | 0.00542 | 0.33567 | -0.188 |
| Second | 0.03 | 0.00542 | 0.22911 | -0.107 |
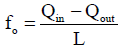
The procedure begins by determining basic infiltration rate (fo) from inflow-outflow hydrograph
 (1)
(1)
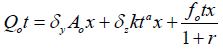
Next volume balance equation defined as: Where Ao = cross sectional area of flow at inlet, m2
 (2)
(2)
Qo = inlet discharge, m3/min
T= elapsed time since irrigation started, min
Δy = surface storage shape factor (ranged 0.70 to 0.80)
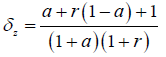
δz = subsurface storage shape factor, defined as
 (3)
(3)
r = The exponent in power advance equation, defined as
 (4)
(4)
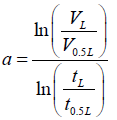
Thirdly, using two point method the two empirical fitting parameters (a and k) are computed
 (5)
(5)
 (6)
(6)
 (7)
(7)
 (8)
(8)
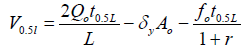
Where t 0.5L= advance time at one-half field length, min
T L = advance time to the end of field length, min
L= field length, m
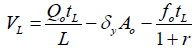
V0.5l = infiltrated volume at one-half field length, m3/m
VL= infiltrated volume at end of field length, m3/m
Furrow flow rates were measured using 3 inches Parshal-flumes which were placed at the upstream of the experimental plot, 5m far from inlet furrow. Prior to the test, the PVC pipe having 75 mm, 90 mm and 110 mm diameter buried at inlet of furrow to distribute flow rates over the replication equally. During the test, advance and recession times were measured for each treatment plots combination. Stakes were driven into the soil along the furrows at fixed interval of 16 m before irrigation events. Advance times were recorded at the time when water reach at each stakes while recession times (trec) were recorded at times when water fully infiltrated or disappeared from the furrow bed at observation sections. After determining the depth of water retained in the soil profile, performance indicators were calculated.
Soil data collection
Composite of undisturbed soil samples at two soil depths, 0-30 and 30-60 cm were taken from six spots for the field experiment. The collected undisturbed soil samples were analysed at Wonji Sugar Corporation Research Center Laboratory for bulk density determinations. Soil bulk density was determined using the methodology described.
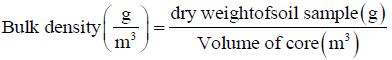 (9)
(9)
Using core samplers of known volume and the samples weighted and placed in Oven Dry at 105ºC for 24 h. Field capacity and permanent wilting were taken from the estate as secondary data. The percentage of sand, silt and clay of the composite soil sample were determined by hydrometer analysis method. After the percentage of sand, silt, and clay was graded, finally the soil textural class was assigned using the USDA textural triangle.
Soil Physical Properties
The soil data samples were taken from the field plot for determination of bulk density, soil texture and moisture content. As per the results obtained, which is presented in Table 3, the soil textural class is heavy clay type with Field capacity (FC) of 52.7% and Permanent Wilting Point (PWP) of 24.3% on weight basis. The bulk density of the study area sampled from six spot was found to be presented in Table 4. As a result observed the average bulk density of soil was 1.10 g/cm3 (Table 2).
| Soil depth (cm) | Particle size distribution (%) | textural class | Field capacity (%) | Permanent wilting point (%) | ||
|---|---|---|---|---|---|---|
| Sand | Silt | Clay | ||||
| 0-30 | 10 | 19 | 71 | heavy clay | 50.5a | 24.2a |
| 30-60 | 10 | 15 | 75 | heavy clay | 54.9a | 24.4a |
| Average | 10 | 17 | 73 | heavy clay | 52.4 | 24.3 |
| Spot | Depth | core code | wet weight (g) | core weight (g) | bulk density(g/cm3) | |
|---|---|---|---|---|---|---|
| (cm) | ||||||
| 1 | 0-30 | 01T | 286.375 | 108.264 | 1.18793 | |
| 30-60 | 02T | 289.278 | 103.87 | 1.10106 | ||
| 2 | 0-30 | 03T | 288.563 | 106.353 | 1.01103 | |
| 30-60 | 04T | 275.769 | 107.027 | 0.96182 | ||
| 3 | 0-30 | 05T | 288.338 | 107.085 | 1.19363 | |
| 30-60 | 06T | 254.236 | 108.242 | 0.91094 | ||
| Average 1.1(g/cm3) | ||||||
| Soil depth (cm) | Particle size distribution (%) | textural class | Field capacity (%) | Permanent wilting point (%) | Bulk density | ||
|---|---|---|---|---|---|---|---|
| Sand | Silt | Clay | |||||
| 0-30 | 13 | 32 | 55 | heavy clay | 31.18 | 28.52 | 1.17 |
| 30-60 | 5 | 38 | 57 | heavy clay | 38.33 | 34.51 | 1.08 |
| Average | 10 | 17 | 73 | heavy clay | 34.755 | 31.515 | 1.13 |
According to the result obtained the maximum and minimum soil moisture content before irrigation events was observed as 54 % and 35 % of volume base respectively. As this result indicated that the soil moisture content was average of 46.52% in volume base (Table 3).
Soil infiltration and Surface Roughness
Typical value of roughness (n) was taken as 0.04 and 0.03 for first and later irrigation events respectively.
As the result indicated the infiltration function over the two events were formed in equation Z1 and equation Z2 respectively
Where: Z1 = cumulative infiltrated depth for first irrigation event and
Z2 = cumulative infiltrated depth for later irrigation event.
Hydraulic Performance Evaluation of Existing Furrow Irrigation System
Existing irrigation system was carefully evaluated to identify that may be effective and feasible in improving the systems’ performance. As early stated the dominant soil type of the estate was heavy clay soil. Two fields were selected for furrow length of 32 m and 48 m and all input parameters were measured accordingly. The soil physical characteristics of the field like soil texture, field capacity, permanent wilting point, bulk density and soil moisture content before irrigation event were presented in tables 5 and 6 respectively (Table 4).
| Furrow length interval (m) | Depth | can weight(g) | weight of dry sample(g) | soil moisture % |
|---|---|---|---|---|
| (cm) | ||||
| 16 | 0-30 | 12.7808 | 29.0768 | 33.2103 |
| 30-60 | 12.542 | 47.2242 | 39.4933 | |
| 32 | 0-30 | 12.72 | 31.585 | 34.151 |
| 30-60 | 11.791 | 37.398 | 44.7668 | |
| Average | 0-30 cm | 33.6807 | ||
| 30-60 cm | 42.1301 | |||
| Field number | Hydraulic performance indicators | |||
|---|---|---|---|---|
| Furrow length (m) | Application efficiency (%) | Distribution uniformity (%) | Deep percolation (%) | |
| 16 | 48 | 43 | 86 | 57 |
| 108 | 32 | 25 | 44 | 75 |
The result revealed that the heavy clay soil with particle size distribution of 10 %, 17% and 73 % sand, silt and clay respectively with required application depth of 14 mm which were computed before irrigation events by assuming required application depth equal to soil moisture deficit. The hydraulic performance of the field was evaluated over the irrigation events by using WinSRFR software package (Table 5).
The estate applies 75 l/sec of flow rate per six furrows through tube at inlet of field. Each furrow inlet receives 12.5 l/sec according to the estate application. The two existing field number (16 and 108) of application efficiency and distribution uniformity were 43% and 86% for field number 16, and 25% and 44% for field number 108 respectively. The results of evaluation were presented in Table 6.
Narayana and Abate stated that the typical application efficiency range was between 60% and 80%. According to the evaluation indicated, the existing system of the estate was low performance. Application efficiency was affected by the rate of supply, bed slope, infiltration rate of soil, storage capacity of the root zone and land leveling. The water distribution profile from an irrigation event of existing indicated in Figure 3.

Figure 3. Advance/recession curve of existing system.
The system analyzed by WinSRFR software package and shows that the recession time delayed because of high application of inflow rate which is 75 l/sec per furrow set (6 furrows). In addition, the water advance the down end field quickly, the reason is that high flow rate used to increase gravity force that drive flow. The deep percolation of the result became high with heavy clay soil type because of the end condition of the field is closed and there is no surface runoff loss occurred. The only chance for loss is deep percolation. The result comes from insufficient design variables (furrow length and slope) and low level of management on-field practice. Since the irrigators assigned at each field number have different management skill, the irrigation efficiency at each field was varying. There was over irrigation that results high deep percolation loss. From less performance systems, maximum yield of production is unexpected. According to findings the relative yield has direct relationship with storage efficiency of the system. For this reason, the system should be improved to save water use (application efficiency) and to give maximum yield production (storage efficiency).
Measurement of Advance and Recession Time
Before any measurement was undertaken, the pharshall flume was installed at 5 m from furrow inlet as shown in figure 4. The measurement was taken at 2 min initially and increased 5min and 10min until the required head has reached. The relationship between stream size and head of 3-inch pharshall flume. After required stream size reached the four tubes installed at inlet furrow were opened at the same time (Figure 4).

Figure 4. Measuring stream size by parshall flume.
The time of advance water front was recorded by stopwatch at 16 m interval of distance starting from application of water to the inlet furrow along the length of 32 m, 48 m and 64 m which was presented in Figure 5.

Figure 5. Recording of Advance time.
The stream was cutoff when waterfront reached to the end of the furrows. The recorded advance and recession time of waterfront in experimental plot during both irrigation events were recorded. The advance relationships between the first and later irrigation events were developed by excel software and presented in Figure 6.

Figure 6. Advance and recession curve of first and later irrigation events.
The result of revealed that the advance time of the first irrigation event was delayed than the later irrigation event because of, at first there is high infiltration than the later and at later there is moisture of the first irrigation that leads water to fast to the end of the field.
Optimal hydraulic performance parameters
The hydraulic performance indicators of the field were evaluated by assuming calculated target application equal with soil moisture deficit.
Optimal hydraulic performance parameters simulated with WinSRFR
The simulation model restricted to use Zero Inertia model because of the end condition of the furrow is blocked which is not applicable in Kinematic wave model (Table 7).
| Treatments | Hydraulic performance indicators | |||||
|---|---|---|---|---|---|---|
| First irrigation event | Later irrigation event | |||||
| Application efficiency (%) | Distribution uniformity (%) | Deep percolation (%) | Application efficiency (%) | Distribution uniformity (%) | Deep percolation (%) | |
| S1L1Q1 | 74 | 95 | 26 | 29 | 95 | 71 |
| S1L1Q2 | 36 | 96 | 64 | 13 | 96 | 87 |
| S1L1Q3 | 25 | 97 | 75 | 9 | 97 | 91 |
| S1L2Q1 | 28 | 95 | 72 | 30 | 92 | 70 |
| S1L2Q2 | 39 | 93 | 61 | 14 | 93 | 86 |
| S1L2Q3 | 24 | 96 | 76 | 9 | 96 | 91 |
| S1L3Q1 | 10 | 98 | 90 | 4 | 98 | 96 |
| S1L3Q2 | 20 | 95 | 80 | 7 | 95 | 93 |
| S1L3Q3 | 35 | 92 | 65 | 12 | 92 | 88 |
| S2L1Q1 | 76 | 93 | 24 | 29 | 92 | 71 |
| S2L1Q2 | 62 | 94 | 38 | 24 | 93 | 76 |
| S2L1Q3 | 66 | 94 | 34 | 28 | 92 | 72 |
| S2L2Q1 | 44 | 89 | 56 | 17 | 89 | 83 |
| S2L2Q2 | 46 | 88 | 54 | 17 | 89 | 83 |
| S2L2Q3 | 70 | 90 | 30 | 27 | 89 | 74 |
| S2L3Q1 | 15 | 95 | 85 | 6 | 94 | 94 |
| S2L3Q2 | 25 | 91 | 75 | 9 | 91 | 91 |
| S2L3Q3 | 35 | 88 | 65 | 11 | 89 | 89 |
| S3L1Q1 | 80 | 92 | 20 | 29 | 81 | 71 |
| S3L1Q2 | 86 | 89 | 14 | 34 | 88 | 66 |
| S3L1Q3 | 25 | 94 | 75 | 9 | 94 | 91 |
| S3L2Q1 | 28 | 90 | 72 | 11 | 89 | 89 |
| S3L2Q2 | 57 | 89 | 43 | 20 | 89 | 80 |
| S3L2Q3 | 23 | 92 | 77 | 9 | 91 | 91 |
| S3L3Q1 | 50 | 85 | 50 | 19 | 85 | 81 |
| S3L3Q2 | 39 | 82 | 61 | 14 | 82 | 86 |
| S3L3Q3 | 34 | 84 | 66 | 12 | 84 | 88 |
Note: S(1,2,3)=Slope level 1,2,and 3 L(1,2,3)= Furrow length level 1,2,and 3 Q(1,2,3)= Furrow inlet discharge(Stream size) level 1,2,and 3
According to result indicated in table 8, the maximum application efficiency of 86% and 34% obtained by S3L1Q2 treatment in first and later irrigation respectively. As the result observed the efficiency of the later irrigation has decreased due to less requirement depth which is based on soil moisture deficit with the same amount of applied of water. The result agreed with Solomon (2010) findings which stated that the application efficiency varies between irrigation events.
| Treatments | Performance indicators | |||||||
|---|---|---|---|---|---|---|---|---|
| Full Hydrodynamic model | Zero Inertia model | |||||||
| Ae (%) | Re (%) | Du (%) | Abs.Dist.u (%) | Ae (%) | Re (%) | Du (%) | Abs.Dist.u (%) | |
| S1L1Q1 | 53.15 | 97.05 | 63.03 | 11.6 | 53.26 | 97.26 | 64.71 | 11.06 |
| S1L1Q2 | 26.66 | 100 | 67.6 | 43.73 | 26.66 | 100 | 66.41 | 43.51 |
| S1L1Q3 | 18.51 | 99.92 | 66.05 | 13.02 | 18.53 | 100 | 74.81 | 59.65 |
| S1L2Q1 | 13.57 | 69.69 | 0 | 75.7 | 13.57 | 69.69 | 0 | 76.84 |
| S1L2Q2 | 45.25 | 100 | 73.28 | 60.93 | 45.25 | 100 | 70.6 | 58.18 |
| S1L2Q3 | 17.66 | 100 | 66.89 | 24.39 | 17.66 | 100 | 70.72 | 56.27 |
| S1L3Q1 | 0a | 0a | 0a | 0a | 0a | 0a | 0a | 0a |
| S1L3Q2 | 10.23 | 72.26 | 0 | 56.25 | 10.23 | 72.25 | 0 | 56.02 |
| S1L3Q3 | 47.74 | 100 | 65.19 | 45.05 | 47.74 | 100 | 65.02 | 46.94 |
| S2L1Q1 | 50.96 | 96.91 | 63.32 | 12.34 | 50.94 | 96.88 | 62.66 | 12.12 |
| S2L1Q2 | 47.92 | 100 | 81.42 | 73.84 | 47.92 | 100 | 80.01 | 71.7 |
| S2L1Q3 | 61.33 | 100 | 84 | 76.75 | 41.04 | 89.22 | 45.78 | 64.79 |
| S2L2Q1 | 18.18 | 59.68 | 0 | 100 | 21.11 | 69.29 | 0 | 42.41 |
| S2L2Q2 | 77.72 | 96.87 | 96.64 | 54.69 | 77.26 | 96.29 | 67.37 | 54.77 |
| S2L2Q3 | 55.47 | 100 | 72.1 | 59.99 | 56.47 | 100 | 75.45 | 62.36 |
| S2L3Q1 | 0a | 0a | 0a | 0a | 8.68 | 54.81 | 0 | 0 |
| S2L3Q2 | 12.65 | 72.18 | 0 | 50.68 | 12.65 | 72.18 | 0 | 68.63 |
| S2L3Q3 | 17.73 | 74.68 | 0 | 97.42 | 17.73 | 74.68 | 0 | 97.24 |
| S3L1Q1 | 56.37 | 96.66 | 60.5 | 17.39 | 56.31 | 96.55 | 59.67 | 17.14 |
| S3L1Q2 | 70.77 | 100 | 80.28 | 73.66 | 70.77 | 100 | 78.84 | 69.71 |
| S3L1Q3 | 17.82 | 100 | 67.3 | 20.96 | 17.82 | 100 | 75.1 | 55.59 |
| S3L2Q1 | 13.5 | 69.69 | 0 | 76.6 | 0 | 0 | 0 | 0 |
| S3L2Q2 | 48.28 | 99.27 | 62.36 | 18.07 | 48.63 | 100 | 69.21 | 50.11 |
| S3L2Q3 | 17.6 | 99.97 | 67.36 | 14.21 | 17.61 | 100 | 72.23 | 58.49 |
| S3L3Q1 | 16.23 | 47.19 | 0 | 100 | 16.23 | 47.2 | 0 | 100 |
| S3L3Q2 | 16.66 | 62.19 | 0 | 100 | 16.66 | 62.19 | 0 | 100 |
| S3L3Q3 | 17.6 | 74.68 | 0 | 96.48 | 0 | 0 | 0 | 0 |
| MAX | 77.72 | 100 | 96.64 | 100 | 77.26 | 100 | 80.01 | 100 |
Optimal hydraulic performance parameters simulated with SIRMOD
After running the SIRMOD model, the simulated values of application efficiency, distribution uniformity, requirement efficiency, runoff and deep percolation loss percentages were obtained by feeding the inputs which were collected from field measurement in SIRMOD software. These predicted hydraulic performance indicators of the full Hydrodynamic and Zero Inertia were summarized in Table 8.
Note: Ae =Application efficiency. Re=Requirement efficiency/storage efficiency. DU=Distribution uniformity. Abs. Dis. U=Absolute Distribution Uniformity.
a=the solution has become unstable for these input value of discharge selected. That is the flow rate decreased to reach end of the furrow as furrow length increase.
As a result of optimization by SIRMOD viewed in Table 8 the high application efficiency of 77.72% was recorded at furrow length of 48 m, furrow stream of 4 l/s, furrow slope of 0.075% and at 43 min cutoff time (treatment S2L2Q2). The second maximum application efficiency (70.72%) was observed by treatment S3L1Q2, but the first maximum application efficiency in volume balance and in WinSRFR model. Therefore, the treatment S3L1Q2 were taken as optimum treatment comparing to other treatments over the three models (WinSRFR, SIRMOD and Volume balance). As the result indicated in table 9 the performance using full hydrodynamic and Zero inertia solution models are almost the same. But as the slope increase the relation was far each other which agree with Valipour findings.
| Treatments | Performance indicators | |||||||
|---|---|---|---|---|---|---|---|---|
| Full Hydrodynamic model | Zero Inertia model | |||||||
| Ae (%) | Re (%) | Du (%) | Abs.Dist.u (%) | Ae (%) | Re (%) | Du (%) | Abs.Dist.u (%) | |
| S1L1Q1 | 53.15 | 97.05 | 63.03 | 11.6 | 53.26 | 97.26 | 64.71 | 11.06 |
| S1L1Q2 | 26.66 | 100 | 67.6 | 43.73 | 26.66 | 100 | 66.41 | 43.51 |
| S1L1Q3 | 18.51 | 99.92 | 66.05 | 13.02 | 18.53 | 100 | 74.81 | 59.65 |
| S1L2Q1 | 13.57 | 69.69 | 0 | 75.7 | 13.57 | 69.69 | 0 | 76.84 |
| S1L2Q2 | 45.25 | 100 | 73.28 | 60.93 | 45.25 | 100 | 70.6 | 58.18 |
| S1L2Q3 | 17.66 | 100 | 66.89 | 24.39 | 17.66 | 100 | 70.72 | 56.27 |
| S1L3Q1 | 0a | 0a | 0a | 0a | 0a | 0a | 0a | 0a |
| S1L3Q2 | 10.23 | 72.26 | 0 | 56.25 | 10.23 | 72.25 | 0 | 56.02 |
| S1L3Q3 | 47.74 | 100 | 65.19 | 45.05 | 47.74 | 100 | 65.02 | 46.94 |
| S2L1Q1 | 50.96 | 96.91 | 63.32 | 12.34 | 50.94 | 96.88 | 62.66 | 12.12 |
| S2L1Q2 | 47.92 | 100 | 81.42 | 73.84 | 47.92 | 100 | 80.01 | 71.7 |
| S2L1Q3 | 61.33 | 100 | 84 | 76.75 | 41.04 | 89.22 | 45.78 | 64.79 |
| S2L2Q1 | 18.18 | 59.68 | 0 | 100 | 21.11 | 69.29 | 0 | 42.41 |
| S2L2Q2 | 77.72 | 96.87 | 96.64 | 54.69 | 77.26 | 96.29 | 67.37 | 54.77 |
| S2L2Q3 | 55.47 | 100 | 72.1 | 59.99 | 56.47 | 100 | 75.45 | 62.36 |
| S2L3Q1 | 0a | 0a | 0a | 0a | 8.68 | 54.81 | 0 | 0 |
| S2L3Q2 | 12.65 | 72.18 | 0 | 50.68 | 12.65 | 72.18 | 0 | 68.63 |
| S2L3Q3 | 17.73 | 74.68 | 0 | 97.42 | 17.73 | 74.68 | 0 | 97.24 |
| S3L1Q1 | 56.37 | 96.66 | 60.5 | 17.39 | 56.31 | 96.55 | 59.67 | 17.14 |
| S3L1Q2 | 70.77 | 100 | 80.28 | 73.66 | 70.77 | 100 | 78.84 | 69.71 |
| S3L1Q3 | 17.82 | 100 | 67.3 | 20.96 | 17.82 | 100 | 75.1 | 55.59 |
| S3L2Q1 | 13.5 | 69.69 | 0 | 76.6 | 0 | 0 | 0 | 0 |
| S3L2Q2 | 48.28 | 99.27 | 62.36 | 18.07 | 48.63 | 100 | 69.21 | 50.11 |
| S3L2Q3 | 17.6 | 99.97 | 67.36 | 14.21 | 17.61 | 100 | 72.23 | 58.49 |
| S3L3Q1 | 16.23 | 47.19 | 0 | 100 | 16.23 | 47.2 | 0 | 100 |
| S3L3Q2 | 16.66 | 62.19 | 0 | 100 | 16.66 | 62.19 | 0 | 100 |
| S3L3Q3 | 17.6 | 74.68 | 0 | 96.48 | 0 | 0 | 0 | 0 |
| MAX | 77.72 | 100 | 96.64 | 100 | 77.26 | 100 | 80.01 | 100 |
The application efficiency simulated in the SIRMOD software under zero inertia and hydrodynamic models of furrow irrigation with closed end boundary condition was similar in comparison with WinSRFR software. Distribution uniformity and storage efficiency was also good indicating the same trend as that of application efficiency. The treatment S3L1Q2 screen output by SIRMOD model was viewed in Figure 7.

Figure 7. Window of SIRMOD output.
Calibration of the model
The model was calibrated by using calibration parameters which is manning’s roughness coefficient ’n’ stated by Solomon. The calibrated value of SIRMOD model presented in Table 9.
The most effective way to evaluate these systems is via use of a calibrated hydraulic simulation model. The role of field measurement is to collect enough information in order to calibrate this model so it can be as true as possible to the actual irrigation (Table 10).
| Field number | Ae of Existing practice (%) | Ae of Improved practice (%) | Water saving(%)=Existing Ae-improved Ae |
|---|---|---|---|
| 16 | 43 | 85.3 | 42.3 |
| 108 | 25 | 85.3 | 60.3 |
As the result viewed in table 10, the Average surface roughness of the field is 0.16 and 0.10 at first and later irrigation respectively.
Water Saving
Significant savings can be achieved through improving the application of irrigation water at the field level. The key is to improve the efficiency of irrigation by providing just enough irrigation water to match the available storage in the root zone, thus reducing the amount of water lost to the crop through deep percolation and surface runoff (Table 10).
The result of table 11 revealed that 42.3% and 60.3% of water can be saved by the optimized decision variables. The amount of water saved was differing from field number to field number due to different management level of the irrigators over the field. Thus, the estate can save this much amount of water and can expand the irrigable land by saved water.
According to result obtained the application efficiencies of existing furrow irrigation were in the ranges of 25% to 43% for furrow length 48 m and 32 m respectively that indicate less performance of the system due to excess application of water and less management skills of irrigators during irrigation events. Thus, the existing furrow irrigation has revealed inefficient performance which needs careful design of the furrow geometry and good management practices. The measured data of experimental site was inserted in the SIRMOD software and WinSRFR software package. Furrow length of 32m, 48m, and 64m, slope of 0.05%, 0.075% and 0.1%, and flow rate of 3l/sec, 4l/sec and 5l/ sec were analysed using volume balance method and simulation model
It was observed that first irrigation event treatments had better application efficiencies than that of later irrigation event treatments. Maximum values simulated by WinSRFR model were 86% and 34% first irrigation event and later irrigation event treatments respectively. This is due to decrease of water required depth in later case with the same application of flow rate which increases deep percolation. The optimum decision variables were observed that gave maximum application efficiency which reflects the overall use of water. From the study, interaction factor that gave performance indicators above the recommended was S3L1Q2 which is third level of slope which is 0.1%, first level of length (32m), and second level of flow rate (4 l/sec). The interaction gave maximum values during both irrigation events. The optimum design factor of the system was found that furrow length of 32 m which was already abundantly used at the estate and furrow slope of 0.1% which needs improvement. In addition the management factors were also found from the study. The management factors which on-field operators (irrigators) should care were flow rate of 4 l/sec and cutoff time 15.79 minutes.
This study is a product of countless individuals whose thoughts, ideas, perspectives, and work have given the author. First of all, the author acknowledges the Almighty GOD for his priceless help and his protection. Next, the author acknowledge the diligent contributions of Mekonen Ayana, Gebremeskel Aregay, Belay Yadeta, Damis Tsega, Dejene Tadese, Qabso Adamu and Wonji sugar corporation estate, Wonji sugar corporation research center and all sugar plantation members who providing the necessary input data and kind collaboration during the study.
The authors have not declared any conflict of interest.
The datasets generated during and/or analyzed during the current study are available from the corresponding author on reasonable request.
Irrigation & Drainage Systems Engineering received 835 citations as per Google Scholar report


