Research Article - (2022) Volume 8, Issue 7
Received: 28-Jun-2022, Manuscript No. jssc-22-67865;
Editor assigned: 30-Jun-2022, Pre QC No. P- 67865;
Reviewed: 14-Jul-2022, QC No. Q- 67865;
Revised: 19-Jul-2022, Manuscript No. R- 67865;
Published:
26-Jul-2022
, DOI: 10.37421/2472-0437.2022.08.123
Citation: Noor, Rusandi and Hiroshi Tamura. â??Numerical
Assessment of CFRP Retrofit Effect for Repairing Corroded Steel Girder Ends by
Local Stress and Displacement Distribution.â? J Steel Struct Constr 8 (2022): 123
Copyright: Noor, Rusandi and Hiroshi Tamura. “Numerical Assessment of CFRP Retrofit Effect for Repairing Corroded Steel Girder Ends by Local Stress and Displacement Distribution.” J Steel Struct Constr 8 (2022): 146
Background: Post-retrofit inspection of steel bridges can be particularly challenging due to the lack of visual accessibility by the inspector. This study numerically investigated the repair and reinforcement behavior using CFRP (Carbon Fiber Reinforced Plastic) for corroded steel girder ends, consisting of 3 configurations bracing a simple span steel bridge. Stress transformation studies are conducted so that the steel girder ends stresses due to various types of loading can be predicted. The CFRP retrofit model was validated to evaluate the representation of CFRP in the existing system. The validated corroded girder model showed high-stress values under the design loads. The result has been studied based on a computational model to gain the shape of the stress distribution of CFRP to capture the response in different loading types. The contribution of the 50 mm curve shapes of reinforcement member parts significantly affects the compressive stress distribution shape and out-of-plane displacement of the steel corroded part. Being able to simulate or predict these stresses characteristics based on actual conditions will support the need for field measurement of stresses.
Web-ends thickness reduction • Potential damage region • CFRP compressive stress
The cyclic bending stresses of out-of-plane at the end of the girder always occur during the service life of the bridges. The stress range within tolerable limits is determined by the web thickness and the magnitude of the load to overcome the possibility of out-of-plane deformation at the girder ends. Then, reducing the thickness of girder web ends due to corrosion should be more considered.
The local stress has a potential transformation by healthy-corroded-retrofit conditions because of different strength element behavior combinations. The prediction of local stress redistribution of the corroded part under CFRP retrofit has been a general challenge because of the need to identify the potential damage region in terms of localization of the high stress in the corroded part.
Using finite element simulation, the observation of the physical phenomena of CFRP compressive stress has essential significance. It is necessary to collect the compressive stress distribution on each CFRP sheets to determine the value of in-plane stress transferred from the girder ends section. At this point, the high compressive stress concentration location can play a crucial role in determining the durability of the CFRP retrofit structure. It must be ensured that to measure a local compressive stress value in the CFRP parts should be under structural strength limit.
Asao et al., in their study, observed the thickness reduction of the only web due to local corrosion has a more significant effect on maximum capacity than the other girder end section [1]. The corrosion depth has a linear relationship with the moment inertia of the girder end cross-section. Matsumoto M, et al., defined the weakest section of the corroded area by the average corrosion depth. Their research developed the concept of the triggered value of local corrosion in the steel bridge with a mean value of 0.7 mm, and the variation coefficient is 0.15 [2].
Further, Yosri, et al. found a correlation between the minimum thickness loss location and stress concentration for damage identification. The spreading of high-stress concentration may propagate to thicker sections or adjacent welded joints, affecting severe structure damage [3]. Al-Salih H, et al., recently evaluated the CFRP retrofit for steel girder ends due to out-of-plane deformation. They provided the scallop between the web and the stiffener in detail. All specimen configurations identify the potential damage in the scallop region over the girder height [4].
Ueda M, et al., found that the compressive stress of the unidirectional CFRP is almost the same as its tensile stress. They studied the compressive stress of CFRP in the epoxy matrix based on the prediction of elastic conditions in which fiber misalignment and fiber bending are considered [5]. Baumann et al., discovered that the non-retrofit CFRP layup for compressive stress in the matrix material is more important for the assistance of respectable CFRP performance than tensile loading. The matrix material has to prevent the high stress of the CFRP during the loading condition [6].
This numerical investigation will predict the local stress distribution and displacement characteristics of girder web ends due to the thickness reduction approach. Thus, a predictive method is described as a case when the originally linear-elastic girder ends structure remains linear-elastic in healthy-corroded-

Figure 1. Schematic of out-of-plane in the web scallop at the end of the transverse stiffener plate.
retrofit conditions. To further understand CFRP retrofit effects at the corroded steel girder ends, the potential damage identification of the CFRP must be relatively assessed. The analysis of stress transformation behavior will inform the novel local stress redistribution post-retrofit method and identifies dominant critical retrofit geometry constraints. The contribution of multi-layers of CFRP reinforcement shifts the high compressive stress distribution of steel corroded parts in this simulation can also be attributed to CFRP reinforcement's inplane stress-sharing mechanism at unidirectional layer orientation (90°) in predominantly compressive loading.
The author states that the artificial damage can be simulated by reducing the thickness of the girder web ends. Adjusting the surface thickness area can use to detect localized damage. The regular topography of web ends thickness reduction refers to the volume loss which the deepest corroded surface in the thickness direction. This research process is generally repeated for three types of bracing simple supported steel bridges configuration as a three-dimensional global model. Next, the applicability of steel girder ends sub-model retrofit with CFRP sheets is investigated numerically to clarify the local stress distribution transformation, which was subjected to the interaction of various live loads and the constant dead load conditions. The stress distribution transformation of those external forces is considered independently to demonstrate the recovery process impact with a detailed corroded model.
To identify the potential damage region, the analysis of the contribution of CFRP strengthening to the target part heavily relies on adequate bonding modeling. This research proposed a full-scale CFRP finite element model based on the actual specification to simulate the transfer of stress and displacement from the girder ends corroded region to the CFRP. The reproduction of high local stress at the retrofit girder ends should be considered with a group of vehicles running where they will cause the most adverse stress at the target point. The author designed a numerical simulation that would mimic the corroded edge's stress concentration on the web ends to produce a "jump" stress behavior associated with the stress distribution of corroded depth surfaces under CFRP retrofit conditions.
Because of the structure modeling complexity, analyzing the compressive stress of CFRP layer-by-layer is a common approach for simplification. This study modeling a non-uniform shape in the retrofit CFRP sheet with a curve (R = 50 mm) as the anchoring part. In this modeling, anchoring length and shift are set 100 mm and 25 mm respectively. By anchoring the CFRP on the lower flanges, the direction of the compressive stress can be oriented in the direction of the webs, further enhancing reinforcement. The aligned CFRP sheets are embedded in a matrix (primer-epoxy-putty) modeling while maintaining the local fraction and buckling for the CFRP retrofit part. CFRP modeling should be oriented so that fibers are aligned vertically in the same direction of local distribution stress in the web subjected to reaction force at the supporting point. It generalized the specification of in-plane stress distribution at the CFRP layer interface (Figure 1). The fundamental assumptions are as follows: 1) the material of CFRP remains elastic; 2) the deformation of the CFRP is not considered because the modulus elasticity of CFRP is much higher than steel.
Description of target bridges
This study selected the steel bridge girders with various bracing types (cross beam, cross-frame type V, and cross-frame type X). The selected structure of the steel I girder bridge is a good representative of the simply supported bridge, corresponding to a composite roadway bridge with a span length of 40 m and lane width of 12.5 m, respectively. In a selected bridge where the ratio of girder spacing (S) to girder depth (D) is more than 1.5, either cross-frame type V or cross-frame type X may be implemented. However, keeping the angle of 45° of the cross-frame diagonals help attach the crossframe member to the girders connection plate. Based on that, the number of girders of each structure is considered different, which makes more sense from a geometrical perspective. The steel main girder section, cross beam (CB) section considered are welded wide flange made with SM400 (fy = 235 MPa; fu = 400 MPa) and cross-frame (CF type V & X) are designed with SS400 (fy = 235 MPa; fu = 400 MPa), all the steel section were adopted the 2.10 × 10⁵ MPa Young’s modulus with 0.3 Poisson’s ratio and 7850 kg/m3 material density. The concrete slab model possesses 2400 kg/m3 density, fc = 25 MPa, and E = 2.4 × 10⁵ MPa of the Young Modulus, with 0.2 Poisson’s ratio. The general view and detailed target section (G1) members of the steel I girder bridge are presented in Figure 2.
Implementation of loading condition
This study adopted the service loading conditions designated by Japan Road Association (Specification for Highway Bridges-2012) [7]. The traffic load model of the main girders is that the bridge should be loaded with a sequence of large vehicles moving at the place where they will induce the most adverse stress at the point. To observe the uncertain possibility of the traffic situation to adverse stress at the steel girder end, as shown in Figure 3a, the middle (case 1) and the edge (case 2) position of the p1+ p2 placement is applied. In the transverse bridge structure direction, the reaction's influence line in the main girder (G1) is fully considered the target, as shown in Figure 3b.
Girder ends – Assumed state
The main idea of the global-local modeling approach is to assess specific target parts of the structure on various scales correctly, developing an accurate, realistic result of each part of the bridge structure, including information concerning the potential damage of reinforcement condition. For this reason, a shell-solid modeling is employed. This stage allowed the various load to be gene Rated into the model, as shown in Figure 4. The global model where repeated traffic load (case 1; case 2) and gravity load were applied, and an advanced transformation from healthy condition modeling to the corroded

Figure 2. Selected of simply supported steel I girder bridge overall view, geometry, and dimension (unit in millimeter) as follows: (a) cross beam (CB), (b) cross-frame type V and (c) cross-frame type X.

Figure 3. (a) Various loading methods at the middle and the edge of bridge structure and (b) Influence line reaction in the target girder under various cases.
surface loss and retrofit condition (with CFRP attachment) was assigned. The refinement mesh of the sub-model element was carried out to reach a higher level of accuracy in calculating the sub-model, as shown in Figure 5. Abaqus version 2018 was utilized in this research to simulate the complete assessment process [8]. The uses of standard shell elements (S4R) are not proficient in calculating the thickness difference, nor can they calculate the corresponding behavior when adding the new component on the surface of the shell element. Then, the solid element (C3D8R) tends to be not stiff enough in bending, and the result of stresses and displacement are accurate in reduction of girder ends dimension.
The surface preparation method was conducted in this simulation to obtain optimal performance from CFRP sheets. Khuram et al. assumed that the corrosion height based on those parameters gives a very conservative prediction of the stiffness reduction at the inner web. They found the loaddisplacement buckling mode will appear with the height of corrosion greater than 60 mm at the girder ends regions [9]. The detailed corrosion model consists of a curve (R = 3 mm) at the top of end corrosion that replicated the uncertain shape of corrosion that induced the stress transition from corroded to healthy region. It was decided that the curve shape corrosion was primarily located on the top edge since the result could be higher to reduce the stress concentration, as shown in Figure 6. This study has decided to set the height of distribution to be considered 100 mm.
Retrofit process modeling
Three-dimensional model analysis simulated the corroded web end part with the designed CFRP sheets layer using sub-model boundary conditions, as shown in Figure 7a. The element type used for this simulation is shown in Figure 7b, with meshing detailed in 1 mm. The web end part, polyurea putty, epoxy putty, and adhesive were modeled using a brick element (C3D8R). This study also conducted the standard CFRP retrofit construction order is shown in Figure 7b. The adhesive is applied to prevent corrosion and upgrade the bonding ability between steel and epoxy putty, even though the putty is flexible enough to prevent delamination under high stress (about 1/3000 of that steel). The element connection was modeled as a monolith with different material properties to support a simple connecting element section between adhesive-epoxy-polyurea. The CFRP sheet layer with a curve-shaped (50 mm) was modeled using shell element (S4R). The tie constraint approach was generated to tie separate CFRP sheets surfaces together to prevent the relative motion. Joining the CFRP sheets together using the tie constraint option allows modeling the CFRP sheet retrofit structure to be more realistic. The material properties description of the sub-model of CFRP retrofit is summarized in Table 1. In this study, as a fundamental retrofit process, the CFRP sheets number had to be established so that the surface loss thickness of the web end part could be improved to a healthy thickness. Therefore, the amount of CFRP layers for the main direction (in terms of compression behavior) was designed. The layers sheet bonded were thicker than the thickness reduced by the corrosion damage. It was calculated by the steel web end part equivalent thickness of the CFRP sheet deriving by using Equation 1 [10], as follows:
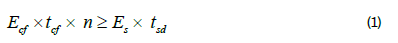
where CFRP sheet thickness (tcf) , the required number of the CFRP sheets (n), Young's modulus of the steel (Es), the thickness of the cross-section corrosion part (tsd), Young's modulus of the CFRP sheet (Ecf). In this case, having a surface loss of 16% of the web endplate thickness with, tsd = 3 mm, the required number of the CFRP sheet layers for the main direction (vertical direction 90°) was 7 layers for the inner-side bonding arrangement, as shown in Figure 7c. Based on the past evaluation test, the shift length between CFRP sheets is 100 mm and 25 mm, respectively. The upper end of the carbon fibers sheet should be bonded by shifting each layer down 25 mm vertically, and the length of the carbon fibers sheet should be determined to satisfy the Equation 2 [10] as follows:

Where Lcf is the length of the outermost layer of carbon fiber sheets (mm). Lsl is the length of sectional loss (mm). The general layup orientation of the CFRP sheets should meet the 90° criteria at all topologies, especially the arch-

Figure 4.The strategy of a global-local modeling approach for steel girder end archbridge.

Figure 5. Idealization of steel bridge modeling in Abaqus simulation (global -local approach).
like shape part. To perform this condition, the CFRP sheet model was modeled by a discrete orientation option in Abaqus to represent changing orientation at the centroid of each mesh element. The variation of layup orientation was contributed to simulating the CFRP's proper behavior at the steel girder end. The orientation of the elements of the CFRP sheets between seven-layer is identical, and it allows for to description of a consequence of continually varying orientation. However, the compressive strength of the curve shape section is probably influenced by the change (twist) of fiber orientation modeling. The modeling of material orientation is demonstrated by the arch-like shape shown in Figure 7d.
CFRP model validation
In this validation, the target bridge as a highway steel I girder bridge (L = 23.42 m; w = 7.6 m) was constructed with complete 3d modeling. The loading characteristic in Abaqus was different, and the static condition of the axial load of the front (68 kN) and the rear truck wheel (156.5 kN) was transformed to a pressure load that was equal to 0.283 MPa and 0.414 MPa (Figures 8 and 9). The loading condition is considered separately at the middle and edge of the bridge to reproduce the maximum and minimum CFRP stress distribution, which was the purpose of this validation phase. The measurement target in modeling was decided following four vertical strain gauges near the column part, as shown in Figure 10a. The part of the bridge, such as the stiffener, bracing, support condition, actual surface loss, and material property, were generated considering Ahn JH, et al. [12] study. The FE model developed in Abaqus as a validation reveals the contribution of vehicle positions at the middle of the bridge that could trigger CFRP behavior at the steel girder end to obtain the vertical stress (S22) in the tension side, as shown in Figure 10b. However, the compressive stress will produce when the vehicle is placed at the edge of the bridge. This validation also provides strong evidence to confirm CFRP's variety of stress resultant due to different live load conditions. The curve shape CFRP modeling part experienced the high-density resultant stress due to vehicle movement on the bridge. The average percentage of validation from the CFRP model reached 88%.
Deformation characteristics
The evolution of deformation of the modeling steel girder end is highly dependent on the applied load during bridge service. However, it was

Figure 6. Assumed condition of girder ends modeling (unit: mm).

Figure 7. The overall design for retrofit sub-model with CFRP (unit in millimeters): (a) general view of retrofit sub-model cross-section; (b) mesh of cross-section in detailed; (c) design arrangement of CFRP sheets layer and (d) layup orientation of CFRP modeling
| Parameter | Unit | CFRP sheet | Polyurea Putty | Epoxy Putty | Adhesive | Steel | |
|---|---|---|---|---|---|---|---|
| Young’s modulus | MPa | Transversal direction | 2533 | 65 | 4021 | 2533 | 210000 |
| Vertical direction | 640000 | ||||||
| Longitudinal direction | 2533 | ||||||
| Poisson's ratio | - | 0.3 | 0.38 | 0.38 | 0.38 | 0.3 | |
| Design thickness | mm | 0.143 | 1 | - | 0.5 | - | |
| Density | g/cm3 | 2.1 | 1.25 | 1.53 | 1.17 | 7.86 | |
deformed elastically, returning to the initial shape. The deformation analysis is predicted based on the evolution of the out-of-plane deformation, followed by full or partial recovery of the damaged part. This finding revealed that the displacement distribution at the girder end was proportional to the steel bridge bracing type. Figure 9 presents the dominant distribution of transversal displacement at the steel girder end in all cases. This result indicates that a higher stiffener can be a very effective way to reduce out-of-plane deformation, as shown in detail in Table 2.
The former parameter of corrosion surface loss was developed as artificial damage for the end of the steel girder section. Consequently, the structure's stiffness decreased dramatically when the surface loss was applied. Essential observations were made regarding the influence of surface loss at the steel girder end. First, surface loss at the bottom weld bead of the web significantly affects the deformed configuration of the steel girder end. The part of the bottom weld that closes to the bottom flange experienced the more significant displacement as expected. However, the upper part of the bottom weld gave a more substantial displacement. This numerical study showed that the proper modeling weld part is sufficient to consider severe corrosion based on the sensitivity to girder end deformation.
sensitivity to girder end deformation.Additionally, the surface loss length increased the distortion at the section part. Second, the residual displacement in the corroded steel girder end part plays an essential role in the magnitude of deformation and a higher stress range during bridge service, as seen in Figure 10. The general result indicates that the retrofitted sub-models are susceptible to corrosion damage at the steel girder end. The size and shape of the curve part play a crucial role, especially in the inner side or corner. In this study, we are using R = 50 mm. This geometric parameter will have a decreased fiber waviness generated by the curvature of the CFRP sheet. The change in part of the CFRP sheet transitions from the straight-up (vertical) to parallel (horizontal) direction can constantly distribute the bending stiffness and displacement. Thus, it could be established that the

Figure 9. Distribution of transversal displacement characteristic of all cases girder ends.
| Condition | Healthy (mm) | Corroded (mm) | Retrofit (mm) | ||||
|---|---|---|---|---|---|---|---|
| Outer | Inner | Outer | Inner | Outer | Inner | ||
CB |
Case 1 + G | - | 0.00144 | 0.0122 | - | - | 0.00275 |
| Case 2 + G | 0.0101 | - | 0.0204 | - | 0.0191 | - | |
CF-V |
Case 1 + G | - | 0.0044 | - | 0.00805 | 0.00192 | - |
| Case 2 + G | - | 0.00162 | - | 0.00458 | 0.00171 | - | |
CF-X |
Case 1 + G | 0.00188 | - | 0.00669 | - | - | 0.00638 |
| Case 2 + G | 0.0079 | - | 0.00934 | - | 0.0015 | - | |
deformation behavior of the retrofit model was related to the shape design of the CFRP sheet retrofit. The visualization of the transversal displacement contour of a steel bridge with cross beam (CB) bracing is shown in Figure 10.
Stress distribution
The steel bridge with cross beam bracing receives a high-stress concentration at weld bead compared to other bridges, which means the configuration is less stiffened. Figure 11 presents a significant distribution of transformation of local vertical stress in traffic case 2 combined with gravity load. As shown in Figure 11, the analysis was performed separately to understand the behavior of each condition. However, the traffic load in each case should be added to the gravity load to represent the permanent load situation, as summarized in. Moreover, the higher local compressive stress generated at the scallop region was reduced along with the height of the girder. The result would be influenced by the eccentricity of the design traffic load associated with the scallop structure itself. This observation was related to the loading configuration that the author applied. It can lead us to the statement that when a configuration of traffic load acts away from the axis of the steel I girder end column, the traffic load will be termed eccentric load. Therefore, it is challenging to arrange the position of the general vehicle during the service life of the bridge. It is proven that all healthy structure modeling succeeds as it does not experience overstress against the allowable stress of design manual specification. In the healthy model, the weld bead at the scallop region part experienced higher stresses than the other section at the web end section. This stress characteristic involved the surface loss simulation analysis. The stress concentration effect could justify this trend. When subjected to the load, the uniform surface loss area would lose the internal elastic modulus that will cause stiffness degradation as dramatically. Next, the high concentration of residual stress was increased at the nearest undamaged part of the region based on the equilibrium state. It is shown that the stress distribution of the upper tip of the corroded part approaches zero stress and then continues to the compression sign at the healthy part of the web end. This phenomenon occurred by shifting geometrical features of the local corrosion model, as shown in Figure 12 for all cases. The local compressive stress distribution of all steel girder ends in HCR (healthy-corroded-retrofit) became typical even though the value of local compressive stress was variated. The residual corroded compressive stress still reform after the retrofit condition and it cannot recover to an initial state of stress. However, the residual stress was under allowable stress design. The steel girder end with cross beam bracing was an example of the detailed compressive stress for complete loading conditions (gravity + traffic).

Figure 10. The contour of transversal (U1) displacement transformation of a steel bridge with as follows: (a) cross beam (CB); (b) cross-frame type V and (c) cross-frame type X. All deformations are shown with U1 unit in mm.
The local stress ratio indicates the stress on the corroded case exceeds the allowable stress. However, allowable stress is the maximum local stress that can be safely applied to a bridge structure. From Table 3, the local stress from gravity load was influenced by 40% for complete compressive stress at the steel girder end in all cases. The donation of permanent load as a dead load was an instance considering elastic stress's contribution due to the allowable stress ratio. For 3 mm surface loss at the steel girder end, the dead load was increased by approximately 50% of initial compressive stress. The retrofit condition reduced stress by 50% from corroded compressive stress. The characteristic of traffic load is slightly different. The local compressive stress from case 1 and case 2 contributed linearly. The transformation of local compressive stress should correspond to service loading as better as possible. Consequently, we obtain a 30% higher compressive stress at the edge than at the middle. Furthermore, the steel girder ends experience a double transformation related to the p1+p2 and p2 movement. That leads to some standardized load conditions parameters. The potential damage will occur when the retrofit stress is larger than healthy stress. The proportion of this condition is relatively small compared to all retrofit regions due to CFRP reinforcement. This result was found in the relationship of vehicle position to post-retrofit stress. In all cases 1 + gravity, the retrofit stress is tight to the initial stress of a healthy condition due to larger bending in the middle of bridge structure. However, in the cross frame type V the retrofit stress is larger than the initial stress, about 11.46 MPa. The bending moment of case 1 contains the implication of shear stress in the girder ends, and then the deviation of retrofit stress is narrow due to healthy stress. Compared to case 2 + gravity, the deviation of healthy stress and retrofit stress is in good agreement, and then the stress of the retrofit part is smaller. This condition may be related to the orientation of CFRP that is more preserved for the vertical axial force at the girder ends regions. This type of stress occurs when the CFRP reinforcement body is under equivalent vertical stress in all directions may be known as isotropic normal. This result also confirmed that the shear buckling did not appear, considering the corrosion area height is less than 10% of the girder height.
The local compressive stress is mainly conducted by the steel girder end

Figure 11. Local vertical stress distribution of girder ends all cases.
| Condition | σc (MPa) | Ratio (σc / σ140) | σc (MPa) | Ratio (σc / σ140) | ||||
|---|---|---|---|---|---|---|---|---|
| GL | LL C 1 | Y | N | GL | LL C 2 | Y | N | |
| Healthy CB | 42.25 | 62.65 | 0.75 | - | 42.25 | 91.58 | 0.95 | - |
| Healthy CF-V | 38.97 | 48.16 | 0.62 | - | 38.97 | 67.32 | 0.76 | - |
| Healthy CF-X | 40.37 | 47.77 | 0.63 | - | 40.37 | 65.31 | 0.75 | - |
| Corroded CB | 62.17 | 99.01 | - | 1.15 | 62.17 | 129.16 | - | 1.36 |
| Corroded CF-V | 67.62 | 89.82 | - | 1.12 | 67.62 | 108.88 | - | 1.26 |
| Corroded CF-X | 67.23 | 87.13 | - | 1.1 | 67.23 | 111.06 | - | 1.27 |
| Retrofit CB | 36.04 | 50.88 | 0.62 | - | 36.04 | 61.11 | 0.69 | - |
| Retrofit CF-V | 37.11 | 44.47 | 0.58 | - | 37.11 | 58.04 | 0.67 | - |
| Retrofit CF-X | 36.86 | 46.83 | 0.59 | - | 36.86 | 57.72 | 0.67 | - |

Figure 12. The contour of local compressive stress (S22) transformation of steel bridge as follows: (a) cross beam (CB); (b) cross-frame type V (CF-V) and (c) cross-frame type X. All units of S22 in MPa
and the CFRP sheets for the composite restore system. At the same time, the infill (epoxy or primer) material is used as a barrier between CFRP sheets and corroded web end to prevent deboning and detachment of CFRP while benefiting from the high modulus of carbon fiber. Therefore, as a transitional layer between the steel girder end and the CFRP sheet, the modulus elasticity of the infill material could influence the load transfer mechanism in the restore system. A linear trend was observed for the maximum local compressive stress at the CFRP sheet. This result indicates that with the accurate modeling of putty interaction, the corroded web end carries the lower stress, while the CFRP sheets take the higher local stress. The primary reason for this trend is that the young's modulus of a putty layer is (1/12) smaller than that of CFRP sheets and (1/4) smaller than the steel girder end. In this simulation, this putty layer could not bear immense stress, so the local compressive stress from the steel girder end could effectively be transferred to the CFRP sheet with high modulus elasticity. This result indicates that the CFRP transferred the local compressive stress perfectly in a vertical direction following the layup orientation of CFRP. The section (bottom part) that obtained the thickened portion of putty will significantly decrease the local compressive stress. However, the upper corroded section loss experienced higher compressive stress in all cases, as shown in Figure 13. This characteristic parameter showed us every single CFRP sheet layer was performing together during the loading condition. The critical part of CFRP sheets attached to the steel girder has been discovered. All condition of the sub-model indicates the higher stress distance of CFRP sheets is 50 mm from the column part of the web end and decreased following the CFRP geometry. This observation conducts the visualization of stress in-plane characteristic to analyze the stress distribution in the CFRP sheet, as shown in Figure 13. By modeling a surface loss web ends thickness which bonded to CFRP sheets under service loading indicated that it was possible to accurately evaluate the strength of CFRP reinforcement.

Figure 13. Visualization of In-plane stress principal of all cases girder ends CFRP reinforcement.
The stress distribution transformation in the healthy-corroded-retrofit (HCR) steel girder end was clarified through the simulation, and the conclusions are drawn as follows:
1. It is discovered that when the web-ends thickness reduction is subjected to the compression-compression conditions due to service (trafficgravity) loading, the assumption of stiffness degradation in compressive load still can hold against the web-ends elastic strength limit. The local compressive stress was increased by around 30% from case 1 to case 2 based on p1+p2 configuration. Therefore, the transformation of local compressive stress case 1 and case 2 at the steel girder ends occurred linearly according to vehicle movement over the bridge. Then, the proposed approach was successfully used to estimate the variance of the corroded model. Thus, the assumed severe corrosion model of steel girder ends can be considered realistic. The proposed method provides a general method for determining a traffic-control for corroded steel girder ends safety prediction. It was also found the maximum local compressive stress is reduced by an effective distance of bracing or with increases in the eccentricity of live load positions. The stress redistribution of retrofit web-ends has been discovered to determine the local stress shape characteristics of the damaged area under CFRP reinforcement.
2. Potential damage regions of the CFRP retrofit were discovered with the theoretical basis of structural geometric changes effect of retrofit girder ends. The stress redistribution on the retrofit part is influenced by the surface topography of different thickness web plates and external threedimensional constraints of reinforcement. This coupling effect makes the potential damage of stress concentration at the edge corroded part higher than that midplane. The curve part (R = 50 mm) plays an important role in shifting the distribution peak of stress. High compressive stresses were mainly initiated at the beginning of the curve part. Based on the stress distribution of the corroded and retrofit cases, it was revealed that the transition zone has a jump of stress phenomena. Because the surface loss modeling on the girder ends will generate the stiffness decline, which could explain why being under the material strength threshold still has a residual impact. However, the out-ofplane deformation of the girder ends was prevented completely.
3. Based on the result of this study, the maximum in-plane stress of CFRP sheets (1st-7th layers) is established almost consistently (108-123 MPa). It was discovered that the maximum compressive stress was placed on the curve part, which is close to the cruciform corner edge of the column girder end. The contribution of the Epoxy-Putty model was significant as a basis of curve shape in the retrofit method.
The financial support provided by the Japanese Government (MONBUKAGAKUSHO: Ministry of Education, Culture, Sport, Science, and Technology-MEXT) Scholarship has made this research possible and it is greatly appreciated.
Google Scholar, Crossref, Indexed at
Google Scholar, Crossref, Indexed at
Google Scholar, Crossref, Indexed at
Journal of Steel Structures & Construction received 583 citations as per Google Scholar report