Research Article - (2021) Volume 10, Issue 9
Received: 26-Aug-2021
Published:
16-Sep-2021
, DOI: 10.37421/2168-9768.2021.10.290
Citation: EtefaTilahun Ashine. "Modeling Surface Water Potential of Somodo Watershed." Irrigat Drainage Sys Eng 10 (2021): 286.
Copyright: © 2021 Etefa Tilahun Ashine. This is an open-access article distributed under the terms of the Creative Commons Attribution License, which permits unrestricted use, distribution, and reproduction in any medium, provided the original author and source are credited.
The availability of freshwater is likely to decrease due to population growth, industrialization, land use and climate change; unfortunately demand for water increases across the world. Quantifying the water resources of a watershed is essential for providing the strategic information needed for long-term planning of water security. Thus this study was initiated with an objective to determine the surface water resources potential of Somodo watershed. GPS, GIS, SWAT, and SWAT-CUP software were the materials used. Secondary data namely DEM, land use/land cover map, soil map, stream flow and meteorological data were collected from responsible organizations. Sensitivity analysis, calibration and validation of the model were done to check performance of the model. The result reveals that Surface runoff and base flow were the most sensitive parameters of the stream flow in Somodo watershed. The statistical results for the model performance displayed satisfactory (R2 of 0.795 and NSE of 0.68) between the simulated and observed flow, respectively for calibration and there was also a very good agreement between the observed and simulated stream flow with R2 value of 0.821 and NSE value of 0.7 for validation. From total watershed area of 19860 ha, a total of 56.75MCM surface runoff was generated by the model from the catchment annually. Construction of water harvesting structures at the upstream of the watershed is useful to increase the water potential and to use the water during the dry period and is recommended from this study.
Model • Somodo • SWAT • Water potential
The availability of freshwater in many regions is likely to decrease due to population growth, industrialization, land use and climate change; unfortunately demand for water increases across the world. Climate change due to the greenhouse effect plays a vital role in the availability of freshwater and is just one of the pressures facing water resources today [1]. On the other hand, rapid population increase, urbanization, and industrialization have had a significant effect on the hydrological cycle. As the population increases, the provision of clean water in the megacities of developing countries becomes increasingly more complex [2]. Quantifying the water resources of a river basin is essential for providing the strategic information needed for long-term planning of water security. Conventional water- resources planning and management have mostly been based on blue water resources, which serve the needs of engineers who are responsible for coping with infrastructure projects for water supply [3]. Blue water is known that the sum of river discharge and deep groundwater recharge. Green water, however, is differentiated according to [4] as green-water resources and green-water flows. According to their definition, green-water resource is the moisture in the soil. This is the renewable part that can potentially generate economic returns and the source of rainfed agriculture. Green-water flow, however, is the actual evaporation (the non-productive part) and the actual transpiration (the productive part), commonly referred together as the actual evapotranspiration [5]. Thus, it is vital to study the blue- and green-water potential for effective water resources planning and management.
Water resources development, integrated water resources management and water resources utilization are the best option and recognized as a tool for sustainable economic growth, poverty reduction and water related conflict management in developing countries [6,7] Most commonly, land and water which are the major assets for the majority of the rural people who depend on agriculture and livestock production for their lively hood requires an effective management. Irrigation development is also necessary for the sustainable and reliable agricultural developments in Ethiopia by meeting the demands of food security, and poverty reduction [8]. These sustainable developments will be ensured by assessment of the potential of available resources and designing best utilization mechanisms on a watershed level.
Somodo watershed which is a tributary of Abay River basin is a high potential area suitable for the cultivation of coffee (Coffea arabica L.). Even though, it is a high potential area for the cultivation of coffee, there were other activities in the watershed that demand water that drain from the watershed mainly, domestic water supply, livestock consumption, irrigation for the cultivation of vegetable crops. Though there were the above mentioned different water demands in the watershed, their quantity was not determined at the current and for the future demands. Locally, the farmers in the watershed use irrigation for coffee and vegetable crop production, but they never realize the exact quantity of irrigation water rather apply water by the physical observation. For a water resources management it is better to begin from the availability quantity of water. Therefore this study was initiated with an objective to assess the surface water resources potential of Somodo watershed.
Description of the study area
Somodo watershed is one of the major coffee producing areas in Manna district of Jimma Zone, which is located at 368 km South-West of Addis Ababa and 15 km West of Jimma town. It is 5 km from the main road from Jimma to Gambella and 20 km from the District center Yebu. The climate is weynadega and very favorablefor crop production and animal and human health. It is geographically located between 7º46′00′′- 7º47′00′′N latitude and 36º47′00′′-36º48′00′′E longitude and the altitude ranges between 1900 - 2050 meter above mean sea level. The minimum and maximum temperature of the watershed is 13ºC and 25ºC, respectively and also the average annual rainfall is 1500 mm. Nitosols and OrthicAcrisols are the dominant soil types with slightly acidic PH, which is suitable for coffee and fruit production.
Materials
The materials used for conducting the study were the GPS, GIS, SWAT, and SWAT-CUP software.GPS was used to collect the geographic information of the study area and to select the outlet of the watershed. The coordinate which was recorded using GPS was also used to delineate the watershed from the DEM, whichwas used as an input data for further use in SWAT model. SWAT was used to simulate the quantity of surface water in the watershed. SWAT-CUP software was used for calibration and validation of the SWAT model.
Data collection and sources of data
The following secondary data were used for conducting the study namely DEM, land use/land cover map, soil map, stream flow and meteorological data (Table 1).
| No. | Data | Source | Scale/period | Purpose |
|---|---|---|---|---|
| 1 | DEM | MoWIE | 30x30 | For SWAT model |
| 2 | Land use/Land cover map | MoWIE | 2014 | Land use/cover classification |
| 3 | Soil map | MoWIE | 2014 | Soil classification |
| 4 | Meteorological | NMSA | 1997-2016 | Weather data |
| 5 | Stream flow | MoWIE | 2011-2016 | For calibration/validation |
Before using the meteorological and stream flow data, the missing value were filled using the excel stat software. Then the long year meteorological data mainly the precipitation, temperature maximum and minimum, wind speed, solar radiation, and relative humidity were prepared in a format ready for SWAT and also the stream flow data was also prepared in a format ready for use for SWAT-CUP software. The SWAT model setup was started for watershed delineation, for delineating the watershed in to several hydrologically connected sub-watersheds. For doing this the projected DEM was properly extracted from the DEM of the Abay River basin by using GIS and loaded to Arc SWAT for further processes. The grid DEM map was processed to remove the non-draining zones. Stream network and sub-basin out lets were defined based on drainage area thresh hold approach. The threshold area defines the minimum drainage area required to form the origin of a stream. The interface lists a minimum, maximum and suggested thresh hold area. In this study, 2500 ha threshold area was used based on minimum and maximum area suggested.
The hydraulic response unit (HRU) from the delineated watershed was created by using the Land use/land cover, soil and slope map followed by HRU definition. The SWAT model was run after adding the metrological data namely rain fall, temperature maximum and minimum, relative humidity, solar radiation and wind speed organized daily in ASCI- format as per the requirement of the SWAT model after that the simulation wasdone.
The soil water content of the delineated watershed was analyzed by using:
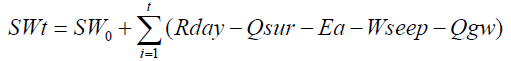
Where: SWt -is the final soil water content (mm)
SWo The initial soil water content
Rday- The amount of precipitation
Qsur-The amount of surface runoff
Ea-The amount of evapotranspiration,
Wseep- The amount of water entering the vadose zone from the soil profile
Qgw- The amount of return flow on day I (mm), and t - is time (days).
The performance of the model for the delineated watershed was evaluated by the model sensitivityanalysis, calibration and validation. The calibrated and validated was performed using stream flow recorded data at stream gauging station. The determination coefficient R2 and NSE were used as an objective function to calibrate and validate the model using the flow sensitive parameters. The model was calibrated and validated using (SUFI- 2) algorithm of SWAT-CUP.
Sensitivity analysis of the model
Surface runoff and base flow were the most sensitive parameters of the stream flow in Somodo watershed. The most sensitive parameters when calibrating the model were curve number (CN2), base flow alpha factor (ALPHA_BF), ground water delay (GW_DELAY), ground water ″revap" coefficient (GW_REVAP), initial depth of water in the shallow aquifer (SHALLST), threshold depth of water in the shallow aquifer required for return flow to occur (GWQMN), irrigation efficiency (IRR_EFF), effective hydraulic conductivity in main channel alluvium (CH_K2), manning's "n" value for the main channel (CH_N2), base flow alpha factor for bank storage (ALPHA_BNK), soil evaporation compensation factor (ESCO), saturated hydraulic conductivity (SOL_K), moist bulk density (SOL_BD) and snowfall temperature (SFTMP). [9] Also estimated the following sensitive parameters for modeling the Abay river basin a case study in Dedessa sub-basin and get the sensitive parameters mainly curve number (CN2), available water capacity (SOL_AWC), saturated hydraulic conductivity (SOL_K), ground water evaporation coefficient (GW_REVAP), threshold water depth in the shallow aquifer for flow (GWQMN), and base flow alpha factor (ALPHA_BF). [10] Also obtained similar sensitive parameters for determining the surface water resources potential of Istanbul namely; r_CN2.mgt, r_OL_AWC (…). sol, r_ESCO.hru, r_GW_REVAP.gw, r_GWQMN.gw, r_REVAPMN.gw, r_ ALPHA_BF.gw, r_SOL_K (…).sol and r_SOL_BD (…).sol. The sensitivity given were estimates of the average changes in the objective function resulting from changes in each parameter, while other parameters are changing. This gives relative sensitivities based on linear approximations and hence only provides partial information about the sensitivity of the objective function to model parameters.
Calibration and validation
The statistical results for the model performance displayed satisfactory (R2 of 0.795 and NSE of 0.68) between the simulated and observed flow, respectively for calibration. However, the simulated stream flow was higher than the corresponding observed values during periods with highrainfall. During validation period, the observed and simulated monthly stream flow closely matches for most part, except during some high-flow events that under-estimated by the model. The statistical analysis results also showed very good agreement between the observed and simulated stream flow with R2 value of 0.821 and NSE value of 0.7 for validation. Although the statistical evaluation showed satisfactory result for both calibration and validation periods, SWAT tended to overestimate the stream flow during high-flow periods and underestimated during low-flow periods. This could be partly because the present curve number technique was unable to generate accurate stream flow prediction for a day that experience several storms. When several storms occur during a single day, the soil moisture level and the corresponding stream flow curve number vary from storm to storm. However, SCS-CN methods define a rainfall event as the sum of all rainfall that occurs during one day, and this might lead to underestimation of runoff. The above result both for the calibration and validation showed a good performance with a value of R2 and NSE of 0.795, 0.68 for calibration and 0.821, 0.7 for validation, respectively. Therefore SWAT model was applicable in Somodo watershed and for this study simulated values were reasonably accepted.
Water balance and surface water potential
Important model performance indicators of the water balance for correct representation of flow are evapotranspiration (ET) and Soil Water Content (SWC) through infiltration (lateral, groundwater flow) and surface run-off. As evapotranspiration is a function of crop (tree) growth, only a proper simulation of crop growth and management can ensure realistic modelling of evapotranspiration within a river catchment. Evapotranspiration is a primary mechanism by which water is removed from the catchment. It depends on air temperature and soil water content. The higher the temperature, the higher is potential evapotranspiration (PET) and consequently Evapotranspiration, if there is enough water in thesoil.After running (simulating) the SWAT model, calibrating the result with the gauged stream flow data of Somodo from 2011-2014, validating from 2015-2016 and checking the R2, NSE and p-test the following result was obtained. Surface water runoff depth of the watershed was 285.78 mm, rainfall 1556.3 mm and lateral soil flow of 47.65 mm annually (Table 2). From total watershed area of 19860 ha, a total of 56.75MCM surface runoffwasgenerated by the model from the catchment annually. The watershed has maximum runoff volume of 11.23 MCM and a minimum runoff of 0.502 MCM in August and December, respectively.The contribution of the water balance during ′Kiremit′ season (June, July, August and September) is high with a total surface runoff of 203.85mm depth, rainfall of 907.14mm, and lateral soil flow of 29.82mm. From this result 58.28% of the rain fall contribution is during ′Kiremit′ season. The water balance is low during ′Bega′ season (October, November, December, and January) with a total surface runoff depth of 44.58mm, rainfall of 258.5mm, and lateral soil flow of 10.81mm. The water balance during the ′Belg′ season (February, March, April and May) the contribution is relatively higher than ′Bega′ season with a total surface runoff of depth 37.33mm, rainfall of 390.5mm, and lateral soil flow of 7.01mm (Table 3).
| No. | Month | Rainfall | Surface discharge | LAT discharge | Water yield | ET | PET |
|---|---|---|---|---|---|---|---|
| mm | (mm) | mm | mm | mm | mm | ||
| 1 | January | 31.87 | 3.1 | 0.68 | 14.6 | 30.85 | 114.83 |
| 2 | February | 39.34 | 2.9 | 0.63 | 5.96 | 38.84 | 118.3 |
| 3 | March | 93.33 | 8.26 | 1.43 | 11.47 | 101.83 | 128.02 |
| 4 | April | 115.43 | 11.48 | 2.02 | 16.12 | 96.71 | 122.69 |
| 5 | May | 142.2 | 14.69 | 2.93 | 21.4 | 81.07 | 122.16 |
| 6 | June | 225.0.1 | 49.89 | 5.85 | 70.42 | 68.19 | 108.48 |
| 7 | July | 235.34 | 52.26 | 7.93 | 106.56 | 65.37 | 92.36 |
| 8 | August | 236.36 | 56.46 | 8.24 | 139.97 | 66.31 | 93.3 |
| 9 | September | 210.33 | 45.24 | 7.8 | 140.84 | 73.68 | 107.23 |
| 10 | October | 151.21 | 30.72 | 6.24 | 124.7 | 68.78 | 117.15 |
| 11 | November | 47.63 | 8.23 | 2.72 | 74.67 | 39.14 | 109.21 |
| 12 | December | 27.64 | 2.53 | 1.17 | 38.16 | 33.42 | 110.15 |
| No. | Water balance | Depth (mm) |
|---|---|---|
| 1 | Precipitation | 1556.3 |
| 2 | Surface runoff (Q) | 285.78 |
| 3 | Lateral soil (Q) | 47.65 |
| 4 | Total water yield | 764.87 |
| 5 | Evapotranspiration | 764.5 |
| 6 | Potential evapotranspiration | 1344.8 |
| 7 | Return flow | 408.94 |
| 8 | Recharge to deep aquifer | 22.94 |
| 9 | Percolation to shallow aquifer | 458.77 |
| 10 | Re-evaporation from shallow aquifer | 26.9 |
Conclusion
Estimating runoff potential of a watershed was important for water resources planning. The runoff was estimated by simulating distributed SWAT hydrological model that requires soil, land use/land cover, topographic slope and metrological data as basic inputs. After correcting and simulating the SWAT model using meteorological data for a period of 20 years from 1997- 2016, DEM of Abay river basin, soil and land use/land cover map of the study area, checking of the sensitivity analysis, calibration and validation of the model using stream flow the surface water potential of the watershed was 56.75MCMannually from a total area of 19860 ha.
Even though in deep study of the surface water potential of the watershed was studied the following works need a further investigation.
• The study assessed surface water resources only, so groundwater availability of the watershed should be studied and supply enhancement and demand management options can be considered to balance future water resources and demands.
• Construction of soil and water conservation structures, wise management of the grazing land and construction of water harvesting structures at the upstream of the watershed is recommended to increase the water potential and to use the water during the dry period respectively.
Irrigation & Drainage Systems Engineering received 835 citations as per Google Scholar report


