Research Article - (2021) Volume 10, Issue 7
Received: 08-Jul-2021
Published:
29-Jul-2021
, DOI: 10.37421/2162-6359.2021.10.599
Citation: Fry,Timothy and Yu Tian. "Information Precision
and Seller Bidding Strategies in Procurement Auctions.” Int J Econ Manag
Sci 10(2021): 599.
Copyright: © 2021 Fry T, et al. This is an open-access article distributed under the terms of the Creative Commons Attribution License, which permits
unrestricted use, distribution, and reproduction in any medium, provided the
original author and source are credited.
First-Price-Sealed-Bid (FPSB) are widely used in both the public and private sectors. In a FPSB procurement common value auction, a seller must first estimate their cost to provide the product requested by the buyer and then determine a bid amount by adding a markup to the cost estimate. This markup must consider desired profits as well as informational uncertainties regarding the cost estimates since actual costs of production are known only after the product is produced. In this paper, we investigate the impact of better cost estimates on firm profitability and bidding strategy in a two- and three-bidder auction. Based on field data from over 1000 procurement auctions, we assume that errors in cost estimation follow a normal distribution. This assumption greatly complicates the analysis such that finding an analytical solution is unlikely. Therefore, using a numerical solution approach, we find the equilibrium solution for each type of seller under a variety of parameter settings. We find that advantaged sellers will be more profitable yet submit more aggressive bids. These results depend on the number of advantaged and disadvantaged sellers competing. Indeed, if there is more than a single advantaged seller competing, they will submit very aggressive bids resulting in profits that may actually decrease as each gets better at estimating costs. Our results provide a clear understanding as to the importance of accurate product cost estimates and extends the research on the effects of cost estimation accuracy in procurement auctions.
Procurement auction • Information uncertainties • Asymmetric auctions
A procurement auction is attractive to procurement managers and agents in that it is inexpensive to implement and thought to leverage competition thus allowing for lower purchasing costs to the buyer. Increasingly, the volume of goods sold via procurement auctions has been steadily increasing. In the US, the Federal Acquisition Regulations (FAR) strongly encourages the use of auctions in public sector procurements to be done via some type of auction. FAR’s suggestion is based on the perception that auctions increase competition, provide equal opportunity for a variety of sellers, and reduces the likelihood of corruption and seller collusion [1]. In a recent report, the US Governmental Accountability Office (GAO) found that the number of procurement auctions increased from 7,193 in 2008 to 19,688 in 2012 for just four departments in the US federal government and suggested that the use of procurement auctions resulted in a savings to the US government of over $98 million [2]. That procurement auctions account for nearly 7% of total US government spending worth $31.2 billion annually [3]. The amount of spending via procurement auctions by the US State Department alone increased from just over $100 million in 2007 to over $231 million in 2010 [4]. In addition to governmental spending, the use of procurement auctions in the private sector is expanding. The Center of Advanced Purchasing Studies found that nearly 40 percent of all in North America companies use procurement auctions for purchasing while nearly all of the US Fortune 500 and the International Fortune 1000 companies regularly use procurement auctions [4, 5]. In 2004, it was estimated that the global volume of purchases sold via procurement auctions was in the level of hundreds of billions of Euros [6]. From a seller’s perspective, procurement auctions offers numerous benefits such as the ability to reach new customers, having a market to sell underutilized capacity, and acquiring information about competitors’ cost structures [7]. Given the attractiveness to sellers and buyers alike coupled with the widespread use of procurement auctions in both the public and private sectors and the volume of economic exchange resulting from their use, it is imperative that researchers understand the intricacies of how procurement auctions function.
In many of the procurement scenarios above, the buying agent generally employs a First-Price-Sealed-Bid (FPSB) auction where all bids are opened at the same time and the seller with the lowest submitted bid is declared the winner in a winner take all format. While recent studies have shown that other factors, such as firm reputation, are sometimes considered, it is still common for the seller with the lowest price to be selected [8-11]. As discussed, many companies, as part of their supply chain management strategy, routinely compete in procurement auctions for the right to sell a product or service to some buyer. In response to a public letting, if the buyer is a public agency, or a request for proposal (RFP), if the buyer is a private agency, the seller submits a bid stating what they are willing to charge to deliver the product or service. If any seller submits a high bid to insure they cover their costs, they reduce the probability that they will in fact win the contract. If the seller submits a lower bid, they will increase the probability of winning the contract at the expense of less than expected profits or even losses if the bid is below the cost of providing the product. During the bid preparation stage, a seller must estimate what its cost will be to deliver the product or service. A bid amount is calculated by adding a markup to this cost estimate which is then submitted to the buyer. Seller markup must account for desired profits as well as any information uncertainty regarding their cost estimate. Consider that the actual and true cost can only be determined after the completion of the product or service thus sellers must rely solely on an estimate of this true cost to prepare their bids. The economic consequences of poor cost estimation means that bid amounts must be high to account for estimation errors which results in bids that are often not competitive. Unfortunately, due to the wide variety of such factors as availability of resources, current and future capacity loads, future material and labor prices, etc., the process of cost estimation is computationally complex. Indeed, there is much research that studies various approaches to developing better cost estimates. Various qualitive methods such as nominal group methods, the Delphi technique, brainstorming and SWOT methods have been studied as well as various quantitative methods such as three-point estimating and various statistical techniques [12]. As the literature points out, there are numerous benefits associated with cost estimates that are less uncertain relative to competitors. A company that utilizes a better cost estimation system than its competitors will be able to bid more aggressively, closer to its true costs, than will its competitors [13]. Further, a company that has built a reputation in the market as a savvy estimator will cause its competitors to bid cautiously when competing against it. Such a reputation allows the savvy estimator to either increase their profit margins or decrease their markups to win more jobs. Although cost estimates are private to each potential seller, they each have access to the same information about the product, via the public letting or RFP, when these estimates are made. If we assume that cost structures are relatively similar between sellers, any differences in cost estimates between sellers suggests that the cost estimation systems used by each seller must have been different.
A key consideration in the study of any auction contest is the role played by information. Specifically, a seller must process private information known only to themselves (private information), information known to all sellers (public information), and information not known by any seller (information uncertainty). While the role of public and private information has been extensively studied in the literature, the impact of information uncertainty on sellers in such auctions has received less attention. Reducing the information uncertainty is critical but challenging for a seller in a FBSP auction because the seller needs to submit a competitive (i.e., low) bid to win the auction but at the same time the bid needs to be high enough to protect the seller’s profit margin when the actual and true cost is determined after the completion of the product or service. One example of information uncertainty, which is the focus of this paper, lies in the ability of a seller that routinely competes in a procurement auction to estimate its production costs required to provide the product or service to the buyer.
The literature has shown that the ability to estimate costs often differs between companies. In an empirical study of construction highway projects, found that less experienced bidders demonstrated a greater dispersion in their cost estimates than did incumbent bidders [10]. Analyze 7,500 construction procurement auctions from the state of Utah and find that the bids submitted by experienced sellers were more consistent. This allowed the experienced sellers to bid with higher markups thus realizing greater profits [11]. Companies with a smaller variance of bids submitted, i.e. consistent cost estimates, will on average submit lower bid amounts thus will win a higher percentage of jobs [14]. In a traditional English style auction, found that when the variance in initial value estimate is small, bidders tend to bid more aggressively [15].
While numerous methods and approaches to developing better cost, estimates have been studied, the focus of this paper is concerned with the impact of having better cost estimates on the performance of a seller that routinely competes in a procurement auction where the item being sold has a Common Value (CV) for all sellers [12]. Procurement CV auctions that have been studied in the literature include: auctions of fine art where the bidder has the intent to re-sale; federal offshore oil and gas drainage leases; US Forest Service timber auctions; as well as highway construction projects; [10,16-20]. In the CV model, the cost to complete the project or produce the item is the same for all sellers such that no seller has a cost advantage over another (as would be the case in a Private Value (PV) auction). Rather than knowing with certainty the common true cost, each seller utilizes their private cost estimation process to formulate a guess as to what this unknown common cost might be. Based on this estimate, each seller prepares a bid amount that is submitted to the buyer where, using a FPSB format, the lowest bid is generally declared the winner. Formally, let C be the unknown true cost for each seller. Each seller formulates a unique estimate, ci, i=1…n, of C that is drawn from a sometimes commonly known distribution H (ci/C). If one seller utilizes a process that results in more accurate cost estimates than other sellers, H (ci/C) is different between sellers. Since seller cost estimates are drawn from different distributions, the sellers are different and the auction is said to be asymmetric. Compared to a symmetric auction, where sellers are alike in every way, asymmetric auctions are much more complex thus little is known about them [21]. Recent literature has explored the intricacies of information asymmetries with respect to the distribution of seller values, information feedback, and information of competitors [22-28]. This paper adds to this literature by exploring asymmetries commonly found in CV auctions where the cost to each seller is identical but the information about that value is different between all sellers.
Literature review
Asymmetry of information is a crucial element of any auction problem and theoretical research on asymmetric CV auctions has generally been restricted to the two-seller case. Even then, the theoretical research literature has only been able to develop an equilibrium by assuming very specific and simplifying information structures and/or by limiting seller bidding strategies. Previous studies develop a mixed equilibrium for a CV auction where sellers’ information regarding their value estimate is limited to a discrete signal, one that can take on only a few values [29-34]. Equilibrium by restricting the bidding strategy of each seller, sellers are limited to adding a constant to their value estimate [35]. Wei bull distribution to represent sellers’ uncertainty of their cost estimates, present equilibrium for a multiplicative bidding strategy where sellers’ bids are limited to their cost estimate multiplied by a fixed scalar [36]. In the case of a procurement auction where a seller must estimate their cost of production, limiting the estimate to a discrete set of values or restricting the bidding strategy of a bidder may be too restrictive limiting the generalizability of their results. Given that the theoretical analysis of auctions with asymmetric information structures is difficult, generally requiring simplifying or restricting assumptions, comparatively little is known about them relative to the more common symmetric information auctions [29-37].
Researchers have recently begun exploring the intricacies of information asymmetries in common value auctions with respect to possession of private information, precision of information signal, information revelation, and competitive information examine the impact of one bidder having better information in FPSB common value auctions. Utilizing a bounded rationality approximation, they find that when one bidder knows with certainty the value of the object being auctioned while other bidders rely on a signal from a range of possibilities, the disadvantaged bidders resort to more aggressive bidding than the advantaged bidders and the advantaged bidder earns greater profits than the disadvantaged bidders [10,16-40]. Similarly, look at the FPSB common value setting and experimentally test insiders with a range of possible values versus outsiders with a much larger range and find the insiders perform better [26]. In both cases, unsurprisingly, the bidders with more precise value estimates realize greater profit than their less-informed competitors. Using an experimental approach, study a series of two seller auctions where one seller possesses better information than another [28]. One form of better information studied is where one seller is provided a more precise estimate of the common value than the other seller. The authors find that the seller with better estimates of cost make more profit and are more likely to avoid the winner’ curse. Focusing on a more realistic scenario, normally distributed cost estimates and asymmetric information, our paper adds to this literature by further exploring the impact of a particular information asymmetry that sellers likely experience in practice. Our paper assumes that sellers are asymmetric such that one seller is considered to be a savvy estimator whose cost estimates are more closely centered about the true cost than its competitors. Unlike most of the previous literature, we consider several levels of information precision, thus representing different degrees of asymmetry, to better understand its’ impact on seller bidding strategies.
Several empirical studies have shown that cost estimation errors tend to follow a bell-shaped distribution [10-14, 28]. While the majority of the theoretical research assumes a Uniform distribution, allowing for many of the theoretical results that have been reported, such a distribution lacks realism. Suggest that many of the simplifying made in the auction literature, such as uniformly distributed cost estimates, have resulted in conditions that deviate from reality [19]. It is their contention that this may explain some of the inconsistencies between practice and research thus research that make more realistic assumptions is warranted. In addition to the empirical studies above, we analyzed the cost estimation errors experienced by a large North American manufacturer. Representing over 1000 on-line procurement auctions, the data includes the manufacturer’s initial cost estimate used to prepare the bid as well as the actual cost to deliver the product. Below figure presents a graph of the difference between the cost estimate and the actual cost expressed as a percent. It is apparent that estimation errors from these auctions clearly follow a bell-shaped distribution. This evidence suggests that cost estimates relied on by many firms were likely drawn from a normal-like distribution with the mean centered on the true cost rather than the normal theoretical assumption of uniformly distributed cost estimates. In other words, the cost estimate of a seller, ci, follows the normal distribution, N (C, σi) where C represents the true but unknown cost and σi represents the standard deviation of seller i’s cost estimation distribution. To reflect cost estimate advantages, we assume that seller i has a better cost estimation process than seller j, (i.e., σi ≤ σi) thus the distributions used to draw each the cost estimate for each seller is different making the auction asymmetric. We model the level of information advantage by systematically decreasing σi about C. The assumption of normally distributed cost estimates, while more realistic, greatly complicates the derivation of any analytical model, if one even exists. For the model presented below, we use a grid search process as suggested and numerical integration used to determine the equilibrium solution for a two-seller and a three-seller FPSB procurement auction [41-43]. The equilibrium solution presented here represents a bidding strategy where any seller unilaterally deviating from this strategy would result in an inferior solution. As such, it represents a best response strategy by either seller given the strategy of the other seller(s) (Figure 1).

Figure 1. Cost estimating errors.
The model presented here considers a CV auction for a single nondivisible object between two or three risk neutral sellers who each submit a bid to a single buyer. The lowest of seller bids is selected as the winner. Each seller’s cost estimate is private information and is randomly drawn from a normal distribution unique to each seller. We initially assume that all sellers are symmetric with a common cost estimation distribution. We then introduce asymmetries by assuming one seller becomes advantaged by decreasing the standard deviation of their cost estimate distribution.
Assume the following notation:
C the common cost,
ci bidder i’s estimated cost=> ci is taken from a normal distribution with a mean of C and a standard deviation of σi
mi one plus the markup for bidder i (e.g., a 15% markup implies mi=1.15),
t bid amount=> t=mi ci,
fi(t) the probability density of bidder i’s bid amount=> mi normal (C),
Fi(t) the cumulative distribution of bidder i’s bid amount,
πi expected profit for each bid submitted by bidder i,
Note, when necessary, we replace the subscript i in the above notation with a to represent an advantaged seller and d to represent a disadvantaged seller.
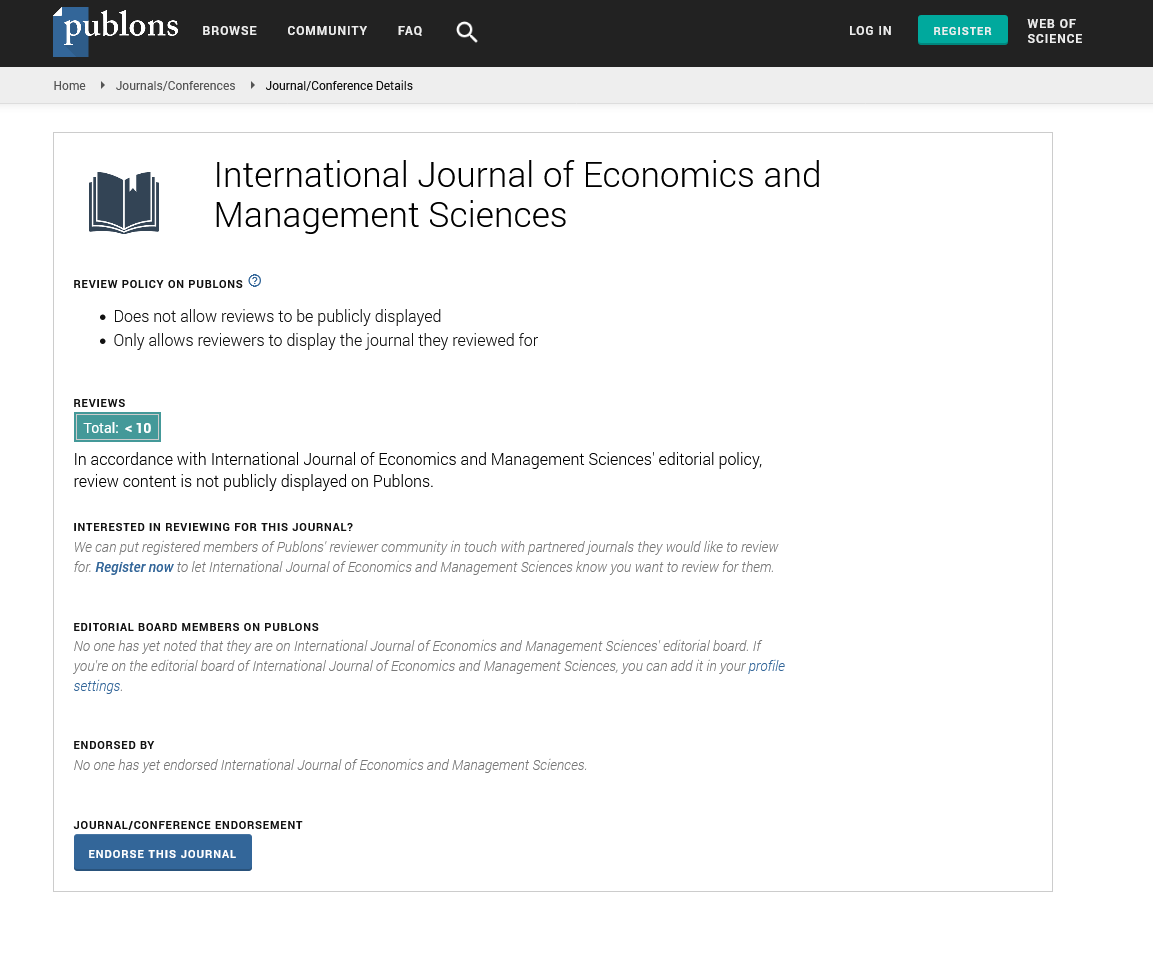
Our approach to find equilibrium is to first determine the expected profit equation for each seller as a function of that seller’s cost estimation probability density functions and markup. It follows that the expected profit for each bid submitted by seller i is:
 (1)
(1)
where K is the set of all competitors of seller i.
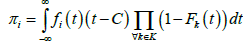
To calculate πi, we define several probabilities: the probability of winning a bid and realizing negative profit, ( Pi−) and the probability of winning a bid and realizing non-negative profit ( Pi+).
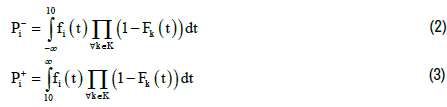
Note that ( Pi−) and (Pi+) are joint probabilities. It follows therefore that the probability of seller i winning a bid is:
For each seller i, we report the expected profit, πi, of each bid, the optimal bidding strategy, mi, the probability of winning a bid and realizing negative profits (the winner’s curse), Pi−, and the probability of winning any bid, Pi. In addition, we report the expected procurement cost to the buyer. Since it is unlikely that a closed form solution for the above model exists, we use to numerically solve the above integrals, Expressions (1), (2), (3), and (4) [41].
The major objective of this study is to analyze the relationship energy consumption with foreign direct investment and economic growth in Pakistan. To resolve the issue of non-stationarity of time series data and order of integration amongst variables, we applied "DF and ADF unit root tests" both the level and at first difference as a unit root test. We consider three different procurement auctions. For ease of presentation purposes only, we assume a common cost of ten monetary units, C=10 for all auctions. Our assumption of a common cost of ten for each auction does not alter the fact that each seller does not know what this common cost is and must still rely on an estimate in preparing their bid amounts. Each seller draws an estimate of the unknown C, ci, that is normally distributed, N (10, σi). Initially we assume σi=1.5 for each seller. We systematically decrease σi in increments of 0.25 to reflect different levels of an information advantage enjoyed by an advantaged seller relative to a disadvantaged seller. In this manner, we can illustrate more clearly the impact of different levels of estimating precision on seller bidding strategies. In Case 1, we consider a two-seller auction where one seller is advantaged, in Case 2 we consider a three-seller auction where one seller is advantaged, and in Case 3 we consider a three-seller auction where two sellers are advantaged. Since the results vary between these three auctions, we discuss the results on a case-by-case basis. We conclude our discussion of results by focusing on the expected procurement cost for the buyer
Case 1: Two-seller auction
The results in a two-seller auction with one advantaged seller As the advantaged seller becomes more advantaged to the point where he has perfect information regarding product cost, (σa decreases from 1.5 to 0.0 in increments of 0.25), her optimal bidding strategy is to bid more aggressively as evidenced by decreases in ma from 30.2 to 20.8. In other words, as the level of uncertainty for the advantaged seller decreases while the uncertainty for the disadvantaged remains unchanged, the advantaged seller submits increasingly more aggressive bids relative to the disadvantaged seller. The aggressive bidding by the advantaged seller is consistent with the predictions made [30,35]. In addition, as the difference in cost estimate uncertainty increases, the disadvantaged seller also adopts an aggressive bidding strategy though at a lower rate than the advantaged seller, md decreases from 30.2 to 19.4. For ease of illustration, below figures shows how bidding strategies and expected profits change as the level of uncertainty decreases for the advantaged seller relative to the disadvantaged seller. In conjunction with this increase in advantage, expected profit for the advantaged seller, πa, increases slightly from 0.959 to 0.985. While the decreases in σa represent a major improvement in estimating ability by the advantaged seller, thereby reducing their level of uncertainty, her gains in profit are somewhat marginal. On the other hand, as the disadvantaged seller becomes more disadvantaged, the reductions in profit are much more severe, πd decreases from 0.959 to 0.327. While previous research has shown that the advantaged seller will experience greater profits than the disadvantaged seller, what is novel here is that the difference in expected profits is due more to the decrease in profits by the disadvantaged seller than any increase in profits by the advantaged seller. This is clearly shown in below figure where the markups for the two sellers are very similar yet the resulting expected profits are dramatically different (Table 1 and Figure 2).

Figure 2. Seller bidding strategies and expected profits (Case 1-Two sellers).
σaσd = 1.5 |
Markups (%) | Expected profit per bid | Probability of winning bid | Probability of winner’s curse |
Mean cost estimate of winning bid |
|||||
|---|---|---|---|---|---|---|---|---|---|---|
| Adv. bidder | Adv. bidder | Disadv. bidder | Adv. bidder | Disadv. bidder | Adv. bidder | Disadv. bidder |
Adv. bidder |
Disadv. bidder | Adv. bidder | Disadv. bidder |
| 1.5 | 30.2 | 30.2 | 0.959 | 0.959 | 0.5 | 0.059 | 0.059 | 0.059 | 9.154 | 9.154 |
| 1.25 | 27.8 | 27.4 | 0.964 | 0.803 | 0.493 | 0.075 | 0.039 | 0.075 | 9.355 | 9.092 |
| 1 | 25.6 | 24.8 | 0.965 | 0.656 | 0.484 | 0.092 | 0.018 | 0.092 | 9.546 | 9.033 |
| 0.75 | 23.8 | 22.6 | 0.968 | 0.529 | 0.479 | 0.523 | 0.005 | 0.109 | 9.717 | 8.982 |
| 0.5 | 22.4 | 21 | 0.977 | 0.427 | 0.471 | 0.529 | 0 | 0.124 | 9.865 | 8.932 |
| 0.25 | 21.4 | 20.4 | 0.985 | 0.355 | 0.469 | 0.531 | 0 | 0.133 | 9.96 | 8.862 |
| 0 | 20.8 | 19.4 | 0.985 | 0.327 | 0.469 | 0.531 | 0 | 0.139 | 10 | 8.859 |
As the level of cost uncertainty between sellers increases, the probability of the advantaged seller winning a bid decreases from 50% to 46.9% while the probability for the disadvantaged seller winning a bid increase from 50% to 53.1%. So, as the accuracy of cost estimates by the advantaged seller improves, πa will increase despite winning fewer bids while πd will decrease despite winning more bids. Lastly, the probability of the advantaged seller incurring the winner’s curse decreases as her uncertainty over costs decreases, 5.9% to zero, while the probability of the winner’s curse for the disadvantaged seller increases from 5.9% to 13.9%. The explanation for these results is relatively straightforward. As the advantaged seller’s cost estimates improve, thereby reducing their uncertainty, her mean cost estimate for a winning bid increases from 9.154 to the true common cost of 10.0. For the disadvantaged seller, the mean cost estimate of a winning bid decreases from 9.154 to 8.859. It is clear that the disadvantaged seller will win more bids but will make less profit on these bids given their aggressive bidding.
The results presented here suggest that when a seller improves her ability to estimate product costs relative to a single competitor, she will realize a marginal increase in profits, adopt a more aggressive bidding strategy, and incur the winner’s curse less often. While these results are consistent with previous research, these results illustrate the systematic change in profits and bidding strategies across several levels of cost uncertainties for advantaged and disadvantaged sellers. Further, these results show that in a two-seller auction with one advantaged seller, the profit of the advantaged seller is relatively unchanged as cost uncertainty is decreased compared to the profit of the disadvantaged seller which decreases dramatically.
Case 2: Three-seller auction with one advantaged seller
The results for a three-seller auction with one advantaged seller while of Figure 1 graphically illustrates these results. As the cost uncertainty decreases for the advantaged seller relative to the cost uncertainty for the two disadvantaged sellers, her optimal strategy is to adopt a much more aggressive bidding strategy than the two disadvantaged sellers, ma decreases from 25.4% to 16.6% while md for the two disadvantaged sellers decreases from 25.4% to 24.2%. While both types of sellers do adopt a more aggressive bidding strategy, when there are multiple disadvantaged sellers competing against a single advantaged seller, as the degree of uncertainty in cost estimates decreases for the advantaged seller relative to the disadvantaged sellers, the advantaged seller will submit increasingly more aggressive bids while the bidding strategies of to the disadvantaged sellers change only slightly. Despite the almost unilateral increase in aggressive bidding by the advantaged seller, πa increases from 0.316 to 0.719, while πd, decreases from 0.316 to 0.087. This is due in part to the fact that the mean cost estimate by the advantaged seller for a winning bid increases from 8.73 to 10.0, while for the two disadvantaged sellers, it decreases from 8.730 to 8.30. Despite the aggressive bidding by the advantaged seller, the advantaged seller’s probability of winning a bid actually increases from 33.3% to 43.3% while for the two disadvantaged sellers the probability decreases from 66.6% to 56.7%. So, while the impact on the advantaged seller is marginal in a two-seller auction, in a threeseller auction with two disadvantaged sellers, the impact on the advantaged seller is more substantial and positive and come at the expense of the two disadvantaged sellers who share the losses. Shown in below figures, as the relative level of cost uncertainty between the two types of sellers increases, the seller with less uncertainty will increasingly bid more aggressively, will realize substantially greater profits, will win more rather than fewer bids, and will incur the winner’s curse less often (Table 2 and Figure 3).

Figure 3. Seller bidding strategies and expected profits (Case 2-Three sellers w/ One advantaged).
| σaσd = 1.5 | Markups (%) | Expected profit | Probability of winning bid | Probability of winner’s curse | Mean cost estimate of winning bBid |
|||||
|---|---|---|---|---|---|---|---|---|---|---|
| per bid | ||||||||||
| Adv. bidder | Adv. bidder | Disadv. bidder | Adv. bidder | Disadv. bidder | Adv. bidder | Disadv. bidder | Adv. bidder | Disadv. bidder | Adv. bidder | Disadv. bidder |
| 1.5 | 25.4 | 25.4 | 0.316 | 0.316 | 0.333 | 0.667 | 0.08 | 0.16 | 8.73 | 8.73 |
| 1.25 | 22.2 | 24.8 | 0.393 | 0.25 | 0.358 | 0.64 | 0.065 | 0.171 | 9.082 | 8.637 |
| 1 | 19.8 | 24.6 | 0.484 | 0.199 | 0.387 | 0.611 | 0.043 | 0.176 | 9.391 | 8.547 |
| 0.75 | 18.3 | 24.3 | 0.567 | 0.153 | 0.403 | 0.595 | 0.016 | 0.182 | 9.642 | 8.457 |
| 0.5 | 17.4 | 24.2 | 0.643 | 0.12 | 0.417 | 0.582 | 0.001 | 0.184 | 9.831 | 8.383 |
| 0.25 | 16.8 | 24.2 | 0.693 | 0.096 | 0.429 | 0.571 | 0 | 0.185 | 9.96 | 8.32 |
| 0 | 16.6 | 24.2 | 0.719 | 0.087 | 0.433 | 0.567 | 0 | 0.185 | 10 | 8.3 |
Case 3: Three-seller auction with two advantaged sellers
When two advantaged sellers compete against a single disadvantaged seller has not been considered in the prior literature. These results, shown in below table and figure, are dramatically different from the three-seller case with only one advantaged seller. In Case 2, the two disadvantaged sellers offer little competition for the advantaged seller such that she is able to realize high profits at the expense of the disadvantaged sellers. In Case 3, competition for an advantaged seller is greater since each seller must compete against another advantaged seller and only one disadvantaged seller. As cost uncertainty for the advantaged sellers decreases, both are forced to adopt a more aggressive bidding strategy. In conjunction with this aggressive bidding, πa for the two advantaged sellers initially increases at a relatively modest rate, 0.316 to 0.359, as σα approaches 0.75. Over this same change in cost uncertainty, the disadvantaged seller adopts an extremely conservative bidding strategy whereby md increases from 25.4 to 75.0. The result is that πd decreases from 0.316 to essentially zero where the disadvantaged seller has a zero probability of winning a bid. As shown in below results, there is a point where increases in the relative difference in estimating uncertainty between the two types of sellers results in the disadvantaged seller having to exit the market at which point further reductions in cost uncertainty for the two advantaged sellers actually results in a decrease in their profitability. In this instance, the two advantaged sellers essentially end up in a symmetric two-seller auction where, at the extreme, each seller has perfect information regarding the cost of the product, σα=0. At this point, neither of the advantaged sellers can make a positive profit as the optimal solution is to bid their estimate of cost. These results show that the disadvantaged seller is in a precarious situation when she competes against two advantaged sellers. In this scenario, the optimal strategy for a disadvantaged seller is to bid less aggressively by dramatically increasing their markup. However, this strategy is only viable so long as the advantaged sellers are not too advantaged (Table 3).
| σaσd = 1.5 | Markups (%) | Expected profit per bid | Probability of winning bid | Probability of winner’s curse |
Mean cost estimate of winning bid |
|||||
|---|---|---|---|---|---|---|---|---|---|---|
| Adv. bidder | Adv. bidder | Disadv. bidder | Adv. bidder | Disadv. bidder | Adv. bidder | Disadv. bidder |
Adv. bidder |
Disadv. bidder | Adv. bidder | Disadv. bidder |
| 1.5 | 25.4 | 25.4 | 0.316 | 0.316 | 0.666 | 0.332 | 0.161 | 0.08 | 8.731 | 8.731 |
| 1.25 | 21.6 | 25.6 | 0.33 | 0.193 | 0.695 | 0.303 | 0.141 | 0.087 | 9.005 | 8.534 |
| 1 | 17.4 | 26.6 | 0.349 | 0.095 | 0.77 | 0.228 | 0.126 | 0.076 | 9.291 | 8.228 |
| 0.75 | 13.6 | 32.8 | 0.359 | 0.025 | 0.871 | 0.127 | 0.103 | 0.048 | 9.529 | 7.682 |
| 0.5 | 9.5 | 75 | 0.318 | 0 | 0.994 | 0.186 | 0.08 | 0.184 | 9.717 | 5.723 |
| 0.25 | 4.5 | na | 0.151 | 0 | 1 | 0 | 0 | 0 | 9.859 | na |
| 0 | 0 | na | 0 | 0 | 0 | 0 | 0 | 0 | 10 | na |
Cost uncertainties and buyer procurement costs
We now consider how cost uncertainties between sellers affect the buyer. This goes to the heart of an important question: Should the buyer ensure that all sellers are equal adept at estimating product costs, perhaps working more closely with known disadvantaged sellers during their cost estimation process, or should the buyer prefer to have a seller who is known to estimate their costs more accurately? Intuitively, a buyer would expect her procurement cost to decease as the level of competition between sellers is increased. When one seller has an information advantage over another, competition should be less than when neither seller enjoys an advantage. Suggest that the buyer procurement costs will be lower with asymmetrically informed sellers than symmetrically informed (Table 4) [37-38].
| Symmetric information | Asymmetric information | ||||
|---|---|---|---|---|---|
| σa | Two bidders | Three bidders | Two bidders/ | Three bidders/ | Three bidders/ |
| σd = 1.5 | One advance | One advance | Two advances | ||
| 1.5 | 11.918 | 10.948 | 11.918 | 10.948 | 10.948 |
| 1.25 | 11.59 | 10.802 | 11.767 | 10.893 | 10.854 |
| 1 | 11.266 | 10.655 | 11.621 | 10.883 | 10.795 |
| 0.75 | 10.936 | 10.489 | 11.497 | 10.874 | 10.745 |
| 0.5 | 10.622 | 10.324 | 11.404 | 10.884 | 10.637 |
| 0.25 | 10.302 | 10.302 | 10.16 | 10.892 | 10.219 |
| 0 | 10 | 10 | 10 | 10.893 | 10 |
The expected cost to the buyer when sellers have the same level of uncertainty over their cost estimates (symmetric). In addition, expected procurement costs are shown when sellers have different levels of cost uncertainty (asymmetric). If we compare results for the two-seller case, columns (2) and (4), the cost to the buyer is generally less when sellers are symmetric than when sellers are asymmetric. However, when an advantaged seller is much advantaged, σα<0.25, the cost to the buyer is actually less than when sellers are symmetric. Therefore, it is situational as to whether the buyer should prefer symmetric or asymmetric sellers as the degree of the information advantage between the sellers is important. In addition, if all sellers are symmetric, procurement costs to the buyer are reduced when all seller cost estimates are more precise, columns (2) and (3). This suggests that it may be in the buyers’ best interest to provide each seller with as much information pertaining to the product as possible thereby reducing seller information uncertainties. If the auction has an advantaged seller competing against a single disadvantaged seller, column (4), buyer procurement costs decrease as the advantaged seller becomes more advantaged.
When there are three sellers, buyer procurement costs are generally lower when sellers are symmetric, columns (3), (5) and (6). These results are consistent for the case with one or two advantaged seller(s). The worstcase scenario for the buyer is when there is a single advantaged seller competing against two disadvantaged sellers, column (5). As a general rule, if an auction does include an advantaged seller, buyer procurement costs are reduced if the advantaged seller improves their cost estimating abilities. If, however the buyer knows that all sellers are equally proficient at estimating costs or is able to help a disadvantaged seller with their cost estimates, it is in his best interest to increase the number of participating sellers.
This paper, using a FPSB procurement auction with asymmetric sellers, investigates the impact of cost estimation accuracy on seller bidding strategies and profitability. Based on actual data, we assume the more realistic case where errors in cost estimates are randomly drawn from a normal distribution which greatly complicates the analysis, limiting our ability to find a closed form solution. As such, we determine equilibrium bidding strategies for both type of sellers using a numerical approximation approach. To the best of our knowledge, this is the first paper that provides equilibrium results for various levels of advantage in a common value asymmetric procurement auction with a specific focus on how the level and extent of advantage affects seller bidding strategies. In this paper, an advantaged seller has better information, less uncertainty in their cost estimates, than does the disadvantaged seller. Results for the two-seller and three-seller cases clearly illustrate the importance of cost estimation accuracy on the expected profits of the advantaged seller(s). In addition, this paper illustrates the impact on a company with less accurate cost estimates that competes against a company that has better cost estimates.
This study finds that in a two-seller auction, a disadvantaged seller will bid more aggressively than an advantaged seller in an effort to win bids. Our results show that while this is generally true, the difference in the level of aggressive bidding is only slight yet the difference in expected profits is dramatic. Our study extends these results to a three-seller auction where we find that the level of aggressive bidding depends on the number of sellers in the auction as well as the number of advantaged and disadvantaged sellers. Our findings also provide several predictions regarding bidding strategies. Indeed, when multiple disadvantaged sellers compete against a single advantaged seller, the optimal bidding strategy for the disadvantaged sellers is to bid rather conservatively compared to the advantaged seller who should bid very aggressively, taking advantage of their better cost estimates. However, when multiple advantaged sellers are present, the optimal strategy for the disadvantaged seller is to bid very conservatively with much higher markups. Even so, the disadvantaged seller is in a precarious situation. If the advantaged sellers improve their cost estimation accuracy without an improvement by the disadvantaged seller, eventually the disadvantaged seller will be forced out of the market. Lastly, we find that it may be in the best interest of the buyer to help all sellers estimate their costs more accurately as doing so reduces their expected procurement costs. When all sellers have equal information, the level of competition in the auction is increased thus both sellers must bid more aggressively. In summary, our results show that bidding strategies and resulting profits are situational with respect to the degree of advantage enjoyed by the advantaged seller(s).
The number of sellers and the number of advantaged sellers in the auction. Going forward, there is much research to be done regarding the use of procurement auctions and the role of information within such auctions. For example, given that the use of procurement auction has been increasing in both the private and public sectors, developing some type of metric to assess the performance of the procurement approach regarding costs to conduct the auction, reductions in buyer procurement costs, and impact on the quality, reliability and performance of the item being sold. Such a metric would allow for a comparison of different auction mechanisms which would be helpful to buyers going forward. Another area of research is assessing the impact of procurement auctions on the longterm relationships between buyer and sellers. Procurement auctions are commonly viewed as an antagonistic approach to purchasing by many sellers. As such, does the relationship between buyer and seller suffer is the buyer chooses to employ a procurement auction for its purchasing needs. In regards to the role of information, there is still much to learn given the sparsity of previous research on asymmetric procurement auctions. When the auction is asymmetric, one seller, the advantaged seller, has a distinct advantage over the disadvantaged seller(s). The advantage can arise from better information, such as studied in this paper, or can arise from lower production costs. An interesting question that needs to be researched is how these two advantages interact. For example, one company may be cost-advantaged having a lower cost of production than its’ competitors yet may suffer from an information disadvantage such as the inability to accurately estimate costs. In this case, can an information advantage help a seller overcome any cost disadvantages? Another area of needed research is the development of analytical models of more realistic scenarios. Previous theoretical research has made very restrictive assumptions in order to provide closed form solutions at the expense of realism. For example, full information disclosure to all parties is often not available which has been the normal assumption in the literature. What happens when the information known by the agents is different? Also, research has shown that bidding strategies hence cost estimations generally follow a bell-shaped distribution. The development of analytical models incorporating such distributions is sorely needed.