Research - (2021) Volume 10, Issue 4
Received: 11-Mar-2021
Published:
22-Apr-2021
, DOI: 10.37421/2168-9768.2021.10.264
Citation: Kedrala Wabela, Sirak Tekleab. "Improving Water Use Efficiency for Onion Through Deficit Irrigation in Southern Ethiopia." Irrigat Drainage Sys Eng 10 (2021): 264.
Copyright: © 2021 Wabela K. This is an open-access article distributed under the terms of the Creative Commons Attribution License, which permits unrestricted use, distribution, and reproduction in any medium, provided the original author and source are credited.
Deficit irrigation is one of agricultural water management practice in arid area in which the irrigation water management has to be improved so that water supply to the crop can be reduced while still achieving high yield. The main objective of this study was to improve agricultural water use efficiency (WUE) of onion under different deficit irrigation levels. Randomized complete block design (RCBD) with eleven treatments and three replications was used. The treatments were: full irrigation (0% deficit as a control), and 25% and 50% of crop water requirement (CWR) deficit throughout growing season, and one period deficit treatments (25% and 50% of CWR deficit at initial, development, bulb formation and maturity stages). Treatment 10 (50% of CWR deficit at bulb formation stage) showed the minimum harvest index (0.68) and 25% of CWR deficit at initial and maturity stages respectively showed the maximum harvest index. Yield response factor (ky) indicated that onion was sensitive (yield reduced) for water deficit at development and bulb formation stages. The maximum water use efficiency (4.98 kg/m3) was observed at 50% of CWR deficit throughout growing season and the minimum (3.22 kg/m3) was observed at 50% of CWR deficit at bulb formation stage. Water deficit at initial and maturity growth periods had insignificant impact on WUE of onion. Generally, this result indicated that water deficit at bulb formation growth period of onion reduce more water use efficiency than water deficit on other growth periods.
Efficiency • Deficit • Irrigation • Harvest index • Yield response factor
Water scarcity is a pressing issue at a global scale. In recent years, the needs of water for various consumptions in the one hand and the environmental changes (due to e.g., land use and climate) on the other hand pose additional threats to the limited freshwater availability. Among the various needs, agriculture consumed large amount of water. The consumption will be escalated owing to the increasing world population to grow from 7 billion at present to 9 billion by 2050. The rate of growth is rapid in the least developed countries. The population growth combined with the rise of living standards requires a substantial increase of food production to ensure sustainable food security [1]. Improved living standard of people and erratic rainfall in amount and distribution increases the competition for water resources and eventually add challenges for tomorrow's water planner. Due to these reasons water for agriculture is reduced and agricultural production and securing food for future generations is becoming more challenging task. To reduce these problems, implementations of effective agricultural water management techniques, which enable to increase water use efficiency, are crucial at global scale in general and in water scarce region in particular [2].
Deficit irrigation is one of the irrigation water management practices which is essential for saving water by minimizing adverse effect on yield. Deficit irrigation is an optimization strategy whereby net returns are maximized by reducing the amount of irrigation water and crops are deliberately allowed to sustain some degree of water deficit with insignificant yield reduction. Deficit irrigation increases the productivity of water in agriculture and plays an important role in reducing competition for scarce water resources, minimizing environmental degradation and provision of food security. However, the amount of irrigation water reduction is based on crop characteristics and generally accompanied by no or insignificant yield loss that increases the water productivity [3].
According to FAO, the main objective of deficit irrigation is to increase the water productivity of a crop by eliminating irrigations that have little impact on yield. The resulting yield reduction may be small compared with the benefits gained through diverting the saved water to irrigate other crops for which water would normally be insufficient under traditional irrigation practices. In principle, deficit irrigation is practiced to maximize profits where water costs are high or there is water shortage. In this case, crop values are associated closely with yield, and crop grade and marketability. Under these circumstances, deficit irrigation can be a practical choice for growers [4].
In Ethiopia deficit irrigation is rarely applied. Only few experimental researches have been conducted on deficit irrigation of maize crop Yenesew and Tilahun, onion Lemma and shimelis. However, the results obtained from these experiments were not applied for all regions due to differences in soil and climatic factors. Local evaluation of irrigation production based on crop water use efficiency and economic water productivity per unit water used are the most important aspects of crop production in water scarce area. The main objective of this study was therefore to improve the water use efficiency of onion in different water deficit levels in semi-arid climate of Mareko district, southern Ethiopia [5].
Description of the study area
The experiment was conducted in 2017 at Marek district in southern Ethiopia. Mareko district is one of the thirteen districts’ that located in the Gurage zone. The altitude of the district ranges from 1700 to 2076 m.a.s.l. The experimental site is located at 8.02° N latitude and 38.51°E longitude. The annual rainfall of the study area ranges from 500 to 800 mm and seasonal rainfall pattern varying in depth. The mean annual temperature ranges from a minimum of 11.8°C to a maximum of 27.4°C. The soil of the experimental area is dominated by red and gray color with loam texture. 87.75% of people in the study area are farmers mainly cultivate tomato and, pepper (piper nigrum), from vegetables and maize (Zeamay) and wheat from cereals. Location map and weather condition of the study area are presented below in Figures 1 & 2 respectively.

Figure 1. Location map of the study area.

Figure 2. Weather condition of experimental area.
Treatments and Experimental Design
Bombered variety of onion was used as planting material. The crop growth period of onion divided into four major growth stages based on FAO (1996) recommendation. Accordingly: initial stage (S1=20days), development stage (S2=30days), bulb formation stage (S3=30days) and maturity stage (S4=15days). Eleven treatments: full crop water requirement (0% deficit as a control) and 25% and 50% of crop water requirement (CWR) deficit throughout growing season and one stage deficit (25% and 50% of CWR deficit) treatments at four different growing stages (initial, development, bulb formation, maturity) of onion was used (see Table 1). Each treatment had three replications and made a total of 33 experimental plots that were arranged in a randomized complete block design. Each plot has 8 m2 (2.0 m x 4.0 m) areas.
| Trt | Growth stages | Explanation: The 100% is full CWR. | |||
|---|---|---|---|---|---|
| S1 | S2 | S3 | S4 | ||
| T1 | 100% | 100% | 100% | 100% | 0%deficit throughout the growing season |
| T2 | 75% | 75% | 75% | 75% | 25%deficit throughout the growing season |
| T3 | 50% | 50% | 50% | 50% | 50%deficit throughout the growing season |
| T4 | 75% | 100% | 100% | 100% | 25% deficit at initial stage |
| T5 | 100% | 75% | 100% | 100% | 25% deficit at development stage |
| T6 | 100% | 100% | 75% | 100% | 25% deficit at bulb formation stage |
| T7 | 100% | 100% | 100% | 75% | 25% deficit at maturity(late) stage |
| T8 | 50% | 100% | 100% | 100% | 50% deficit at initial stage |
| T9 | 100% | 50% | 100% | 100% | 50% deficit at development stage |
| T10 | 100% | 100% | 50% | 100% | 50% deficit at bulb formation stage |
| T11 | 100% | 100% | 100% | 50% | 50% deficit at maturity(late)stage |
NB: T1-T11= denotes 11 different treatment, S1-S4= four growth stages,
The space between plots and blocks were 1 m and 1.5 m respectively. As per the recommendation of Melkasa Agricultural research center, the spacing between onion plants and rows kept at 10 cm and 20 cm respectively. Each plot had10 rows of onion plants and 40 plants in each row with a total plant population of 400 in each plot. The experimental field total area was 15 m*32 m=480 m2 (Figure 3).

Figure 3. Field layout.
Soil sampling and analysis
Soil samples were taken at depths of 0-30 and 30-60 cm, since the root depth of onion grows up to 50 cm. Soil sample was collected from experimental field diagonally to avoid bias in the sampling and it was taken just before starting of field preparation. Physical and chemical properties of the soil were analyzed. Disturbed mixture of soil samples was taken using auger for the analysis of soil moisture, texture, pH, EC and OM. The analysis was carried out at Southern region agricultural department soil laboratory section.
Soil textural class was analyzed by using hydrometric method from collected soil samples for each depth and it was determined using USDA textural triangle procedure. Low quality of irrigation water affects the soil property and retard plan growth. Soil to water ratio of 1:5 extract was used to determine electrical conductivity of the soil using calibrated cell electrode and expressed as dS/m based on the methods developed by the United State Salinity Laboratory Staff. The infiltration rate of the soil in the experimental field was determined using double ring infiltrometer method before the staring of the experiment. The double ring infiltrometer was setup in the field surface and measured the depth of water levels infiltrated for 128 minutes continuously and the rate at which water level infiltrated was calculated.
Determination of Crop Water Requirement (CWR)
Crop water requirement (CWR) over the growing season was calculated from reference evapotranspiration (ETo) and crop coefficient (Kc) for that stage using equation 1:
 (1)
(1)
Where, ETc= crop water requirement (mm), kc=crop coefficient, ETo= reference evapotranspairation (mm)
To determine ETo, sixteen years (2000-2015) of monthly values of maximum and minimum air temperature, were used. It was recived from Ethiopia National Metrological Agency Hawassa branch. ETo was calculated based on temperature-based methods (reduced Penman-Monteith by using CROPWAT software) since humidity, wind speed and sun shine hour data of the area were not available.
The net irrigation requirement was calculated using the CROPWAT computer program based on Allen et al. (1998) as follows:
 (2)
(2)
Where, IR =Irrigation requirement (mm), ETc in mm and Pe = effective rainfall (mm) which is part of the rainfall that enters into the soil and makes available for crop production. However, since there was no rainfall during the experimental period, pe is equal to zero and net irrigation requirement was taken as equal to the crop water requirement.
Water was applied in known volume of watering can by converting the crop water requirement in depth to volume. As the plots were sufficiently leveled, water was applied only to refill the soil water to required level. Surface runoff was assumed to be zero as the irrigation water was protected by constructed soil bunds around each plot. Volume of applied water to experimental plots was calculated as follows:
 (3)
(3)
Where: d = depth of application (m), V = volume of water (lit), A = plot area (m2)
Data Collection and Analysis
At the end of the season the amount of bulb yield produced was harvested and weighted from each plot. The harvested yield was grouped based on its quality for market according to the size and degree of damage. Lemma and Shimels (2003) stated that onion bulb with less than 2 cm diameter was categorized under nonmarketable yield.
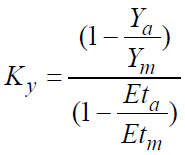
Water applied in the total growing season for full irrigated treatment (T1), was taken as the maximum evapotranspiration (ETm), and the deficit water applications values were taken as actual evapotranspiration (ETa) and yield response factor was calculated. A standard formulation relates four parameters (Ya, Ym, ETa and ETm) to a fifth: Ky, the yield response factor as follows.
 (4)
(4)
where: Ky = yield response factor, Ya = yield obtained from each deficit irrigation (kg/ha), Ym = yield obtained from control (full) irrigation (kg/ha), ETa = the net depth of irrigation applied for each deficit treatments (mm), ETm = the net depth of irrigation water applied for the control treatment with full irrigation (mm).
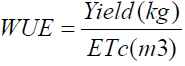
Kijne et al. (2003) give a number of strategies for enhancement of agricultural water use efficiency by integrating varietal improvement and better resource management at plant level, field level and agro climatic level.
 (5)
(5)
ETc= Seasonal crop water requirement, WUE= water use efficiency
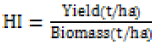
Yield depends on harvest index (HI) and the impact of water stresses on HI can be pronounced, depending on the timing and extent of stress during the crop cycle (Steduto et al., 2012). Effects of water stress on HI can be negative or positive
 (6)
(6)
Physical and chemical properties of the soil in experimental area (Table 2)
| Parameters | Soil depth(cm) 0-30 30-60 Average value |
||
|---|---|---|---|
| FC (%) | 32.6 | 31.5 | 32.05 |
| PWP (%) | 15.8 | 15.8 | 15.8 |
| TAW (mm/m) | 168 | 157 | 162.25 |
| EC (dS/m) | 0.0947 | 0.0943 | 0.0945 |
| PH | 7.19 | 7.02 | 7.10 |
| BD (gm/cm3) | 1.18 | 1.13 | 1.16 |
| Particle size distribution | |||
| Sand (%) | 24 | 30 | 27 |
| Clay (%) | 24 | 24 | 24 |
| Silt (%) | 52 | 46 | 49 |
| Textural class | Silt loam | Loam | Loam |
Crop water requirement
Seasonal water requirement for fully irrigated treatment was found to be 413.4 mm. The 310.05 mm and 206.7 mm seasonal irrigation water depths were determined for treatments that have 25% and 50% of CWR deficit throughout the season respectively (see Table 3). Water depths for one period deficit treatments were the percent of the deficit from the specific stage’s full irrigation. Since there was no rainfall in the experimental season, full crop water requirement was supplied by irrigation.
| Date | T1 | T2 | T3 | T4 | T5 | T6 | T7 | T8 | T9 | T10 | T11 |
|---|---|---|---|---|---|---|---|---|---|---|---|
| 6-Jan | 16.0 | 12.0 | 8.0 | 12.0 | 16.0 | 16.0 | 16 | 8.0 | 16 | 16.0 | 16 |
| 11-Jan | 16.1 | 12.1 | 8.1 | 12.1 | 16.1 | 16.1 | 16.1 | 8.1 | 16.1 | 16.1 | 16.1 |
| 16-Jan | 16.1 | 12.1 | 8.1 | 12.1 | 16.1 | 16.1 | 16.1 | 8.1 | 16.1 | 16.1 | 16.1 |
| 21-Jan | 16.5 | 12.4 | 8.3 | 12.4 | 16.5 | 16.5 | 16.5 | 8.3 | 16.5 | 16.5 | 16.5 |
| 26-Jan | 18 | 13.5 | 9.0 | 18.0 | 13.5 | 18.0 | 18 | 18.0 | 9.0 | 18.0 | 18 |
| 31-Jan | 18 | 13.5 | 9.0 | 18.0 | 13.5 | 18.0 | 18 | 18.0 | 9 | 18.0 | 18 |
| 5-Feb | 21.6 | 16.2 | 10.8 | 21.6 | 16.2 | 21.6 | 21.6 | 21.6 | 10.8 | 21.6 | 21.6 |
| 10-Feb | 21.6 | 16.2 | 10.8 | 21.6 | 16.2 | 21.6 | 21.6 | 21.6 | 10.8 | 21.6 | 21.6 |
| 15-Feb | 25.2 | 18.9 | 12.6 | 25.2 | 18.9 | 25.2 | 25.2 | 25.2 | 12.6 | 25.2 | 25.2 |
| 20-Feb | 25.2 | 18.9 | 12.6 | 25.2 | 18.9 | 25.2 | 25.2 | 25.2 | 12.6 | 25.2 | 25.2 |
| 25-Feb | 27.1 | 20.3 | 13.6 | 27.1 | 27.1 | 20.3 | 27.1 | 27.1 | 27.1 | 13.6 | 27.1 |
| 2-Mar | 27.3 | 20.5 | 13.7 | 27.3 | 27.3 | 20.5 | 27.3 | 27.3 | 27.3 | 13.7 | 27.3 |
| 7-Mar | 27.6 | 20.7 | 13.8 | 27.6 | 27.6 | 20.7 | 27.6 | 27.6 | 27.6 | 13.8 | 27.6 |
| 12-Mar | 27.7 | 20.8 | 13.9 | 27.7 | 27.7 | 20.8 | 27.7 | 27.7 | 27.7 | 13.9 | 27.7 |
| 17-Mar | 28 | 21.0 | 14.0 | 28.0 | 28.0 | 21.0 | 28 | 28.0 | 28 | 14.0 | 28 |
| 22-Mar | 27.6 | 20.7 | 13.8 | 27.6 | 27.6 | 20.7 | 27.6 | 27.6 | 27.6 | 13.8 | 27.6 |
| 27-Mar | 27.1 | 20.3 | 13.6 | 27.1 | 27.1 | 27.1 | 20.3 | 27.1 | 27.1 | 27.1 | 13.6 |
| 1-Apr | 26.7 | 20.0 | 13.4 | 26.7 | 26.7 | 26.7 | 20.0 | 26.7 | 26.7 | 26.7 | 13.4 |
| Total | 413.4 | 310.1 | 206.7 | 397.2 | 381.0 | 372.1 | 400.0 | 381.1 | 348.6 | 330.8 | 386.5 |
Responses of onion bulb yield to water deficit
The responses of onion bulb yield to different depth of irrigation water at different growth stages were varied. As it shown in figure 4, the highest mean marketable bulb yield (19.93 t/ha) was observed at T1 (0% deficit) and the lowest mean yield (10.31 t/ha) was recorded at T3 (50% of CWR deficit throughout the growing season). The reason for this yield reduction might be reduction in photosynthesis due to water stress which is responsible for yield formation. Related results were obtained for onion by Bekele and Tilahun, where 25% and 50% water deficit throughout the growing season resulted in 15 and 45% reduction in yield, respectively.

Figure 4. Yield produced under different seasonal irrigation water depth (mm).
In this experiment there was no statistically significant yield difference between control treatment (0% deficit) and T4 (25% of CWR deficit at initial stage), T7 (25% of CWR deficit at late stage) and T11 (50% of CWR deficit at late stage). This indicated that reducing irrigation water during initial stage by 25% and during late stage up to 50% did not brought significant yield reduction compared with full irrigation. On the other hand, 50% of CWR deficit at development and mid growth stages brought significant yield reduction. Kumar concluded that depending on the quantity and timing of irrigation, the applied irrigation imparted different degrees of influence on the various components of growth and yield parameters of onion. Nazeer and Ali also discussed that different irrigation water depth affects onion yield and biomass. Generally, water deficit at the initial and late growing stages had limited effect on onion yield, whereas water deficit at the development and mid stages had significant yield reduction effect (Figure 4).
Harvest index(HI)
Shortage of water reduces canopy cover of the crops which is responsible for photosynthesis process and indirectly affects harvest index. In this experiment harvest index for different treatments were affected by the period of deficit water application. Water deficit at development and bulb formation stages decreased the harvest index of onion (see Table 4). T10 (50% of CWR deficit at bulb formation stage) showed the lowest harvest index and T7 (25% of CWR deficit at maturity stage) accrued the highest harvest index. This result in line with Steduto report who observed that water deficit at yield formation stage reduces harvest index of crops.
| Treatments | T1 | T2 | T3 | T4 | T5 | T6 | T7 | T8 | T9 | T10 | T11 |
|---|---|---|---|---|---|---|---|---|---|---|---|
| HI | 0.87 | 0.87 | 0.80 | 0.90 | 0.80 | 0.76 | 0.91 | 0.76 | 0.73 | 0.68 | 0.87 |
Water use efficiency (WUE)
Water deficit at bulb formation stage of onion resulted low crop water use efficiency. This was the result of high yield reduction due to water deficitat yield formation stage. Water deficit at initial and late stages of onion had limited impact on water use efficiency (see Figure 5). English concluded that it is important to decide on the deficit level and the time of its application to achieve the highest water use efficiency at minimum cost. The report of experimental result conducted by Bekele and Tilahun indicated that if water deficit occurred at initial growth stage, it increases the water use efficiency of onion by 6%. They also reported that 75% of CWR deficit throughout the growing season increases WUE by 13%.

Figure 5. Water use efficiency under different seasonal irrigation water depth (mm).
The water use efficiency of treatment that had 50 % of CWR deficit throughout growing season was high. However, in this treatment the yield reduced due to water deficit was significant. The water use efficiency result showed that decreasing irrigation water increases the yield per cubic meter of applied water. Higher dosage of water applied meant lower water use efficiency. The lower water use efficiency at high dosage of irrigation water could be due to lack of proportional increase in yield with increasing water depth further.
Yield response factor
Yield of onion was not sensitive for water deficit that occurred at initial and maturity stages (25% of CWR deficit at initial and maturity stages) since yield response factor ( ky) is less than one. i.e onion tolerate some degree of water deficit at initial and maturity stage without significant yield reduction. 50% of CWR deficit at initial and maturity stages showed the sensitivity of onion for high water deficit since the value of yield response factor greater than one (ky>1). Similarly, 50% of CWR deficit at development and bulb formation stage and 25% of CWR deficit at development and bulb formation stages shown the sensitivity of onion for water deficit (ky>1) (see Table 5). This might be due to higher water need for development and yield formation at these stages. This variability in response of crops for water deficit at different growth stages were illustrated by Steduto. They also concluded that flowering and yield formation stages of crops are sensitive to water stress, while stress occurring during the late stages has limited effect.
| Trt | Actual yield in kg/ha | Maximum yield in kg/ha | Actual Eta (mm) | Maximum ETm (mm) | Yield response factor (ky) |
|---|---|---|---|---|---|
| 19936.67 | 413.40 | ||||
| T2 | 14833.33 | 310.05 | 1.02 | ||
| T3 | 10310.00 | 206.70 | 0.97 | ||
| T4 | 19446.70 | 397.23 | 0.63 | ||
| T5 | 15200.00 | 381.00 | 3.03 | ||
| T6 | 15030.00 | 372.08 | 2.46 | ||
| T7 | 19713.30 | 399.95 | 0.34 | ||
| T8 | 15060.00 | 381.05 | 3.12 | ||
| T9 | 13656.70 | 348.60 | 2.01 | ||
| T10 | 10656.70 | 330.75 | 2.33 | ||
| T11 | 17856.70 | 386.50 | 1.60 |
ETa=actual evapotranspiration, ETm=maximum evapotranspiration,
The result obtained from this field experiment indicated that when water deficit occurred throughout the growing season, water use efficiency of onion is maximized. The water use efficiency of deficit irrigation throughout the season is higher than the water use efficiency of deficit at specific stage. In addition to this, water deficit at initial and maturity stages have limited impact on water use efficiency of onion. Water deficit at development and bulb formation stages of onion causes high yield reduction and low water use efficiency. The saved water from deficit irrigation in these stages does not compensate the yield loss due to water deficit. Water deficit at bulb formation and development stages also have negative effect on harvest index of onion.
Irrigation & Drainage Systems Engineering received 835 citations as per Google Scholar report


