Research Article - (2025) Volume 14, Issue 1
Received: 30-Dec-2023, Manuscript No. IDSE-24-124161;
Editor assigned: 02-Jan-2024, Pre QC No. IDSE-24-124161 (PQ);
Reviewed: 16-Jan-2024, QC No. IDSE-24-124161;
Revised: 21-Jan-2025, Manuscript No. IDSE-24-124161 (R);
Published:
28-Jan-2025
, DOI: 10.37421/2168-9768.2025.14.470
Copyright: © 2025 Ali H, et al. This is an open-access article distributed under the terms of the creative commons attribution license which permits unrestricted use, distribution and reproduction in any medium, provided the original author and source are credited.
Irrigation is taken as not only improving the living habits of the societies but also having the ability to avoid the uncertainty that comes with climate change. This study was conducted to evaluate the hydraulic performance of Kelina's small-scale irrigation scheme using selected performance indicators. Primary data like applied water measurement at head, middle and tail reach of the field, taking soil samples for determination of (moisture content, field capacity. permanent wilting point and total available water), canal flow measurement, field observation and focal group discussion and secondary data like (meteorological data, cropping data and data related to design document of irrigation scheme) were taken from the concerned institutions. After the data were taken the data were analyzed by empirical formula, CROPWAT model and Microsoft Excel. The data has been analyzed by Based on the results obtained, the study area has a clay type soil with a total available water of 122.3 mm/m and a 0.54 cm/hr infiltration rate. The ratio of relative water supply and relative irrigation supply was 0.92 and 0.83, respectively, which indicates a shortage of water supply since the ratio is less than one. The overall water delivery performance indicators like adequacy, equity, efficiency, and dependability have been 83, 0.11, 0.91, and 0.18 percent, respectively. The conveyance efficiency, application efficiency, deep percolation ratio, and overall scheme efficiency were 58.32, 67.57, 32.43, and 39.41%, respectively. The irrigable area was reduced by 23% and the number of infrastructures was reduced by 44.75%. Generally, the current performance of the irrigation scheme is classified as fair performance. Due to this, providing night storage, regular maintenance, and flow control structures at each off gate were recommended that enables the scheme to perform well.
Kelina irrigation scheme • Hydraulic performance • Scheme • Small scale irrigation
Saharan African countries choose irrigation as one of several options for maintaining food security and the region has several surface and groundwater potentials that can change and improve the living standards of the people [1,2]. Irrigation is taken as not only improving the living habits of the societies but also having the ability to avoid the uncertainty that comes with climate change [3]. Even if the country has such high water potential, its economy still depends on natural rainfall, which doesn't keep food safe Kedir and Tesfaw [4,5]. Of the 70 million hectares of cultivable land, only about 15 million hectares were cultivated and about 640,000 hectares were covered by irrigation schemes across the country [6]. Of the 70 million hectares of cultivable land, only about 15 million hectares were cultivated and about 640,000 hectares were covered by irrigation schemes across the country. Among the irrigation methods, surface irrigation, which is public in different part of the country has been dominantly experienced in modern and traditional irrigation and accounts about 56% of the total countrywide irrigated zones.
Currently, irrigation development in a country is divided into largescale (>3000 ha), medium-scale (200-3000 ha), and small-scale (200 ha) schemes based on the total area covered. Large scale irrigation is constructed and headed by the federal government and is responsible for producing high quality cash crops for industrialization and foreign export, as well as creating employment for youths. According to the report by MoWIE the achievement shows that construction of small scale irrigation infrastructure covers around 2.4 million hectares of land that was irrigated close to the first Growth and Transformation Program (GTP) and further plans were planned to increase this by 75% [7]. Small-scale community-managed irrigation is by far the dominating irrigation scheme that improves the Livelihoods of smallholder farmers. Small scale irrigation is responsible for feeding the rapidly Increasing population, poverty reduction, and increasing production. It also generates job opportunities for young people and increases farmers' income by changing economic vulnerability and yielding high-cost cash crops aimed for selling purposes [8].
In our country Ethiopia, many irrigation schemes, are characterized by a low level of overall performance. Based on the report of MoWIE, the main challenging factors for the development of irrigation in the country are: Lack of awareness of irrigation water management, inadequate operation and maintenance of irrigation facilities, non-availability of water measuring devices and a lack of experience in design, construction, and supervision of the scheme. Even though different scholars did different research about the performance of irrigation schemes, the involvement of water users, development agents, and concerned institutions was insignificant or absent, and the output didn't reach the users Mekonen, et al. [9]
The Amhara region is one part of the country that has been implementing a small-scale irrigation scheme since the 1970's. In addition to the high area coverage, the region has the largest surface water resource in the country. In order to use these water resources, the region has launched more than 300 medium and small-scale irrigation projects. As Mekonen, et al. studied, of the total irrigated land, small-scale irrigation covered 5718.68 ha and the medium-scale irrigation scheme covered 2750.58 ha of the whole irrigated area of 8469.26, and 17,443 people participated. Furthermore, the region's efforts to expand new irrigation infrastructure and scale up existing and traditional small-scale irrigation schemes are noteworthy [10]. As Wondimkun and Tefera studied, the performance of numerous irrigation schemes in the region is far below their potential due to inefficient water management, poor maintenance of infrastructure and marketing problems [11].
The Kelina irrigation scheme allowed the farmers to apply irrigation and has enabled them to frequently harvest twice a year. The water supply method in the system is stable turning water delivery, yet the water regulator and amendable mechanisms are oldstyle, using barriers like plant leaves and stones. This study was conducted to estimate the performance of a Kelina small scale irrigation scheme using certain performance indicators. The study enables system managers, farmers, and experts to have a better thoughtful of how a system should be managed and operated.
This study aims to address the following:
• To evaluate relation of water supply versus demand of scheme at intake outlet using selected external indicators.
• To evaluate the water delivery performance of the scheme in terms of internal performance indicators.
• To evaluate conveyance and on farm water application efficiency using internal indicators.
• To assess the level of maintenance requirements and physical (area) based on performances using indicators.
Location and climate
The study area is located in ANRS, south Wollo zone, Dessie- Zuria district, mainly at 012 and 015 Keble. The project site is about 10 km from Dessie town, which is the capital city of the S/Wollo zone, and 385 km from Addis Ababa. The irrigation project is located near the Kelina River, 11°4’6’’N to 11°4’48’’N and 39°38’5’’E to 39°39’8’’E and the headwork structures are specifically located at 1885 m.a.s.l (Figure 1).

Figure 1. Location map of the study area.
The research area has a bimodal rainfall pattern and the main rainy season is summer, which extends from June to September. The annual mean rainfall of the study area was 1010.7 mm. The highest mean monthly rainfall was recorded in August with an amount of 292.9 mm and the lowest rainfall was recorded in the month of December with an amount of 21.1 mm, with an average of 84 mm. The annual mean minimum and maximum temperatures are 12.4 and 26.9 degrees celsius, respectively, and the relative humidity ranged from 35 to 60%, with an average of 53.7%. Land use in the study area is dominated by traditional rain-fed peasant farming on individual holding and grazing of livestock on private and communal forest and bush land. The source of irrigation water is the Kelina River, which is diverted into the scheme through diversion headwork. Based on the laboratory analysis results, the dominant soil type was clay soil and had an average available soil moisture content of 122.3 mm/m. The basic infiltration rate of soil was 129.6 mm/day, which was evaluated using a double ring infiltro-meter. Most of the topography of the cultivated land is found between nearly level and moderately sloping land, which is suitable for surface irrigation
Current status of the scheme
The source of water for irrigation is the Kelina River. The intended command area of the scheme is 100 ha, and currently, 91.3 ha are irrigated. About 255 household farmers were included in the irrigation scheme, with a land holding capacity of 0.2-0.75 ha. The scheme has one main canal that delivers water to secondary canals with a designed discharge of 60 l/s. The project also has one lined and unlined canals in combination with several off gates. Structurally, both the main canal and the lined secondary canal were positioned well, but the method of conveying water was not in an efficient manner. The unlined secondary canal has been affected by sedimentation and high vegetation growth. Even though there was a drainage system in the Scheme, the structures are not functional and no water drains from the field due to non-adequacy of water.
The farmers themselves manage the irrigation water during their time of irrigation, which results in an unfair distribution of water. As observed during the study period, there was a shortage of water availability, especially at the tail reach of the area due to unwise use of water by head reach users and a total decline of water at the source. Using end-blocked furrow irrigation was the unique behavior of the irrigation users since it saves water. The method of water distribution was a rotational system that follows non-regular irrigation intervals of 7-10 days. The shortest intervals were used during the initial stage of the crop. Concerning the water users association, WUA was formulated after the irrigation project was constructed. Currently, the WUA is not functioning properly due to a lack of selfwillingness. As a result, the water users control and manage the water solely and can grow different types of crops based on their interest. Lastly, unless timely maintenance is undertaken, the water delivery performance and the available infrastructure will not go further.
Primary data collection
The primary data sets that were collected for the study were grouped into actual field measurement and laboratory analysis.
Data collected by observation and field measurement
The following data was collected under this method of data collection:
Field investigation: Field observations were used for describing and showing the general location and distribution of resources, features, land escape, main land uses, maintenance condition, functioning of infrastructures; and proper selection of measuring points. This task was conducted with water users, water development committees, local elders, and model male and female-headed farmers.
Conduct water-user interviews: The attempt to carry out this task was to understand the existing situation of the irrigation system, the size of the current irrigated area, the functioning and non-functioning of the existing irrigation structure and operation and maintenance condition of the scheme.
Measurement of discharge (delivered water): The main objective of measuring delivered water through delivery was to determine the delivery performance and conveyance efficiency of the canal. The canal was sectioned into head, middle, and tail reaches to measure the delivered flow. The delivered water to the canal was measured by the V-notch, floating and cross-section methods. After proper selection of measuring points, the canal section was divided into tail, middle, and head reaches to measure velocity, discharge, and cross section.
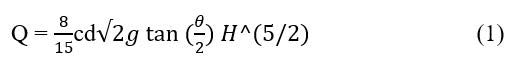
Where:
Q=discharge (m3/s),
H=Head (m),
θ=Angle of the notch (90 degree),
Cd=Discharge coefficient=0.62 for 90 degree V-notch.
Measuring applied water to the crop's root zone: The main purpose of measuring the applied water to the field was to determine the onfarm water application and deep percolation ratio. A V-notch was installed at the selected nine farmers' fields at the head, middle, and tail reaches to determine the amount of water applied to the field at a certain rate. The applied depth of water was measured two times per day at the head, middle, and tail reach of the field during the initial, development, and late stages of the crop growing period, and the average depth was taken as a monthly flow rate.
The volume of water that was applied to the field was estimated by the product of the flow rate that was measured by a notch and the time taken to irrigate the entire field. Lastly, the volume of water delivered to the field was divided into the irrigated area to determine the applied depth of water in the crop root zone in mm.
Application efficiency was estimated as the ratio of the depth of applied water to the crop root zone (mm) to the depth of water stored in the crop root zone (mm). The water stored in the crop root zone was measured as the difference between the moisture content of soil before irrigation and the moisture content of soil after irrigation and converted to mm by multiplying with the depth and bulk density of soil, which were determined in the laboratory.
Determining the rate of soil infiltration: One of the main variables that affect irrigation efficiency is the infiltration capacity of the soil. For this study, a double ring infiltro meter, which is made from metal, was used, and the infiltration rate of soil was measured at the head, middle, and tail reaches of the field. Water was allowed to flow in a one-dimensional flow from the inner ring, and the outer ring was used to protect the lateral movement of water.
Lastly, the basic infiltration rate in mm/day was taken as input data for the CROPWAT model.
Measurement of water surface elevation and canal dimensions: Measurement of the depth and width of the main canal was carried out to evaluate whether the depth of the canal is reducing or increasing from the design depth for different reasons. Measurements of canal water depth and width of the main canals during the irrigation season were considered at the head, middle and tail reaches. Flow depth and top width were measured by measuring tape by subdividing the total length of the main canal into sub-reaches with the same distance interval.
Measurement of the current command area: The command area was measured to deal with the physical or area-based performance of the irrigation scheme. The size of the users’ land was recorded by the Kebele DA and re-checked by measurement through GPS.
Data gathered through laboratory analysis
Soil moisture content: The moisture content of the soil was determined twice; the first was before irrigation water was applied and the second was after irrigation was applied two days ago. The method of measuring the moisture content was the gravimetric method of moisture determination. The percentage of soil particle composition was hydrometrically analyzed and the textural class of soil was determined by the USDA soil triangle method in Amhara design and supervision enterprise soil laboratory.
Field capacity, permanent wilting point, and total available water: The main purpose of analyzing those soil parameters was to understand the total available moisture content (mm/m), which was the input data for the CROPWAT model. For determining soil field capacity and permanent wilting point, the same procedure of soil sampling methods was followed as that of determining soil textural class. The soil field capacity and permanent wilting point level were examined in the laboratory using pressure plate apparatus at 0.33 bar and 15 bar, respectively.
Secondary data collection
Meteorological data: Meteorological data were obtained from the Kombolcha station of the national meteorological service which include maximum and minimum temperatures, rainfall, relative humidity, wind speed, and sunshine hours are among the data. It was used to compute the crop reference evapotranspiration and effective rainfall.
Agronomic data: It includes crop type; length of the growing period for major crops, rooting depth, different Kc values for different crops, critical moisture depletion and factor of yield reduction (Table 1).
| No. | Data | Source | Purpose | Materials used |
| 1 | Soil moisture | Field and laboratory | Determination of Ea Determination of bd | Auger, core sampler, oven dry and balance |
| 2 | Soil type, FC and PWP | Field and laboratory | Input data for CROPWAT model | Pressure plate apparatus and hydrometer |
| 3 | Soil infiltration rate | Field measurement | Input data for CROPWAT model | Double ring infiltrometer |
| 4 | Delivered discharge | Flow measurement | Determine delivery performance indicators, Ce of canal | V-notch and tape meter |
| 5 | Flow velocity | Flow measurement | Determination of canal flow | Floating material |
| 6 | Depth of applied water | Field measurement | Determination of Ea | |
| 7 | Dimension of canal | Field measurement | Determination of cross sectional area | Tape meter |
| 8 | Current canal depth | Field measurement | Determination of WSER | Tape meter |
| 9 | Crop and crop related data | Design document, literature and field observation | Input data for CROPWAT model | Formal letter for sectors. |
| 10 | Meteorological data | Metrology agency (Kombolcha) | Input data for CROPWAT model | Formal letter for agency |
Table 1. Summary of data collected and its source.
Data analysis and interpretation
During this study, the hydraulic performance of the kelina small scale irrigation scheme was analyzed and interpreted with the following sections.
Soil physical property analysis: To compute bulk density and moisture content of the soil, nine undisturbed soil samples were taken from the field at depth intervals of 0-30 cm and 30-60 cm by a core samples from the head, middle, and tail reach. The dimensions of the core sampler are 5 cm in internal diameter and 5 cm in height. The sample was analyzed at Kombolcha agricultural college's department of water resources and irrigation engineering laboratory.
The total available water of the soil was analyzed at Amhara design and supervision works enterprise soil laboratory (Bahirdar) by taking six soil samples from depths of 0-30 and 30-60 cm from the head, middle, and tail reach of the field.
CROPWAT model analysis: Crop data, soil data, and meteorological data are used as inputs to the CROPWAT model.
Crop data: The CWR and IWR of a crop were estimated only for the selected crop during the field survey. Wheat, pepper, potato, tomato, and carrot were among the crops. Crop data such as kc value, root depth, and crop height were obtained from the FAO irrigation and drainage paper no. 24. and stages of growth, crop type and planting and harvesting time was taken from field observation and interview.
Soil data: Like total available water and soil infiltration rate were taken from the results of laboratory analysis and field measurement, respectively. Root depth, soil initial moisture, and soil water depletion were taken from irrigation and drainage paper 24.
Reference evapotranspiration: The reference crop Evapotranspiration (ETO) for the subsequent month was estimated based on the FAO Penman-monolith method since it has a consistent value with actual crop water demand. After reference to evapotranspiration was estimated, the effective rainfall was estimated by CROPWAT. Lastly, crop water and irrigation water requirements and duties of each crop were computed by the CROPWAT model. Crop water requirements are estimated as the product of Evapotranspiration (ETO) and crop coefficient. The irrigation requirement of crops was also estimated as the difference between reference evapotranspiration and effective rainfall.
Performance assessment
Comparison of water supply and demand: Relative water supply and relative irrigation supply are the external performance indicators that are used to compare water supply and demand for this study at head of command.
Relative Water Supply (RWS)=(Total water supply/Crop demand) (2)
Where, Total water supply; surface diversion at the head of the command, plus rainfall crop demand=The weighted crop water requirement for the selected growing crops estimated by the CROPWAT model [12].
Relative Irrigation Supply (RIS)=(Irrigation supply/Irrigation demand) (3)
Where, Irrigation supply=Only surface diversion and irrigation demands crop water requirement less effective rainfall
For both RWS and RIS, if the value is greater than 1, it indicates water supply was beyond water demand. If it is less than 1, the water supply is less than the water demand.
Analysis of delivery performance indicators
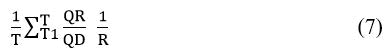
Adequacy (PA): Adequacy is the ratio of the amount of water conveyed by the structure to the amount of water needed for consumptive use, leaching and conveyance loss.
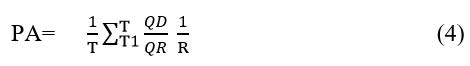
Where,
QD=The actual measured delivered flow by the notch weir at the head, middle and tail reach of area (m3/s)
QR=The estimated required flow by the CROPWAT model (l/s)
T=The time period (month) in which system performance is determined
R=The sub region of the system where performance is determined.
The equity indicator (PE): It shows the ability of a system to deliver water uniformly to all users.
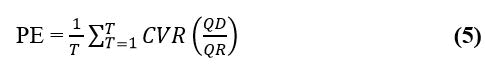
Where:
CVR=The coefficient of spatial variation of QD/QR in area R and time period T
If the value approaches 0.0, it shows an equitable distribution of water in the system and if PE becomes greater than 0.25, the equitable distribution of water becomes poor.
Dependability Indicator (PD): Dependability is expressed as the degree of temporal variability of irrigation delivery in comparison to the requirement.
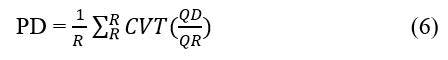
Where,
PD=Dependability indicator
CVT=The QD/QR temporal variation coefficient over time T
CVT=SD/mean, where SD is the standard deviation of discharge and mean is the average of discharge
When the result approaches zero, it indicates that the water delivery is in good condition for the time period, and if the result is greater than 0.2, the conveyance is not functioning appropriately.
Efficiency idicator (PF): Efficiency is defined as the excess of water delivered over the required amount and can be expressed as;
Where: PF=QR/QD if QR
| Measures | Classes | ||
| Good | Fair | Poor | |
| Adequacy (PA) | 0.9-1.00 | 0.8-0.89 | <0.8 |
| Efficiency (PF) | 0.85-1.0 | 0.70-0.84 | <0.7 |
| Equity (PE) | 0.00-0.1 | 0.11-0.25 | >0.25 |
| Dependability (PD) | 0.00-0.1 | 0.11-0.2 | >0.20 |
Table 2. Recommended range of delivery performance indicators.
Determination of conveyance efficiency and losses: The conveyance through the canal was computed by the ratio of discharge measured at the second control point (Qo) to the discharge measured at the first control point (Qi).
Ce=(Qo/Qi) × 100 (8)
Where:
Qo=Discharge measured at secondary control point (m3/sec)
Qi=Discharge measured at first control point (m3/sec)
Losses=Qi-Qo
Determination of overall conveyance efficiency: The overall conveyance efficiency was estimated based on Tesfaye and Geleto, et al. equations [13,14].
= Cem×Ces
Where:
Cem=Main canal conveyance efficiency
Ces=Secondary canal conveyance efficiency
Application efficiency and deep percolation ratio determination: It can be computed based on the Merriam, et al. equation.
Ea=Dsr (mm))/Daf (mm)
Averaged stored water in the root zone was estimated by the Kranz and Eisenhauer equation [15].
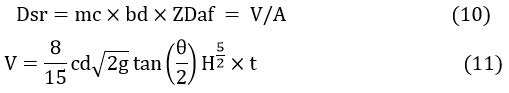
Where:
Dsr=Average depth of stored water in the root zone (mm)
Daf=Averaged depth of applied water to the field
Mc=Average moisture content (%)
Bd=Bulk density (g/cm3)
Z=depth of root zone (m)
V=Volume of water applied (m3)
A=Irrigated area (m2)
t=Elapsed time for irrigation (sec)
Ea=Application efficiency (percentage).
According to the FAO report, the maximum attainable application efficiency should range from 55% to 70% for surface irrigation.
Determination of overall scheme efficiency: The value ranges from 40-50% in most African schemes [16].
Ea×Ce (12)
Where: Ea and Ce were application and conveyance efficiency in percentage terms, respectively.
Determination of deep percolation ratio: Grandgirard, et al. equation can be used to calculate the deep percolation ratio [17].
DPR=100-Ea-RR (13)
Where:
Ea=application efficiency
RR=run off ratio
Higher DPR indicates more irrigation and lower application efficiency.
Maintenance indicators: In order to study the hydraulic performance of the irrigation scheme, regular checking of the maintenance indicator should be undertaken. For this performance, two performance indicators were studied.
Water Surface Elevation Ratio (WSER)=Actual water surface elevation at FSL/Intended water surface elevation at FSL (14)
Where: The actual water surface elevation was measured from different points (head, middle, and tail) and the intended water surface elevation was taken from design documents.
If a value is greater than one, the parameter indicates erosion or accurate digging or accurate clearing of the canal; if the value is less than one, it indicates rising of the canal due to siltation or weed incidence.
Effectiveness of Infrastructure (EI): Was estimated as:
EI=Currently number of functioning structures/Intended total number of structures (15)
Currently, the number of functioning structures has been taken from field inspection and the intended total number of structures has been taken from design documents.
Physical performance indicators: A physical performance indicator is important for assessing the sustainability of irrigated agriculture.
Sustainability of Irrigated Areas (SIA): The ratio of currently irrigated area to initially irrigated area when designed is the sustainability of an irrigated area [18].
SIA=Irrigable area (ha)/Irrigable area (ha) (16)
Where the currently irrigated area in hectares was measured by GPS and taken from a secondary source, and the designed irrigated irrigation was obtained from the design document. The value equal to or close to 1.00 indicates the irrigated area is keeping its designed state and greater than one indicates expansion of the designed or command area.
Irrigation Ratio (IR): The irrigation ratio is the ratio of the currently irrigated area to the irrigable area. It tells us the degree of utilization of the available irrigable area at a particular time (Figure 2).
IR=Currently irrigated area (ha)/Irrgable command (nominal)area (ha) (17)

Figure 2. Conceptual framework of study.
Evaluation of soil physical properties
The results of the percentage compositions of soil were 21.3%, 30.2%, and 48.5% sand, silt, and clay, respectively. Therefore, based on the study results, the soil type of the irrigation scheme is termed the clay soil type. The bulk density of soil results varied from 1.06 to 1.56 g/cm3 at the middle reach of the field (0-30 cm) and (30-60 cm) depths, respectively. The bulk density of soil increased as the depth increased for each selected field, which means that the compactness of the soil increased as the depth of the soil increased from top to 60 cm. Based on the estimated bulk density result, the soil has been suitable for crop production since the average bulk density of soil has been under 1.4 g/cm3 for clay soil [19]. The average available soil moisture content of the soil at the head, middle, and tail reaches of the field was 125.2, 118.0, and 123.7 mm/m, respectively. The total average available soil water for the field was 122.3 mm/m. The evaluated values of soil moisture content level at field capacity and permanent wilting point were agreed with recommended values by FAO for clay type soil that were 0.30-0.39 m3/m3 for PWP and 0.30-0.45 m3/m3 for FC values [20]. The mean TAW value, which was used as input data for the CROPWAT model, was 122.3 mm/m.
Evaluation of diverted water supply and demand
Diverted water supply: The estimated value of diverted water to the main canal for the study months were listed with Table 3. The monthly average diverted flow for February was 37.63 l/s and decreased to the minimum flow of the study month flow during March due to decrease in water level at the source. Due to rain that rained for a week straight and flooding that entered the river from nearby mountains, the maximum diverted flow was estimated for April; as a result, the diverted flow estimate was raised.
| Months | February | March | April | May | Average |
| Diverted flow (l/s) | 37.63 | 35.5 | 43.8 | 36.75 | 38.42 |
Table 3. Estimated value of diverted flow for study months.
Crop water and irrigation water demand: The maximum and minimum values of ETO were 3.87 mm/day and 0.5 mm/day for May and December, respectively, and the average monthly value of ETO was 2.37 mm/day. The maximum and minimum ETO values for the study period (February to May) were 3.87 mm/day and 1.47 mm/day for May and February, respectively, and the average ETO was 2.77 mm/day. For the study period (February to May), the minimum and maximum effective rainfall were 21.7 mm and 51.3 mm for February and May, respectively, and the average effective rainfall for the study period was 28.42 mm. The result shows that as the amount of rainfall increased, the estimated value of effective rainfall also increased, meaning that part of the rainfall became non-effective (Figure 3).

Figure 3. Rainfall, Reff and ETO for the study period.
Comparison of water supply and demand at intake outlet: The estimated value of Relative Water Supply (RWS) for the irrigation scheme was 0.92. The result shows the inability of the water supply to meet the crop water requirement due to the ratio being less than unity. As the value of RWS was greater than RIS, the water requirements of the crop were fulfilled by rainfall, groundwater contribution, and irrigation supply. The estimated result of Relative Irrigation Supply (RIS) was 0.83. Since the estimated result was less than one, the average diverted water was not sufficient to meet the crop irrigation requirement due to a shortage of water availability, especially at the tail reach of the scheme. This water deficiency resulted in some parts of the irrigable area becoming non-irrigated (Table 4).
| Water supply (mm/season) | Water demand (mm/season) | Irrigation supply (mm/season) | Irrigation demand (mm/season) | RWS | RIS |
| 292.2 | 317.4 | 151.3 | 183.6 | 0.92 | 0.83 |
Table 4. Estimated values of RWS and RIS.
Water delivery performance indicators
Adequacy: The spatial and temporal average values of adequacy in the selected nine off takes were computed at the head, middle, and tail reaches of the scheme for the study period. The estimated result of spatial and temporal adequacy was listed in Table 5. As shown from the result, the temporal adequacy of the irrigation scheme varied from 0.51 to 1.00 at the tail and head (some part middle) reach, which were grouped under poor and good performance based on Table 1 classification. The mean value of adequacy at tail reach was 0.51, 0.56, and 0.57 at T3, T2, and T1 sequentially. All measured values of adequacy at tail reach were grouped under poor performance. The mean adequacy of the tail, middle, and head reach of the study area was 0.55, 0.95, and 0.95, respectively, which lay under poor, good, and good performance, respectively. The reasons behind the poor performance level of tail reach were the malfunction of the control structure and inefficient conveyance structure, distance from the water source that resulted in high conveyance losses, and inadequate availability of water to irrigate the tail reach field. Based on Table 1 classification, the performance levels of the head and middle reach were grouped under "good performance" and the tail reach was placed under "poor performance. Based on Table 1 classification, the overall performance of the irrigation scheme based on the adequacy indicator was grouped under the fair class.
| Month | Head reach | Middle reach | Tail reach | Mean | ||||||
| H1 | H2 | H3 | M1 | M2 | M3 | T1 | T2 | T3 | ||
| February | 1.00 | 1.00 | 1.00 | 1.00 | 1.00 | 1.00 | 0.62 | 0.54 | 0.59 | 0.86 |
| March | 1.00 | 1.00 | 1.00 | 1.00 | 0.92 | 0.87 | 0.40 | 0.47 | 0.30 | 0.77 |
| April | 1.00 | 1.00 | 1.00 | 1.00 | 1.00 | 1.00 | 0.57 | 0.57 | 0.41 | 0.84 |
| May | 1.00 | 1.00 | 1.00 | 0.94 | 0.79 | 0.88 | 0.67 | 0.66 | 0.71 | 0.85 |
| Mean | 1.00 | 1.00 | 1.00 | 0.99 | 0.93 | 0.94 | 0.57 | 0.56 | 0.51 | |
| Spatial mean PA | 1.00 | 0.95 | 0.55 | 0.83 | ||||||
Table 5. Estimated value of temporal and spatial adequacy.
Efficiency: The temporal and spatial efficiency of the irrigation scheme for nine off takes and one irrigation period were estimated. The average estimated value is presented in Table 6. Efficiency at the tail, middle, and head of reach was 1.00, 0.89, and 0.82, which was grouped under the class of good, good, and fair performance respectively. Efficiency was higher at all tail reaches off gates and lower at all head reaches and M1, H1, and H1, with values of 0.81, 0.80, 0.86, and 0.71 for H1, H2, H3 and M1 off gates, respectively. The overall average value efficiency of the irrigation scheme was 0.91, which was grouped under good performance based on Table 1 classification.
| Month | Head reach | Middle reach | Tail reach | Temporal mean of PF |
||||||
| H1 | H2 | H3 | M1 | M2 | M3 | T1 | T2 | T3 | ||
| February | 0.73 | 0.72 | 0.67 | 0.57 | 0.97 | 0.97 | 1.001 | 1.001 | 1.001 | 0.85 |
| March | 0.86 | 0.86 | 1.001 | 0.68 | 1.001 | 1.001 | 1.001 | 1.001 | 1.001 | 0.93 |
| April | 0.97 | 0.88 | 1.001 | 0.6 | 0.97 | 0.96 | 1.001 | 1.001 | 1.001 | 0.93 |
| May | 0.67 | 0.72 | 0.78 | 1.001 | 1.001 | 1.001 | 1.001 | 1.001 | 1.001 | 0.91 |
| Mean | 0.81 | 0.8 | 0.86 | 0.71 | 0.99 | 0.98 | 1.001 | 1.001 | 1.001 | |
| Spatial mean PF | 0.82 | 0.89 | 1.001 | 0.91 | ||||||
Table 6. Estimated value of efficiency.
Equity: The spatial coefficient of variation equity of the irrigation scheme during February, March, April, and May was 0.23, 0.09, 0.06, and 0.08, respectively. The variation in CVR during April was less compared to other months that the water users get water fairly due to the high availability of water at the source. The other reason was that during February, all water users wanted irrigation water with high computation for sowing and planting of growing crops, which resulted in poor equity of water distribution (Figure 4). Generally, the overall spatial coefficient of variation was 0.11, and the irrigation scheme was grouped under fair performance based on Table 1 classification.

Figure 4. CVR for study months.
Dependability: From the estimated result, the minimum and maximum coefficient of variation were observed at all head reach off gates and tail reach off gates (T3) with values of 0.00 and 0.63, respectively. The average estimated values of the coefficient of variation at the tail, middle, and head reach off gate were 0.39, 0.11, and 0.01 respectively. The reason behind the variations in the results at head and reach is that the water users have got water based on their needs since their land was clothed to a water source and the water can reach their land with minimum conveyance loss. But the tail reach users didn’t get water due to unfair water distribution, and the flow was exposed to different losses through conveyance. The average overall temporal coefficient of variation of the selected off gate was 0.18, which is grouped under fair performance based on Table 1 classification (Figure 5 and Table 7).

Figure 5. Temporal Coefficient of Variation (CVT).
| No. | Performance indicator | Average value | Class |
| 1 | Adequacy | 0.83 | Fair |
| 2 | Efficiency | 0.91 | Good |
| 3 | Equity | 0.11 | Fair |
| 4 | Dependability | 0.18 | Fair |
Table 7. Result and class of delivery performance indicators of Kelina irrigation scheme.
Evaluation of conveyance efficiency and water loses
Main canal water conveyance efficiency and losses: The measured average value of inflow, outflow, and estimated result of conveyance efficiency were presented in Table 8. The conveyance loss of the main canal varied from section to section and reach to reach. For the 420-600 m and 1350-1480 m away from the headwork, the estimated value ranged from 1.17% to 34.48%. The mean value of conveyance loss for the tail, middle, and head reach was 17.75%, 4.48%, and 10.00%, respectively. The overall value of the conveyance loss on the main canal was 10.74%. The overall mean value of the conveyance efficiency of the lined main canal was 89.26 percent, which is less than the Table 2 recommended value of 95% for lined canals due to effect of sedimentation, excessive vegetation growth, improper cleaning of the conveyance system (Table 8 and Figure 6).
| Canal reach | Canal section | QI (l/s) | QO (l/s) | Ec (%) | El (%) |
| Intake outlet | 38.22 | 34.3 | 90.26 | 9.74 | |
| Head reach | 0-150 m | 34.31 | 30.53 | 88.98 | 11.02 |
| 150-300 m | 30.53 | 26.44 | 86.6 | 13.4 | |
| 300-420 m | 26.44 | 24.89 | 94.14 | 5.86 | |
| Mean | 90 | 10 | |||
| Middle reach | 420-600 m | 24.89 | 24.6 | 98.83 | 1.17 |
| 600-750 m | 24.60 | 22.81 | 92.72 | 7.28 | |
| 750-930 m | 22.81 | 21.68 | 95.05 | 4.95 | |
| 930-1010 m | 21.68 | 20.7 | 95.48 | 4.52 | |
| Mean | 95.52 | 4.48 | |||
| Tail reach | 1010-1200 m | 20.7 | 19.28 | 93.14 | 6.86 |
| 1200-1350 m | 19.28 | 18.24 | 94.61 | 5.39 | |
| 1350-1480 m | 18.24 | 11.95 | 65.52 | 34.48 | |
| 1480-1650 m | 11.95 | 9.05 | 75.73 | 24.27 | |
| Mean | 82.25 | 17.75 | |||
| Overall mean | 89.26 | 10.74 | |||
Table 8. Conveyance efficiency and loss of main canal.

Figure 6. Reach wise variation of Ce and Cl for main canal.
Secondary canal conveyance efficiency and losses: The measured average values of outflow and inflow and the estimated mean values of conveyance efficiency and conveyance loss for different sections of lined and unlined secondary canals are shown in Tables 9 and 10. The water conveyance efficiency of the lined secondary canal ranged from 71.93% to 90.81%, with an average value of 83.2%. The lowest conveyance efficiency for lined secondary canals was estimated at a canal section 0-150 m from the main canal. The reason behind it is that at this section, the canal was highly cracked, broken by animals and affected by the accumulation of sediment. The second reason is that almost all the control structures in this section was malfunctioned. The water conveyance losses per the measured length of the canal also varied from 9.19% to 28.07%, with an average value of 16.8%. Therefore, routine maintenance will be required. Like the main canal, the average value of conveyance efficiency of the lined secondary canal was below the recommended value of Table 2 which was listed in poor status. Since the canal was highly affected by the high accumulation of sediment, highly cracking and excess vegetation growth, it required proper maintenance. The estimated values of conveyance efficiency and water loss of the unlined secondary canal varied from 60.86% to 88.12%, with an average value of 78.53%. The water conveyance loss per the measured distance of the canal varied from 11.88% to 39.14% with an average value of 21.47%. The lowest conveyance efficiency was estimated at a canal section 600-750 m from the main canal. Two reasons were observed in this section. The first reason was that this section of canal was exposed to excessive lateral seepage and was heavily covered with grass, and the second reason was that it was highly filled with sediment (Tables 9 and 10).
| Canal section | QI (l/s) | QO (l/s) | Ec (%) | Cl (%) |
| 0-150 m | 30.38 | 21.85 | 71.93 | 28.07 |
| 150-300 m | 21.85 | 17.88 | 81.85 | 18.15 |
| 300-450 m | 17.88 | 15.55 | 86.98 | 13.02 |
| 450-600 m | 15.55 | 12.52 | 80.54 | 19.46 |
| 600-750 m | 12.52 | 11.27 | 90.03 | 9.97 |
| 750-900 | 11.27 | 9.04 | 80.24 | 19.76 |
| 900-1020 | 9.04 | 8.21 | 90.81 | 9.19 |
| Mean | 83.20 | 16.8 |
Table 9. Measured and estimated value of QO, QI, Ce and Cl for lined Sc.
| Canal section | QI (l/s) | QO (l/s) | Ce (%) | Cl (%) |
| 0-150 m | 19.27 | 15 | 77.84 | 22.16 |
| 150-300 m | 15 | 10.74 | 71.60 | 28.40 |
| 300-450 m | 10.74 | 8.92 | 83.05 | 16.95 |
| 450-600 m | 8.92 | 7.46 | 83.63 | 16.37 |
| 600-750 m | 7.46 | 4.54 | 60.86 | 39.14 |
| 750-900 | 4.54 | 3.84 | 84.58 | 15.42 |
| 900-1020 | 4.63 | 4.08 | 88.12 | 11.88 |
| Mean | 78.53 | 21.47 |
Table 10. Measured and estimated value of QO, QI, Ce and Cl for unlined Sc.
Maintenance performance indicators
The maintenance indicators of the irrigation scheme were evaluated in terms of water surface elevation and the effectiveness of the infrastructure.
Water Surface Elevation Ratio (WSER): To evaluate the impact of sedimentation, weed and erosion problems on the canal, measurements of the current depth of the main canal were performed from different reaches with intervals of 50 m. The water surface elevation was estimated with equation 3.23 and the result is presented in Table 11 and the detailed estimation of WSER was listed. The estimated value of the water surface elevation ratio was 0.94, 0.91, and 0.89 for the head, middle, and tail reaches of the canal, respectively. The overall water surface elevation ratio was 0.91. The depth of canal was reduced from the design depth since the water surface elevation ratio is less than one. The result indicated that 9% of the depth of the canal was reduced from the intended depth by sedimentation and the canal was highly covered by vegetation.
| Reach | Head | Middle | Tail | |||
| DWSE | WSER | DWSE | WSER | DWSE | WSER | |
| Mean value | 0.12 | 0.94 | 0.09 | 0.91 | 0.13 | 0.89 |
| Overall mean of WSER | 0.91 | |||||
| Overall mean of DWSE | 0.11 | |||||
Table 11. Estimated value of water surface elevation ratio.
Effectiveness of infrastructure: The total number of infrastructures built on the site was 128 and the number of currently operational infrastructures was 72. The estimated value of infrastructure was 56.25%, which means that the other 44.75% of the constructed infrastructure was collapsed and deteriorated. The cause of the malfunction of the structures was a lack of required and timely maintenance, and some structures disappeared or were stolen from the site, like gates. Therefore, maintenance of the infrastructure and making sense of ownership by the users has to be done accordingly.
Physical (Area) based performance indicator
The physical (area)-based performance indicator relates to the change in area coverage of irrigation. This performance was assessed with two indicators: Irrigation ratio and sustainability of land.
Irrigation ratio: The variables that were used to estimate the irrigation ratio were the scheme irrigable area and the currently irrigated area. From the design document, the scheme irrigable area was 113 ha and the initial irrigated area was 100 ha. The current irrigated area is 91.3 ha. Therefore, the irrigation ratio of the irrigation scheme was 80.8%, meaning that 80.8% of the irrigable area was currently irrigated and the rest of 19.2% was not under irrigation during the study period. The basic reason that limited the potential of the irrigated land to be non-irrigated was shortages of water at the source.
Sustainability of irrigated area: The result of SI was 0.91, meaning that 91% of the intended irrigated land was irrigated currently. The rest of 9% is not currently irrigated because of a shortage of water availability, especially at tail reach. In some parts, portions of the irrigable land were eroded and covered by stone and sediment that arise from high flooding from a nearby river (Table 12).
| Irrigable area (ha) | Intended irrigated area (ha) | Currently irrigated area (ha) | IR | SI |
| 113 | 100 | 91.3 | 0.81 | 0.91 |
Table 12. Estimated values of IR and SI.
The hydraulic performance evaluation of Kelina small scale irrigation was carried out at the head, middle, and tail reach of the irrigated area for one irrigation season starting from February to May 2022. The scheme was evaluated with relation to water supply and demand.
Water delivery performance, conveyance and on farm-water application efficiency, maintenance requirement indicators, and physical (area) based performance indicators. The primary data points that were used were taken by direct observation and field measurement, like discharge measurement, canal dimension measurement, applied water measurement, and some data that required further laboratory analysis, like soil physical properties. Based on the results obtained, the supply of water for irrigation does not meet the crop water requirement due to a water shortage at the source. The estimated values of relative water supply and relative irrigation supply that were used to compare water supply and demand were 0.92 and 0.83, respectively. Since the estimated ratio of water supply to crop water demand was less than one, the supply was less than the demand that indicate the diverted water is not adequate to satisfy the crop water demand. The water delivery performance indicators varied temporally and spatially. Based on the results that were obtained during evaluation, the overall adequacy, equity, and dependability were 0.83, 0.11, and 0.18 grouped under fair performance, and efficiency was 0.91, which was graded under good class. Besides fair classification, there were problems that occurred through sedimentation, unfair distribution of water, flow control, and other distribution systems.
The conveyance efficiency of the main canal and two secondary (one lined and one unlined) canals was evaluated based on the measured inflow and outflow. The overall estimated values of the main canal, lined secondary canal, and unlined secondary canal were 89.26, 83.20, and 78.53%, respectively. The major reasons for minimum conveyance efficiency were sedimentation of the canal, absence and malfunctioning of structures, lack of proper and timely maintenance, high density vegetation growth inside the canal, and lack of ownership of the installed and constructed infrastructure by the users.
Concerning the maintenance requirement, the performance of the scheme was so poor that the current canal depth was reduced by 9% from the intended depth and the amount of infrastructure constructed initially was reduced and malfunctioned on time. Regarding the physical (area) based performance of the scheme, the irrigated area was reduced by 9% from the initial irrigated area due to water shortages, especially at the tail of the area.
Irrigation & Drainage Systems Engineering received 835 citations as per Google Scholar report


