Research Article - (2025) Volume 15, Issue 3
Received: 10-May-2024, Manuscript No. JCDE-24-134662;
Editor assigned: 14-May-2024, Pre QC No. JCDE-24-134662 (PQ);
Reviewed: 28-May-2024, QC No. JCDE-24-134662;
Revised: 12-May-2025, Manuscript No. JCDE-24-134662 (R);
Published:
19-May-2025
, DOI: 10.37421/2165-784X.2025.15.587
Citation: Demamu, Masresha T. "Hydraulic Modeling and Flood
Mapping of Flood Plain along Megech River, Upper Blue Nile Basin, Ethiopia."
J Civil Environ Eng 15 (2025): 587.
Copyright: © 2025 Demamu MT. This is an open-access article distributed under the terms of the creative commons attribution license which permits unrestricted use, distribution and reproduction in any medium, provided the original author and source are credited.
Every year, devastating floods occur in numerous places around the world. Floods are also a daily occurrence in Ethiopia, wreaking havoc and claiming lives, especially in low-lying areas such as cities. The Dembia floodplain is one of the most flood-prone districts in Ethiopia. Most victims of flood disasters are people who live in rural areas and make their living from agriculture and livestock near a floodplain. Due to the flooding on the Megech River in Ethiopia, the focus of the study was on hydraulic modeling and flood mapping. Combining the technologies HEC-HMS, HEC-GeoHMS, HEC-RAS and ArcGIS to create a regional model for floodplain identification and representation resulted in floodplain mapping. Using daily time series data, the hydrologic model HEC-HMS was calibrated for return periods of 2, 10, 25, 50 and 100 years. The model HEC-HMS provides 139.7 m3s-1, 228.2 m3s-1, 369.7 m3s-1, 437.8 m3s-1 and 568.8 m3s-1 for return periods of 2, 10, 25, 50, and 100, respectively. A one-dimensional hydraulic model, HEC-RAS, with the HEC-GeoRAS tool extension in ArcGIS was used for flood mapping. The inundation mapping results in 19.92 km2, 23.76 km2, 25.32 km2, 28.65 km2 and 30.09 km2 of inundation area for return periods of 2, 10, 25, 50 and 100, respectively. According to the study, floods have significant impacts as they inundate agricultural and pastoral lands, which has a direct negative impact on of the society. Moreover, flood hazards were evaluated based on the return period and water depth. Therefore, central and local governments should introduce appropriate policies and measures to address this problem.
Flood mapping • HEC-HMS • Flood damage • HEC-RAS • Flood inundation
Background of the study
Floods are one of nature's most common and devastating tragedies, destroying people's lives, finances and livelihoods. Devastating floods claim millions of lives and leave enormous property damage each year. For developing and underdeveloped countries, the situation is even more dangerous. Modeling and delineation of floods with one- and twodimensional (1D and 2D) models enhances our understanding of river hygrometry, hydrostatics and hydrodynamics [1].
Floods have destroyed human lives and communal and environmental assets. Climate change and increasing humaninduced land use changes are stressing river channels and altering river morphology, making floods more severe and frequent. Longterm flood forecasting, early warning and control measures could therefore be implemented [2].
Professionals, developers and organizations use flood mapping as a dynamic tool for metropolitan planning and urban development, safeguards, flood insurance rates, environmental studies and other purposes. By considering the extent of overflow and flooding, the management team can make decisions about how best to allocate resources to prepare for emergencies and generally improve the quality of life in the floodplain.
Climate change, land degradation and rapid population growth exacerbate flooding, leading to harm to individuals and destruction of property. Grasping flood risk reduction techniques can alleviate these impacts. One such approach involves deliberately flooding areas known to be at risk. This is often determined through flood mapping, which identifies regions along a river that are susceptible to flooding when the river's water level exceeds its banks [3].
Statement of the problem
Floods frequently occur in Ethiopia, leading to significant loss of life and property, particularly in lowland regions and urban areas. One flood-prone area is located downstream of the Megech River in the Dembia floodplain. By flooding in 2010, 9200 people are affected and 4300 people are displaced in Dembia woreda.
Objectives of the study
The overall objective of this study is to identify the floodplains in the Megech River basin and to analyze the flood hazards along the Megech River [4].
Significances of the study
This study is expected to be helpful for the planners, decisionmakers and any concerned bodies to understand the consequences of floods on hydrological variables and the impacts. The downstream of the study area is one of the flood-prone areas in the Dembia and Gondar Zuria flood plain. Thus, the decision-maker should be accountable for this hydrological phenomenon while formulating policy regarding the area [5].
Description of the research area
The Megech River basin is one of the sub-basins of Lake Tana and is located in the northern part of the lake. The watershed is located between 12°18'0" and 12°45'0" north latitude and 37°20'0" and 37°40'0" east longitude. The Megech River flows south from north Gondar in the Gondar administrative area through the Dembia flood plain to Lake Tana. It has a total catchment area of 706.8 km2, of which 195 km2 is in the Dembia flood plain. The Megech is one of the four perennial rivers that feed Lake Tana (Gilgil Abbay, Megech, Ribb and Gumera). As shown in Figure 1, the Dembia floodplain is located in the northern Gondar zone of the Amharic region of Ethiopia. The overall topography of the Megech River study area is sufficiently flat. The soils are predominantly black cotton soil, and the floodplains are also intensively used for agriculture. People use the water from these rivers to grow fruits, vegetables and crops. During the rainy season, the Dembia floodplain is inundated by the Megech River [6].

Figure 1. The study area's location.
Data collection and analysis
Primary and secondary data were used for this study. Interviews and conversations with elderly residents were conducted to collect the primary data [7]. These people know when and where the river overflowed its banks and what hazards occurred, while the secondary data were collected from different institutions, as shown in Table 1.
| The data type | Data period | Resolution |
| Digital Elevation Model (DEM) | 2016 | 12.5 m × 12.5 m |
| Megech river discharge | 2000-2014 | Daily |
| Cross-section of the Megech River | _ | _ |
| Rainfall near meteorological stations | 2000-2014 | Daily |
Table 1. Data collection and its sources.
Methodology of research
The overall model consists of components: A Hydrologic Model (HEC-HMS), a Hydraulic Model (HEC-RAS), a floodplain mapping and visualization tool and the extraction of geospatial data for use in the model. HEC-HMS is hydrologic modeling software used to estimate peak discharges and discharge hydrographs for various return periods at different outfall locations in the watershed [8]. The watershed model includes a schema that may consist of any of the following combinations: Subcatchment, Range, Crossing, Source, Sink and Reservoir). In HEC-HMS, each component of the runoff process has its own model; including runoff volume models, direct runoff models and baseflow models. Each model run combines a watershed model, a meteorological model and control specifications (Figure 2).

Figure 2. Conceptual frameworks of methodology.
The main input data for HEC-HMS are actual precipitation, actual runoff, baseflow and various basin characteristics obtained from HEC-GeoHMS. The three components of the HEC-HMS simulation are the catchment model, the meteorological model and the control specifications. The first section deals with the day-to-day modeling. Therefore, the following modeling approaches based on daily data use the results from HEC-HMS via the gage weight method and the storm frequency method. Using the refined DEM, physical properties were calculated for each of the sub-basins and rivers [9]. River length and width were calculated. River length and slope were calculated for the rivers, as well as watershed slope, longest flow path to the watershed, center of gravity of the watershed, elevation of the center of gravity and longest flow path of the center of gravity (Figure 3 and Table 2).

Figure 3. HEC-GeoHMS watershed characteristics were imported.
| Model | Method used | Parameter | Maximum | Minimum |
| Transform | Clark unit hydrograph | Time of concentration | 500 hr | 0.1 hr |
| Storage coefficient | 150 hr | 0 hr | ||
| Loss | Initial and constant | Initial loss | 500 mm | 0 mm |
| Loss rate | Constant loss rate | 300 mm/hr | 0 mm/hr | |
| Baseflow | Recession | Initial discharge | 100000 m3/s | 0 m3/s |
| Recession constant | 1 | 0.00001 | ||
| Routing | Muskingum | Muskingum-K | 150 hr | 0.1 hr |
| Muskingum-X | 0.5 | 0 |
Table 2. The Megech River HEC-HMS model's basin parameters and constraints.
Validation and calibration of models
It is a methodical process of adjusting model parameter values until model results agree with observed data. Nash Sutcliffe and HEC-HMS are able to perform automated calibration to maximize a given target function coefficient of determination. The manual calibration method was used in this study to determine a practical range of parameter values while maintaining the shape of the hydrograph and minimizing the error in peak discharges and volumes. Calibration was performed using the initial parameters and the calibration was then edited until the simulated value matched the observed data. A total of 15 years of historical data from 2000 to 2014 were used, with calibration (2000-2009) shown in Figure 4 and validation (2010-2014) shown in Figure 5 for the selected sub-basin watersheds [10].
Evaluation of model efficiency
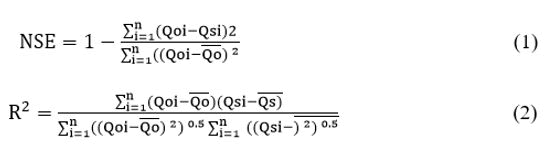
Hydrologic model performance evaluation is commonly used to determine the ability of the model to provide accurate results by comparing simulated and observed variables. The performance and behavior of a hydrologic model have been evaluated by comparing observed and simulated variables. In most cases, measured and simulated flows are compared. Therefore, model performance in simulating observed flow was estimated during calibration and validation for this study by visually inspecting the simulated and observed flow plots and calculating the commonly used efficiency criteria. Nash and Sutcliffe NSE coefficient of determination (R2) efficiency criteria [11]. NSE can range from - to 1, where 1 indicates a perfect match between observed and simulated discharges. NSE values between 0.9 and 1 indicate that the model performs very well, while values between 0.6 and 0.8 indicate that the model performs well (Table 3).
Where: Qoi=observed discharge
¯Qo=mean of observed discharge
Qsi=simulated discharge
¯Qs=mean of simulated discharge
| Megech catchment model performances | Year of simulation | Nash-Sutcliffe Efficiency (NSE) in % | Coefficient of determination R2 (%) |
| Calibration | (2000-2009) | 71.9 | 79 |
| Validation | (2010-2014) | 72.5 | 84.5 |
Table 3. Model performance indicators for the calibration and validation year.
The primary data source for GeoRAS is terrain data, also known as "Triangular Irregular Network" (TIN). They are raster-based and can be viewed using ArcGIS 10.4.1. The resolution or cell size of this data determines its quality. The higher the resolution and accuracy, the smaller the cell size. Therefore, to investigate the utility of a DEM for terrain model development, the cell size and hydraulic evaluation level were determined. The larger the available cell size, the more accurate the analysis. ArcGIS is used to create the TIN, which is composed of point elevations from various sources.
ArcGIS is used to convert the point elevations into shape files for the layers. When these shape files are created, meandering points with missing data are added for further processing through successive interpolation and additional field surveys. Previous work was done using DEM 90 × 90. However, this would not provide the desired results. In this study, a DEM of 12.5 × 12.5 m with high resolution and accuracy is used to create TIN. Due to the availability of field data covering most of the stream and floodplain, TIN, which represents the entire floodplain, is also created with high accuracy. Floodplain values obtained during the actual field survey of the stream channel were represented by elevation values derived from the digital elevation model. Using the Arc-GIS triangulation method, a water surface TIN was created for each selected water surface profile based on the water surface elevation at each cross section. The intersection lines of the cross sections and the outer points of the bounding box were connected. Hydraulic analysis of the river system was performed using HEC-RAS and HEC-GeoRAS, an ArcGIS extension [12].
Entering flow information and boundary conditions
Flows are usually defined at the headwaters of each river/tributary and at the confluence. In HEC-RAS, each river to be simulated is called a profile. In HEC-RAS, there are several methods for determining flow data conditions. There are two types of flow conditions: Steady flow and unsteady flow. In this work, a steady flow method was used. The model HEC-RAS also contains several boundary conditions. The critical depth at the downstream end of the section was used in this study. In this one-dimensional steady-state flow analysis, the flow calibrated in HEC-HMS is used for five flood periods of 2, 10, 25, 50 and 100 years. The flood discharge values for the different return periods were entered manually.
Manning roughness coefficients (Manning coefficient) and boundary conditions were manually applied to the model. In this study, Manning roughness coefficient values were determined using the Manning roughness coefficient selection guide for natural channels and floodplains. Values of 0.03 and 0.04 were assigned. to the Megech River and its overflow banks or floodplains [13].
HEC-RAS calibration and validation
Model calibration involves outlining the ideal principles of model factors that result in the smallest possible deviation between actual and simulated values. Due to the accessibility of the values, the main factor was adjusted with the roughness coefficient of the surface. Model validation is a method of analyzing the ability of the model to simulate with standard accuracy measurement data other than those used for calibration.
Calibration was always done by hand to improve factor values, starting with the specified initial values and continuing until the simulated variable matched the observed one. Calibration was assessed using a graphical explanation and other statistical methods. Calibration and validation were performed for this study using GPS coordinate points specifying a historic floodplain, information from older locals and satellite overlays of floodplains.
Delineation of flood plains using ArcGIS
A DEM is a Three-Dimensional (3D) representation of the surface of a terrain created from elevation data. It can be either a raster or a vector-based TIN. The DEM is usually created using remote sensing data, but can also be created using land surveys. These data are needed to calculate the 2D river basin. Based on the underlying terrain used in the modeling process, each cell and cell area of the computational mesh of the 2D river basin is preprocessed to develop the detailed hydraulic property tables.
The DEM created the TIN, which is used to extract river cross sections, river centerlines, shorelines, flow lines and other river geometry for the HEC-GeoRAS model. At the same time, land use/ land cover was managed to obtain the Manning's n value for each cross section. After preparing the River Analysis System geometry data (RAS), the HEC-GeoRAS model was used to create the River Analysis System-Geographic Information System (RASGIS) import file, which was then used as input to HEC-RAS.
The goal of the HEC-GeoRAS research was to increase the spatial data needed to create HEC-RAS-import files with a 3D stream system and 3D cross sections. The technique was distributed in three steps: First, training polyline themes labeling river centerlines, riverbanks, flow trace lines and cross sections; second, using HEC-GeoRAS; and third, distributing the technique. The Pre-RAS menu extracts 3D spatial data from TIN to create 3D polyline themes of the previously clarified river centerline, stream banks, flow path lines, and cross sections; and third, a grouping of the HEC-RAS imported files. The RAS themes served as the basis for excluding geometric data in the GIS for HE-CRAS hydraulic investigation. River centerlines, banks, flow paths, centerlines and cross-section lines are all included in these refrains.
The three-dimensional details were then computed and visualized in the system. The inundation map was created and displayed using surface profiles fed back into the system GIS/ArcView HEC-GeoRAS. River system diagram and cross section data (cross section surface line, cross section main channel bank stations, river, reach and river station designations, river, reach and river station designations, river, cross section section lines (X and Y coordinates of plan view line designating cross section) Downstream reach lengths for left overbank, main channel and right over bank.
Hydrological simulation
HEC-HMS the model calibration performed at the lower gauging stations shows good agreement with NSE values of 71.9% and 79%, respectively and R2 values for the Megech watersheds. Model validation also shows good agreement with NSE values of 72% and 84%, respectively and R2 values for the Megech watersheds, as described in (Table 3 and Figures 4 and 5).

Figure 4. Actual and simulated discharge during the calibration period (2000-2009).

Figure 5. Actual and simulated discharge during validation (2010- 2014) year.
The frequency storm method uses statistical precipitation data to generate a synthetic storm. The frequency storm generates peak discharges for different return periods using statistical precipitation data. The model output of the frequency storm method from HECHMS is in. This output is used as the well-calibrated peak streamflow in the HEC-RAS model because there is no need to calibrate the discharge data in the HEC-RAS model once it is calibrated in the HEC-HMS model. Peak discharge was determined for return periods of 2, 10, 25, 50 and 100 and was 39.7 m3s-1, 228.27 m3s-1, 369.77 m3s-1, 437.87 m3s-1 and 568.87 m3s-1, respectively (Figure 6).

Figure 6. Megech River peak flow hydrographs at 2, 10, 25, 50 and 100 years.
Mapping and delineation of flood inundation
When exporting an ArcMap Geodataset to HEC-RAS, the right and left banks of a river were modified and named accurately. The right and left banks were matched in Arc-Map with the HEC GeoRAS extension, which did not match the actual right and left banks. The solution to these problems was to use a cross-section editor in HECRAS and manually select the right and left banks based on crosssection geometries. After using the correct steady-state flow analysis geometry to route flows of 39.7 m3s-1, 228.27 m3s-1, 369.77 m3s-1, 437.87 m3s-1 and 568.87 m3s-1 through a stream, the steady-state flow analysis was formed from water surface profiles. With these two data sets, flow and topography, in appropriate form, the resulting model efficiency is high. The model provides a two-dimensional view of the water surface profile of the floodplain. According to the flood plan, the area was delineated as a buffer zone, as shown in Figure 7. Floodplains are created when the height of the flood exceeds the height of the land. Surface flooding and land surface elevations were used to delineate these areas. The floodplains were shown as a calculated area in HEC-RAS. These elevations, as well as the distances from the stream centerline to the left and right floodplain boundaries, were imported into the GIS software during data import.

Figure 7. HEC-RAS 3D flood plain and channel perspective (100- year peak flood).
Five flow regimes were studied and mapped with Arc-Map to create floodplain maps along the Megech River. Floodplains were mapped with specific shapefile features to provide a thorough examination of floodplains and affected areas. The extent of the floodplains was also 1.5 km, with 0.6 km on each side.
Flood-affected areas
According to the results of this study, two woredas in the central Gondar zone were affected by flooding. The Dembia and Gondar Zuria woredas are examples of these. Eight kebeles in Dembia were inundated by floods, while three kebeles in Gondar Zuria were inundated. For each of the modeled flood events, vulnerability maps were created for the flooded areas by intersecting the floodplain land use map with the floodplain polygon. This model shows the aspect of vulnerability to flood risk in a given area in relation to flooding during a given return period. According to the analysis, 90%, 5.17%, 2.25% and 2.76% of the floodplain are covered by cropland and 0.83 km2 and 0.83 km2 are covered by cropland, grassland and aquatic and shrubland, respectively, which means that the extent of the area increases as the flood intensity increases. The vast majority of irradiated land around the floodplain is cropland, with a smaller percentage of shrubland, wetlands and pasture. Nearly 90% of the flooded land is agricultural or cropland. The remaining 10% is in agricultural and pastoral use near the confluence of Lake Tana (Tables 4 and 5).
| Flooded kebeles Dembia woreda | 2 year inundated area (Ha) | 10 year inundated area (Ha) | 25 year inundated area (Ha) | 50 year inundated area (Ha) | 100 year inundated area (Ha) |
| Sufan Gubia | 38.6 | 54.3 | 56.4 | 62.5 | 86.2 |
| Wekerako | 305 | 412.1 | 485.2 | 534.08 | 601.8 |
| Guramba Jankra | 198.6 | 317 | 327.4 | 398.02 | 417.05 |
| Arebia Dibatsge | 135 | 265.4 | 289.4 | 312.5 | 319.05 |
| Seraba Dablo | 83.7 | 98.4 | 108.4 | 121.3 | 139 |
| Achera | 405.8 | 454.08 | 495.8 | 516.5 | 587.5 |
| Debirzuria | 327.9 | 574.2 | 584.4 | 598.5 | 615.8 |
| Guramba Bantana | 18.6 | 28.5 | 47.5 | 96.6 | 128.05 |
| Total Area(km2) | 18.6 | 22.04 | 23.43 | 26.4 | 28.94 |
Table 4. Dembia kebeles flood has inundated an area with a variable return period.
|
Kebeles flooded |
2-year flooded area (Ha) |
10-year flooded area (Ha) |
25-year flooded area (Ha) |
50-year flooded area (Ha |
100-year flooded area (Ha) |
|
Minyicher |
31.2 |
37.8 |
39.7 |
45.6 |
50.5 |
|
Tachetabriha |
31.8 |
35.7 |
45.8 |
58.2 |
62.9 |
|
Hamasafe wana |
68.4 |
89.5 |
93.5 |
121.7 |
125 |
|
Total area (km2) |
1.314 |
1.63 |
1.79 |
2.25 |
2.38 |
Table 5. The flood inundated the Gondar Zuria kebeles area.
With limited river, geometric, topographic and hydrologic data available in developing countries such as Ethiopia, hydraulic models and GIS are of limited use for floodplain analysis and risk mapping. River flooding in Ethiopia is also quite different from other countries where floods, flows and rivers are completely unregulated. Flood control structures on riverbanks, such as dikes and levees, are inadequate and boundary lines need to be clarified.
The flood discharge for different return periods is calculated by a different method. In this work, the result of the model HEC-HMS is considered representative of the correct discharge value. According to the model results, even with a flood discharge from a 2-year storm, significant flooding occurs in the area. For a 100-year storm, the flood depths and extents range from 0.0002 to 3.26 m. The flood risk and hazard maps show that cropland, agricultural land and rivers with large water depth and area are at high risk. These are the most floodprone areas in the floodplains, so additional flood protection measures are needed.
This study identified the flood-prone areas of Debrezuria, Wekerako, Achara, Guramba Jankara, Arabia Dibatsge, Seraba dablo, Guramba Bantana and Sufan Gubia, which have corresponding flood susceptibility of 21.3%, 20.8%, 20.3%, 14.4% and 11.04%, respectively. Flood discharge during a 100-year storm was 4.8%, 4.4% and 3%, respectively. Three kebeles in Gondar Zuria were affected by flooding, with Hamasafe Kebele being the most affected, followed by Mincher and Tachetabriha.
Selmon Fikadu research investigated flood risk mapping and vulnerability analysis in the Dembia floodplain using 2D hydrodynamic modeling. The main strengths of the research are that the 2D flow is dynamically simulated without specifying flow patterns; there is flexibility in adjusting the grid resolution within the model; and there is detailed information on velocity, depths and other floodplain parameters. Raw streamflow data that had not yet been calibrated or refined to high resolution were used for this study. Despite the use of a one-dimensional model, the best aspect of our research is that one-dimensional discharge is accurate for hydraulic description of rivers and channels and can be easily analyzed and results extracted. In addition, we used calibrated and validated discharges and identified flood-prone areas down to the kebele level.
The numerical models ID HEC-RAS, HEC-HMS, HEC-GeoHMS, HEC-GeoRAS and Arc GIS 10.4.1 extension was used for flood modeling of the Megech River in this study. The floodplain map was created by arranging and processing geometric input data from DEM using HEC-GeoRAS. Using daily time series data, the hydrologic model HEC-HMS was calibrated for return periods of 2, 10, 25, 50 and 100 years. For return periods of 2, 10, 25, 50 and 100 years, the model HEC-HMS produces 139.7 m3s-1, 228.2 m3s-1, 369.7 m3s-1, 437.8 m3s-1 and 568.8 m3s-1, respectively. Flood mapping results in 19.92 km2, 23.76 km2, 25.32 km2, 28.65 km2 and 30.09 km2 floodplain for return periods of 2, 10, 25, 50 and 100, respectively.
The inundated area was the largest in all other return periods because the runoff was greater in the 100-day return period. Due to the increased discharge in the 100-day return period, almost a large portion of the lower reaches of the river were inundated with a high flood depth that decreased from upstream to downstream, according to the model results presented in the results. The flood depth was large, reaching 3.26 meters and the impact on life and property was severe. According to the study, floods have a significant impact on the socio-economic standard of the society because they inundate agricultural and pastoral lands. The land use pattern in the flooded areas was assessed in terms of flood risk and vulnerability. Flood hazards were also evaluated in the study in terms of return period and water depth. Even with a two-year storm, floods inundate Dembia and Gondar Zuria Woreda. This shows the importance of constructing engineering structures such as levees, dams and even levees along the river channel and lower floodplain. Most topographic analyses performed using ArcGIS and field survey data are more efficient at accurately depicting the nature of the terrain. The more accurate the flood map, the higher the resolution of DEM and the more topographic data available. In this study, a high resolution (12.5 m × 12.5 m) of Dem is used, which enables the presentation of a more accurate hazard and risk map. Due to the extreme rainfall during the main rainy season, floods of great depth and large area occur in the low-lying areas along the croplands in Kebeles Achara, Wekerako, Debrizuria and Guramba. As a result, the central and local governments should develop appropriate measures and policies to address this problem in the future.
To prevent flooding and siltation caused by sediment deposition along the river course, river engineering measures such as the construction of dams, slope protection, dikes or other nonstructural measures are recommended. To reduce flood damage, areas inundated by the 100-year return period should not be used for agricultural activities, infrastructure development, settlements or other capital projects during the rainy season, as this would result in property and infrastructure damage. To reduce the extent of flooding, sediment transport and siltation, soil conservation measures should be implemented in both the upstream and downstream portions of the area. To reduce flood risk, efforts must also be made to implement effective land use planning in flood-prone areas. For flood emergencies, the government should raise public awareness and establish an emergency plan. Researchers and students should have access to qualitative and quantitative data from educational and research institutions to produce relevant problem-solving scientific research.
Journal of Civil and Environmental Engineering received 1798 citations as per Google Scholar report


