Mini Review - (2022) Volume 6, Issue 6
Received: 29-Sep-2022, Manuscript No. jeh-23-85844;
Editor assigned: 30-Sep-2022, Pre QC No. P-85844;
Reviewed: 14-Oct-2022, QC No. Q-85844;
Revised: 20-Oct-2022, Manuscript No. R-85844;
Published:
28-Oct-2022
, DOI: 10.37421/2684-4923.2022.6.183
Citation: Suh, Jangwon. “Hexavalent Chromium (Cr (VI)) and its Microbial Reduction Pose Risks to Health.” J Environ Hazard 6 (2022): 183.
Copyright: © 2022 Suh J. This is an open-access article distributed under the terms of the Creative Commons Attribution License, which permits unrestricted use, distribution, and reproduction in any medium, provided the original author and source are credited.
First, the area's most significant environmental threats were identified through questionnaire campaigns run by municipal employees. Hazard maps were created by utilizing a variety of environmental hazards indicators and concentrating on the threats that were primarily perceived by the region's residents, such as deforestation, water pollution and changes in precipitation. After a pair-wise comparison, a GIS environment was used to create an integrated hazard map. The proposed method can be scaled up for integrated environmental hazards analysis in similar regions of Latin America and the maps serve as a first baseline for the analysis of the current state of natural resources in the "Valles Cruceos" area.
Environmental • Environmental justice • Ethnicity
Terrace cultivation systems make extensive use of these fertile areas, but crops' root systems are less effective than those of forests and meadows. In addition, research reveals that upland rice cultivation systems, which are utilized in landslide-prone regions of Africa and Southeast Asia, still carry a high risk of landslides due to the timing of harvest and the soils' inability to withstand heavy rainfall from tilling practices. The development of systems that are capable of anticipating ENM interactions with biological systems and their overall impact on the environment and human health is crucial. Life-Cycle Assessment (LCA) tools have been used to investigate ENMs' potential impact on the environment up until this point, from the creation of raw materials to their final disposal. However, the environmental impact of in-place employment was not included in the LCA studies, which instead focused on the production phase's impact. Using ecotoxicological tools that enable the evaluation of potential risks posed by ENMs to natural ecosystems and wildlife, a recently developed eco-design framework sought to fill this knowledge gap [1,2].
Biosolids have been used in agriculture as soil conditioners and typically come from treated sewage sludge. Biosolids contained concentrations of CIP, OFL and NOR greater than 1,000 ng/g. The levels of antibiotics in biosolid and sewage sludge need to be monitored in WWTPs because they will be released into the environment if no other treatment process removes them.
The damage that can result from an accident in an industrial plant can be enormous. A considerable portion of the environment might be contaminated. Employees of the plant as well as residents of the surrounding area may sustain injuries. The following procedures are put into place to control major accidents: safety analysis, emergency and operational planning, effective land-use planning (LUP), a strategic environmental assessment (SEA), an environmental impact assessment (EIA) and public consultation are all examples of these types of planning.
In order to locate 41 indicators at the smallest Australian census unit, we adhere to the analytical framework and first utilize a variety of data sources. In the Supplementary, a detailed explanation of why these 41 indicators were chosen, as well as their concepts, metrics and hypothesized effect on vulnerability, is provided. We establish two measuring systems of vulnerability to the analytical framework for urban and rural areas, respectively and reforge the Cutter framework by incorporating the "4D" quantification of the built environment. We further classify our measures of vulnerability into five themes: theme 1 (socioeconomic status), theme 2 (demographics and disability), theme 3 (minority and languages), theme 4 (housing characteristics) and theme 5 (built environment), which was included in the Cutter's work6. These themes were used by the US Centers for Disease Control and Prevention (CDC) in their measures of vulnerability. These classifications steer clear of the ambiguous and ever-evolving definitions of vulnerability, sensitivity and exposure that were found to overlap or be contentious in early studies. In addition, we investigate the disparity in vulnerability between eight capital cities and their rural counterparts in the hazard-affected areas. Our findings provide quantitative evidence for place-based risk reduction and the viability of urban– rural development, as well as a profile of Australia's vulnerability [3].
The three natural hazards (fire, earthquake and flood)'s spatial patterns They follow very different patterns. The north of the Northern Territory, West Australia and Queensland are where wildfires are most common, but they also spread along the eastern coast of Queensland. In the south of New South Wales, Victoria and South Australia, as well as more widely in West Australia, earthquakes are most common. As the hydrological network, which includes rivers, streams and creeks, spreads across the entirety of Queensland and New South Wales, the northeast corner of South Australia and the north of West Australia and the Northern Territory, floods become more frequent. We determine the most vulnerable areas with the highest risk levels by overlapping the locations of natural hazards and the measures of the vulnerability index. Supplementary presents the identified names of the most vulnerable areas in hazard-affected areas. Additionally, we enlarge the maps of capital cities to provide a more comprehensive view of the earthquake-prone regions. Statistics show that earthquake-affected rural Queensland (8.177) and rural Northern Territory (8.638) have significantly higher mean vulnerability index values than other states (e.g., 0.898 in urban New South Wales and 2.446 in ACT)Supplementary [4].
The Universal Soil Loss Equation (USLE) model and geographic information systems (GIS) can be utilized to estimate soil erosion and sediment yield from abandoned mining areas' mine tailing dumps for a specific mine region. This study processed and compiled maps of the five primary factors that affect soil erosion by utilizing a GIS database and the mean annual rainfall recorded at the nearest observatory over a 30-year period: the slope length and steepness factor (LS), cropping management factor (C) and supporting conservation practices factor (P), as well as the rainfall erosivity factor (R, in MJ mm ha1 h1 year1), soil erodibility factor (K, in ton h 107 J mm) and slope length and steepness factor (LS). The mean annual rate of soil erosion (A, in tons per hectare per year) was then determined by multiplying the maps of these major factors using a map algebra method [5].
We chose earthquakes, floods and wildfires because earthquakes have a wider impact on both inland and coastal areas than storm surges and cyclones, which primarily affect coastal areas. Additionally, wildfires and floods are the two natural hazards that are the most notable and prevalent in Australia. In order to locate 41 indicators at the smallest Australian census unit, we adhere to the analytical framework and first utilize a variety of data sources. In the Supplementary, a detailed explanation of why these 41 indicators were chosen, as well as their concepts, metrics and hypothesized effect on vulnerability, is provided.
None.
There are no conflicts of interest by author.
Google Scholar, Crossref, Indexed at
Google Scholar, Crossref, Indexed at
Google Scholar, Crossref, Indexed at
Google Scholar, Crossref, Indexed at
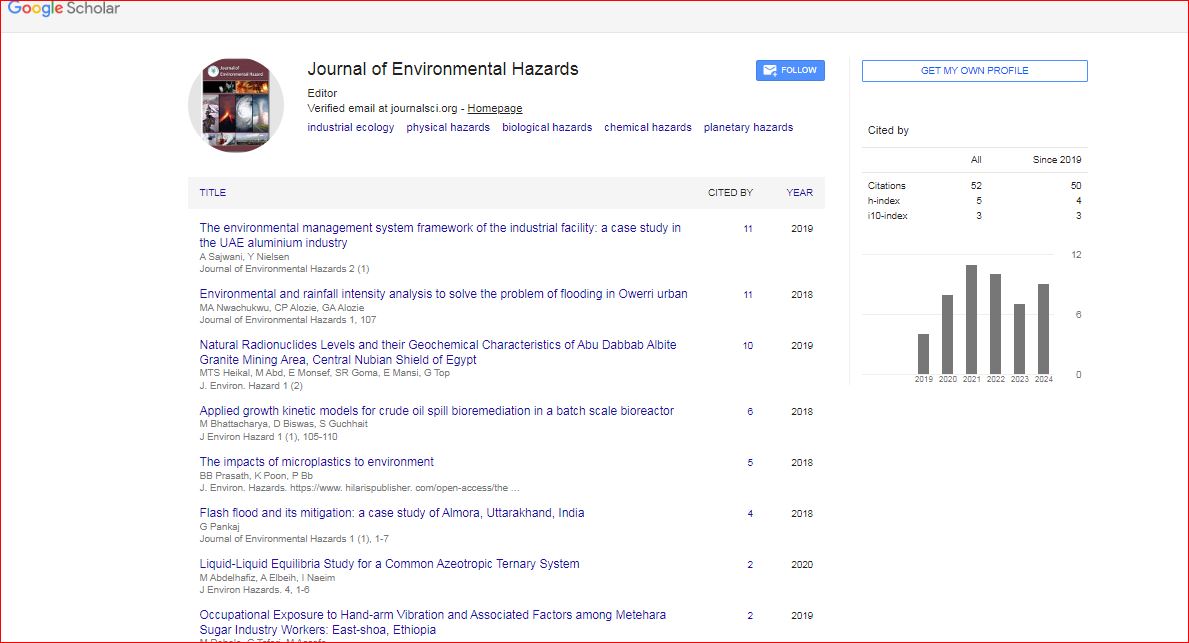
Journal of Environmental Hazards received 51 citations as per Google Scholar report