Research Article - (2023) Volume 12, Issue 5
Received: 26-Sep-2019, Manuscript No. IDSE-23-2977;
Editor assigned: 01-Oct-2019, Pre QC No. P-2977;
Reviewed: 15-Oct-2019, QC No. Q-2977;
Revised: 07-Oct-2023, Manuscript No. R-2977;
Published:
05-Oct-2023
, DOI: 10.37421/2168-9768.2023.12.391
Citation: Abebe, Atakltie and Pratap Singh. "Effect of
Deficit Irrigation on Yield and Water Productivity of Irrigated Wheat
(Triticum aestivum L.) in the Upper Nile River Basin, North West
Ethiopia." Irrigat Drainage Sys Eng 12 (2023): 391.
Copyright: © 2023 Abebe A. This is an open-access article distributed under the terms of the creative commons attribution license which permits unrestricted
use, distribution and reproduction in any medium, provided the original author and source are credited.
The study was conducted at Koga irrigation trial and demonstration site in the upper Nile River basin, to evaluate the effect of deficit irrigation on yield and water productivity of irrigated wheat. The wheat crop was subjected to water stress by not irrigating during different crop growth periods, by reducing the level of irrigation and full irrigation during all crop growth periods. The field experiment was arranged in a randomized complete block design with three replications and seven treatments. It was found that different levels of soil moisture stress had significant (p<0.001) effect on plant height, spike length, number of grains per spike, above-ground biomass, grain yield, and irrigation water productivity. There was no significant difference in crop yield for 75% of ETc and no irrigation during the lateseason crop growth period as compared to 100% of ETc application. But, the irrigation water productivity observed at 75% of ETc application and no irrigation during late season growth period was significantly higher than 100% of ETc application. Imposing deficit irrigation during the late growing period and a deficit of 25%ETc thorough out the whole growing period saved 15% and 25% irrigation water compared to full irrigation practice over the whole growing period with insignificant crop yield decrease of 1.4% and 2% respectively. Irrigation of wheat to 75% of ETc, 50%of ETc, skipping irrigation during crop development period and skipping irrigation during late season period enhance the irrigation water use efficiency by 23.6%, 8.6%, 21.5% and 13.6%, respectively than the full irrigation practice.
Deficit irrigation • Koga irrigation scheme • Water productivity • Water stress
The competition for both quality and quantity of water is alarmingly increasing from time to time due to human activities like population growth, urbanization, increased living standards, growing competition for water and pollution. These are aggravated by climate change and variations in natural conditions. However, the environmental resources like land and water are limited and even decreasing due to over exploitation, pollution and climate change. Irrigated agriculture produces nearly 40% of food and agricultural commodities in the world with only 16% of cultivated land. However, it is the main water-consuming sector worldwide, which accounts for 70% of the entire water withdrawn from aquifers, streams, and lakes. Water is vital for crop production, which its shortage influences crop yields. It is among the main limiting factors for the productivity of agriculture worldwide, which is majorly due to the temporal and spatial variation of rainfall distribution and low amount of water available especially in arid and semi-arid areas [1].
The increasing demand for water is necessitating major changes in irrigation management and scheduling to increase the efficiency of use of water to agriculture. Scarcity and growing competition for irrigation water resource between upstream and downstream users and inefficient water management practices of the farmers reduced its availability for irrigation. Koga irrigation scheme is one of the schemes which suffer from serious water shortage, specifically during late growing periods specifically (February and March) in the irrigation season [2].
The potential irrigable area of Koga irrigation scheme is 7005 ha. However, the maximum irrigated area was 5123 ha in 2011/2012 and 5144.36 ha in 2012/2013. This is 73.5% of the design command areas. Also found that the irrigated area was below the design capacity, which is 5000 ha of land. This implies that either the reservoir water was mismanaged or too small to irrigate small to irrigate design command area or poor water productivity and inefficient irrigation water application by the farmers [3].
Under these conditions, irrigation management strategy has to shift from maximizing the yield per unit area or land productivity to maximizing the productivity per unit of water used by the crop or water productivity. Therefore, the need to use the available water economically and efficiently is unquestionable. One of the options that can help to save irrigation water under these conditions is the adoption of deficit irrigation practices by the farmers in the scheme. Many research results confirm that deficit irrigation is successful in increasing water productivity for various crops without causing severe yield reductions [4]. The yield reduction resulted from deficit irrigation will be insignificant compared with the benefits gained through diverting the saved water to irrigate additional cropped area. However, deficit irrigation water management practices are not done and evaluated yet in the scheme for the major irrigated cereal crops like wheat. This study has evaluated the effect of deficit irrigation practice on different growth stages and yield parameters of wheat to improve the water productivity in the scheme [5].
Description of experimental site
The experiment was conducted at Koga irrigation scheme which is located within the Blue Nile River basin in Amhara region, Ethiopia. It lies between 11°20’N-11°30’N (latitude) and 37°3’E-37°9’E (longitude). It lies at an altitude of 1979 m.a.s.l. The rainfall distribution over the study area is uni-modal. The 20 years (1997-2016) average annual rainfall of the area was about 1507 mm. The mean maximum and minimum temperatures were 27.50C and 12 0C respectively (Tables 1 and 2).
| Monthly Average | Min Temp (°C) | Max Temp (°C) | Humidity (%) | Wind (km/day) | Sun (Hours) | Rainfall (mm) |
|---|---|---|---|---|---|---|
| Jan | 7.9 | 27.3 | 48.6 | 59.4 | 9.5 | 1.8 |
| Feb | 9.5 | 29.8 | 42.9 | 65.9 | 9.8 | 1.6 |
| Mar | 12.1 | 30.3 | 41.4 | 81.8 | 9.2 | 13.4 |
| Apr | 13.8 | 30.5 | 41.7 | 90.4 | 9.2 | 24.1 |
| May | 14.3 | 29.5 | 53.4 | 82.9 | 8.4 | 81 |
| Jun | 14.2 | 27.1 | 66.6 | 82.1 | 6.9 | 184.9 |
| Jul | 13.6 | 24.1 | 76.3 | 66.8 | 4.6 | 423.9 |
| Aug | 13.6 | 24.6 | 83.3 | 64.2 | 4.6 | 390.4 |
| Sep | 13 | 25.8 | 73 | 64.7 | 6.4 | 194.7 |
| Oct | 13.1 | 27 | 64.8 | 65.2 | 8.6 | 92.3 |
| Nov | 10.7 | 27.2 | 57.2 | 61.1 | 9.5 | 9.8 |
| Dec | 8.2 | 27 | 52.5 | 54.8 | 9.8 | 4 |
Table 1. Monthly average values of climatic data for 20 year (1997-2016).
The soil of the study area was dominantly sandy clay soil. The soil texture and the soil properties were good enough to exercise deficit irrigation practice since it is almost a fine-textured soil (good water holding capacity). The average value of the soil pH and the organic matter content of the soil were 5.5 g k-1 and 3.4 g k-1, respectively [6].
Experimental designs and procedures
The experiment was designed as a Randomized Complete Block Design (RCBD) with three replications. Seven treatments were depending on the different level of irrigation water application during the different crop growth period. The details of the different treatments are given in Table 2. Four crop growth periods such as the initial period (S1), development period (S2), mid-season period (S3) and late-season period (S4) were identified [7].
| Water applied at different growth stages as % of ETc* | ||||
|---|---|---|---|---|
| Treatment | Initial period | Development period | Mid-season period | Late season period |
| T1 | 0 | 100 | 100 | 100 |
| T2 | 100 | 0 | 100 | 100 |
| T3 | 100 | 100 | 0 | 100 |
| T4 | 100 | 100 | 100 | 0 |
| T5 | 50 | 50 | 50 | 50 |
| T6 | 75 | 75 | 75 | 75 |
| T7 | 100 | 100 | 100 | 100 |
Note: *ETc=Evapotranspiration of the crop as estimated from CROPWAT-8 software
Table 2. Detailed treatments of experiment.
The description of different treatments is below:
T1: No irrigation during initial growth periods, but irrigation equal to 100% of ETc* during the remaining growth periods. T2: No irrigation during the development growth period, but irrigation equal to 100% of ETc* during the remaining growth periods T3: No irrigation during the mid-season growth period, but irrigation equal to 100% of ETc* during the remaining growth periods. T4: No irrigation during the late growth period, but irrigation equal to 100% of ETc* during the remaining growth periods. T5: Irrigation equal to 50% of ETc* during all growth periods. T6: Irrigation equal to 75% of ETc* during all growth periods T7: Irrigation equal to 100% of ETc* during all growth periods.
Seedbed preparation and sowing
The size of each plot was 2 m × 3 m. None experimental area of 2 m wide was left between adjacent blocks of plots and 1 m wide between two adjacent plots for construction of irrigation channel. The irrigation channel was lined with plastic to minimize lateral water movement between plots [8]. The furrows were constructed manually along the length of the plot and the spacing between the furrows was 20 cm (Figure 1).

Figure 1. Field experiment on the field.
Wheat seed variety (Kingbird) was sown by drilling manually on the top of the furrow ridge at a seeding rate of 150 kg ha-1 on 22nd November 2017 as per recommended agronomical practices. Each plot was fertilized with 150 kg ha-1 Urea (90 kg ha-1 Nitrogen) and 121 kg ha-1 Di-ammonium phosphate (55.5 kg ha-1 P2O5-phosphorus). Half of the nitrogen dose and full dose of Di-ammonium phosphate were applied during sowing of wheat, whereas, the remaining half dose of Nitrogen was applied 25 days after sowing [9].
The irrigation scheduling was done based on the optimum irrigation treatment (100% ETc) and stressed treatments received a lower amount based on their levels on the same irrigation date. Daily ETo was computed using CropWat model version 8.0 based on the daily climatic data collected from a weather station at the center. Crop coefficient, optimum depletion level, and root depth were adopted from FAO irrigation and drainage paper 56. Effective rainfall during the growing period was determined using the CropWat model daily based on the dependable rainfall. 3-inch Parshall flume was used to measure irrigation water input for each treatment and irrigation was applied using furrow irrigation method [10].
Crop sampling and yield measurement
There was no incidence of crop diseases during the experimental period. The crop grain yield and dry matter yield were determined by harvesting six internal crop rows from each plot. Thus the area harvested from each plot for determination of crop yield was 1.2 m × 3 m (3.6 m2). All matter above the ground was considered a dry matter. The dry matter and the grain yield were determined after air-drying the crop. The harvesting of the crop was done manually on 21st March 2018. The grain yield and dry matter yield harvested from each plot were converted to yield per hectare. Yield attributing data (plant height, panicle length, and the number of seeds per panicle) was collected from five randomly selected plants from each plot [11].
Data analysis
The experimental data were analyzed for variance using the Statistical Analysis (SAS) software. If the analysis of variance shows a significant treatment effect, the Least Significance Difference (LSD) test applied to compare the means at 5% significance level (P<0.01). Differences among treatment means were examined for statistical significance using the ‘Least Significant Difference (LSD) test’ and ‘Duncan’s Multiple New Range Test (DMRT)’ standard at 5% significance level [12].
Crop water production function
The relationship between crop yield and crop water use is known as crop water production function. The crop yield may be expressed as grain yield or dry matter production. Similarly, crop water used may be expressed as transpiration, evapotranspiration or depth of irrigation [13]. Therefore, different relationships between grain yield and depth of irrigation were used in the present analysis as expressed by Equations 1 to 4.
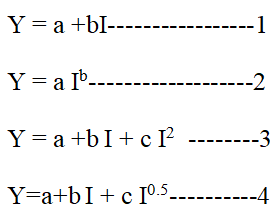
Where, Y=Crop grain yield I=Gross depth of irrigation water applied a, b and c=constants
Irrigation water productivity
Irrigation water productivity (irrigation water use efficiency) for the wheat crop was calculated by using equation 5 as proposed by
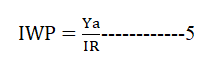
Where, IR=Irrigation water applied (cm) Ya=The grain yield (Kg ha-1) IWP=Irrigation Water Productivity (Kg ha-1 cm-1)
Crop yield and yield component results
The irrigated wheat yield attribute results (plant height, panicle length and seed number per panicle) were significantly affected by different soil moisture stress level. The grain yield and irrigation water productivity also significantly affected by different soil moisture stress level (Table 3). The highest grain yield (3552 kg ha-1) was obtained at a control treatment (100%of ETc application during the entire growth periods) and has no significant differences with irrigation applications of 75%ETc and no irrigation (skipping) only during late season period. On the other hand, the minimum grain yield (1929 kg ha-1) was observed at no irrigation during the initial growing period and this was statistically inferior to all other treatments (Table 3) [14].
| Treatment | Plant height (cm) | Panicle length (cm) | Seed number per panicle (No) | Hectoliter weight (%) | Above-ground biomass (kg ha-1) | Grain yield (kg ha-1) |
|---|---|---|---|---|---|---|
| T1 | 70.7 | 6.53 | 47.8 | 77.33 | 8518 | 2805 |
| T2 | 66.93 | 5.2 | 35.47 | 75.6 | 6482 | 2191 |
| T3 | 67.93 | 6.3 | 35.8 | 75.93 | 7593 | 2595 |
| T4 | 72.03 | 7.1 | 46a | 78 | 9666 | 3500 |
| T5 | 64.13 | 6.1 | 42.07 | 75.3 | 8000 | 1929 |
| T6 | 69.67 | 7.4 | 47.8 | 77.73 | 9515 | 3483 |
| T7 | 73 | 7.6 | 49.8 | 77.47 | 10230 | 3552 |
| CV | 12.1 | 15.3 | 16.6 | 1.2 | 16.7 | 11.6 |
| LSD (5%) | 2.6 | 0.63 | 5.13 | 1.3 | 1016 | 82.9 |
Table 3. Yield and yield components.
Different irrigation water levels in irrigated wheat have shown highly significant (p<0.001) influence on grain yield per hectare production (Table 4).
| Source of variation | DF | SS | MS | F-value | pr.>F |
|---|---|---|---|---|---|
| Replication | 2 | 1658 | 829 | 0.38 | |
| Treatment | 6 | 7991191 | 1331865 | 612.91 | <0.001 |
| Residual | 12 | 26076 | 2173 |
Table 4. Analysis of variance for grain yield.
The different soil moisture stress levels on irrigated wheat showed also significantly influenced (p<0.001) the aboveground biomass. Reduction of irrigation water amount from 100% of ETc to 50% and 75% ETc reduced the biomass production by 21.8% and 6.9%, r espectively. The decreased aboveground biomass in moisture-stressed treatments might be due to the reduction in photosynthesis in which amount of water and chlorophyll is important. As the level of moisture stress increase, the amount of water applied is not sufficient for the production of higher biomass (Table 5).
| Source of variation | DF | SS | MS | F-value | pr.>F |
|---|---|---|---|---|---|
| Replication | 2 | 702741 | 351370 | 1.08 | |
| Treatment | 6 | 31481118 | 5246853 | 16.09 | <0.001 |
| Residual | 12 | 3913841 | 326153 |
Table 5. Analysis of variance for above ground biomass.
The plant height was significantly affected (p<0.001) due to the different level of soil moisture stress. The decrease in irrigation level from 100% ETc to 50% and 75% ETc resulted in decreased plant height by 12.3% and 4.6% respectively. Plant height and other growth parameter were affected when there was moisture stress because of the reduction in photosynthesis and reduce total biomass production of the plant (Table 6) [15].
| Source of variation | DF | SS | MS | F-value | pr.>F |
|---|---|---|---|---|---|
| Replication | 2 | 17.597 | 8.799 | 4.07 | |
| Treatment | 6 | 172.047 | 28.674 | 13.26 | <0.001 |
| Residual | 12 | 25.956 | 2.163 |
Table 6. Analysis of variance for plant height.
The panicle length was significantly affected (p<0.001) due to different levels of soil moisture stress. Spike length was reduced by 15.27% as the amount of irrigation water application reduced from 100% of ETc to 50% of ETc (Table 7).
| Source of variation | DF | SS | MS | F-value | pr.>F |
|---|---|---|---|---|---|
| Replication | 2 | 0.0181 | 0.009 | 0.07 | |
| Treatment | 6 | 13.0114 | 2.1686 | 17.48 | <.001 |
| Residual | 12 | 1.4886 | 0.124 |
Table 7. Analysis of variance for panicle length.
Grain seed per spike was significantly influenced (p<0.001) due to the effect of different soil moisture stress levels. The reduction of irrigation water amount from 100% of ETc to 50 and 75% of ETc reduced the number of grains per spike by 15.9% and 4.1% respectively (Table 8).
| Source of variation | DF | SS | MS | F-value | pr.>F |
|---|---|---|---|---|---|
| Replication | 2 | 39.25 | 19.625 | 2.36 | |
| Treatment | 6 | 626.373 | 104.396 | 12.55 | <0.001 |
| Residual | 12 | 99.844 | 8.32 |
Table 8. Analysis of variance for seed number per panicle.
Hectoliter weight was significantly affected (p<0.001) due to different levels of moisture stress. Maximum hectoliter weight of 78.8 kg Lt-1 was obtained due to irrigation water applied to optimum irrigation treatment, which was statistically similar to that of 75% of GIR thorough out the growing period and deficit irrigation during a late growth period.
The decrease in irrigation level from 100% of ETc to 50 and 75% of ETc leads to a decrease of 12.3% and 4.6% hectoliter weight. The analysis of variance for hectoliter weight is described in Table 9.
| Source of variation | DF | SS | MS | F value | pr.>F |
|---|---|---|---|---|---|
| Replication | 2 | 0.2171 | 0.1086 | 0.2 | |
| Treatment | 6 | 22.1295 | 3.6883 | 6.83 | 0.002 |
| Residual | 12 | 6.4762 | 0.5397 |
Table 9. Analysis of variance for hectoliter weight.
Crop water use and crop yield
The data reveal that the reduction of irrigation water by 50% of the optimum irrigation treatment reduced grain yield production per hectare by 45.69%. Imposing deficit irrigation during the late growing period and a deficit of 25% ETc thorough out the whole growing period saved 15% and 25%irrigation water compared to full irrigation practice over the whole growing period with insignificant crop yield decrease of 1.4% (50 kg ha-1) and 2% (71 kg ha-1), respectively (Table 10).
| Treatment | Yield kg ha-1 | Irrigation water applied (cm) | Irrigation water use efficiency (Kg ha cm-1) | RWS compared to T7 (%) | RYD* compared T7 (%) |
|---|---|---|---|---|---|
| T1 | 2805 | 65.6 | 42.76 | 14.5 | 21 |
| T2 | 2191 | 55 | 39.84 | 28.3 | 26.9 |
| T3 | 2595 | 44 | 58.98 | 42.8 | 38.3 |
| T4 | 3500 | 65.3 | 53.58 | 14.9 | 1.5 |
| T5 | 1929 | 38.3 | 50.37 | 50 | 45.7 |
| T6 | 3483 | 57.5 | 60.57 | 25 | 1.9 |
| T7 | 3552 | 76.7 | 46.31 | - | - |
Note: *RWU=Relative Water Saved and RYD=Relative crop Yield Decrease
Table 10. Relative water saving and relative crop yield.
Deficit irrigation effectively boosted irrigation water productivity. The highest irrigation water productivity was obtained under deficit irrigation with 25% of GIR deficit irrigation throughout the whole crop growing period. This indicates that the water was most efficiently used in this treatment [16]. Irrigation water useefficiency (IWUE), which refers to the ratio of grain yield to total irrigation water supplied, varied from 39.8 kg h-1 to 60.6 kg ha cm-1. The different soil moisture stress levels on irrigated wheat have shown a significant (p<0.001) influence on the irrigation water use efficiency. The highest irrigation water use efficiency (60.6 kg ha-1 cm-1) was observed at 25% of deficit irrigation to the whole growing stage treatment. On the other hand, the minimum water use efficiency (39.8 kg ha-1 cm-1) was observed deficit irrigation application at development growth stage. The data reveal that irrigation of wheat to 75% of ETc, 50% of ETc, skipping irrigation during crop development period and skipping irrigation during late season period enhance the irrigation water use efficiency by 23.6%, 8.6%, 21.5% and 13.6%, respectively than the 100% of ETc application during the entire growing period. However, in stressed treatments, irrigation water might be used for the productive purpose of the crop effectively. With the increasing amount of water supply, the irrigation water use efficiency decreases. Treatments with lower yield due to less water application had higher water use efficiency (Table 11).
| Source of variation | DF | SS | MS | F-value | pr.>F |
|---|---|---|---|---|---|
| Replication | 2 | 0.008182 | 0.004091 | 1.18 | 0.333 |
| Treatment | 6 | 0.843519 | 0.120503 | 34.68 | <.001 |
| Residual | 12 | 0.048653 | 0.003475 |
Table 11. Analysis of variance of irrigation water productivity.
Relationship between grain yield and irrigation water applied
The graphical variation of the grain yield with irrigation water applied is shown in Figure 1. Different crop water production functions relating crop yield to the seasonal depth of gross irrigation were examined as given by Equation 1 to 4. The relationships between the grain yield and the seasonal irrigation water applied were examined using XL STAT Software. The estimated values of the constants for different crop production functions are given by Equations 6 to 9 (Figure 2).
Linear function

Quadratic function

Square root function

Power function
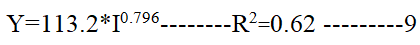
Where, I=Gross depth of seasonal irrigation water applied, mm Y=Grain yield kg ha-1

Figure 2. Relationship between irrigation water applied and grain yield.
The estimated values of R2 for linear, quadratic, square root and power function were 59.9%, 60.6%, 60.7% and 62% respectively. Thus power function represents the relationship between the amounts of irrigation water applied (I) and crop yield (Y) better than the other functions with the highest value of R2. It may be observed from Figure 1. and also from power crop water production function (equation 8) that the crop yield increased at decreasing rate with increase in depth of irrigation.
The values of wheat crop grain yield and grain yield attributes decreased, whereas, the irrigation water use efficiency was increased with an increase in soil moisture stress due to the decrease in the depth of irrigation application. Shorter plant height and spike length resulted due to reduced irrigation depth. The number of grains per spike was reduced and lighter grain weight was observed as the amount of irrigation application reduced from 100% of gross irrigation requirement ETc) to 50% of ETc.
The reduction in wheat crop grain yield was insignificant with a reduction in the depth of ETc to 75% as compared to 100% ETc. Similarly, not irrigating the crop during late-season crop growth period caused an insignificant reduction in crop grain yield. However, irrigating crop at 75% ETc or not irrigating crop during late-season crop growth period caused a significant increase in irrigation water use efficiency. Thus a large amount of irrigation water may be saved with deficit irrigation of wheat crop grown in Koga irrigation scheme.
The crop water requirement is well met if the crop is irrigated at 75% ETc with an insignificant reduction in grain yield. The power crop water production function expressing the relationship between crop yield and irrigation water applied was found better with a higher value of R2 as compared to linear, polynomial and quadratic crop production functions. Thus the wheat crop grain yield increased with increase in depth of irrigation at a decreasing rate. The seasonal sensitivity factor for the wheat crop was found to be equal to 0.84. However, the crop sensitivity to water stress was highest during the development crop growth period and the crop was least sensitive to water stress during the late-season crop growth period. Thus not irrigating crop near about end of initial crop growth period caused the highest reduction in grain yield.
The decrease in grain yield of the wheat crop was insignificant with 25% of ETc deficit irrigation (irrigation at 75% ETc) application during the whole crop growing season from sowing to harvesting. However, it resulted in a significant increase in water use efficiency. Thus, the wheat crop can be irrigated at 75% of ETc throughout the entire growing period in Koga irrigation scheme. The decrease in grain yield was insignificant by not irrigation crop during the late-season crop growth period. Therefore, the crop may not be irrigated during the late-season crop growth period.
The wheat crop was highly sensitive to water stress during the development crop growth period. Therefore, irrigating wheat crop near about the end of the initial crop growth period was necessary to about any water stress during the development crop growth period. The amount of water saved with 25% deficit irrigation water application and no irrigation during late season growth period can be used to bring the additional area under irrigation. Thus, the overall crop production can be increased.
I would like to express my gratitude for the support and continuous feedback provided by Dr.Ing. Pratap Singh (professor), Arba Minch water technology institute, Arba Minch university during the conduct of this research work. Sincere thanks are offered to Amhara regional agricultural research institute for providing me the opportunity and the financial support for the study. The generous contributions from my colleagues, Dr. Tadele Amare (soil and water research directorate director and senior researcher), Amare Tsige (agricultural water management researcher), Dires Tewabe (agricultural water management researcher) and Abraham Awoke (soil and water laboratory technician), Yechale Achenef and Ayele Hailu are acknowledged. Thanks are also expressed to Asmare Wubet (Ph.D.candidate at Wageningen university, netherland).
[Crossref] [Google Scholar] [PubMed]
[Crossref] [Google Scholar] [PubMed]
Irrigation & Drainage Systems Engineering received 835 citations as per Google Scholar report


