Research Article - (2023) Volume 12, Issue 4
Received: 23-May-2022, Manuscript No. IDSE-22-64632;
Editor assigned: 26-May-2022, Pre QC No. IDSE-22-64632(PQ);
Reviewed: 10-Jun-2022, QC No. IDSE-22-64632;
Revised: 25-Jul-2022, Manuscript No. IDSE-22-64632(R);
Published:
01-Aug-2022
, DOI: 10.37421/2168-9768.2022.11.386
Citation: Fikadu, Robi, Jemal Mohammed, Kebede Nanesaand Nigussie Abebe, et al. "Determination of Appropriate Furrow Length and Inflow Rate for Furrow Irrigation Practice under Werer Climatic condition for Cotton Production at Middle Awash, Ethiopia." Irrigat Drainage Sys Eng 11 (2022): 332.
Copyright: �© 2022 Robi F, et al. This is an open-access article distributed under the terms of the creative commons attribution license which permits unrestricted use,
distribution and reproduction in any medium, provided the original author and source are credited.
This article explains how to determine appropriate furrow length and flow rate for furrow irrigation system that is accurate and simple to use in semi-arid climates. The experiment was carried out from April to November 2019 and April to November 2021. Cotton was grown in Middle Awash, Ethiopia, thus field tests were conducted there. The yield and water productivity were significantly affected by the interaction of furrow length and inflow rate. Furrow length of 50 m combined with (1.2 l/s) inflow rate for 35.6 minutes produced the highest water application efficiency (65.0 %), water productivity (1.37 kg/m3), and lint yield (6.86 t/ha). The lowest water application efficiency (38.3 %), with inflow rate (1.6 l/s) for 9.75 minutes, and water productivity (0.85 kg/m3) were achieved from 10 m furrow length.
Application efficiency • Distribution uniformity • Water productivity • Cotton • Yield
Surface irrigation, in which water is dispersed over the field via overland flow, is the most common type of water application to agricultural lands. Because of its inexpensive equipment and energy costs, furrow irrigation is a popular surface irrigation method [1]. Furrow irrigation is the finest technique of surface irrigation because it provides adequate aeration in the root zone [2]. Despite its widespread use, the system has low irrigation efficiency and uniformities, which can lead to lower crop yields [3]. In surface irrigation, water losses might amount to as much as 40% of the entire water supply, this low efficiency may have occurred as a result of inadequate design and management [4]. Various management strategies and field layouts can be adopted to improve the irrigation efficiency and uniformity of a surface irrigation system during an evaluation.
The selection of an intake flow rate (Qmax) that maximizes application efficiency (Ea) is the most important challenge in the design of surface irrigation systems. According to the reports of inflow rate and cut-off time are the most effective parameters of furrow irrigation design. Morris, et al. suggested that inflow rate of the range of 2 to 7 L/s and cut-off time from 50 to 300 min were suitable for the best performance [5]. According to, slope, length, and cross-section are all essential geometrical factors for performance evaluation. With the correct field geometry, you may boost irrigation application efficiency by up to 26.7 % [6,7].
Efficient application and distribution of water by furrow irrigation is dependent on furrow parameters such as flow rate, soil textural class, field slope, soil infiltration characteristics, roughness coefficient, and irrigation management. To address these issues, the first priority is to improve irrigation water management. There is limited quantitative data on the Amibara irrigation scheme's system performance and water management. Therefore, the objective of this study was to generate information on furrow variables specifically flow rate and furrow length and their combination to enhance irrigation efficiency for cotton production.
Description of study area
The study site was Middle Awash, were Agricultural Research Center, in Ethiopia's Awash River Valley, where there is a severe need for judicious water use and productive agriculture, particularly cotton, wheat, maize and onion cultivation. The research center is 740 meters above sea level and is located at 9° 16' 8" latitude and 40°9' 41" longitude. The area is classified as semi-arid due to its average annual rainfall of 590 mm and high evaporation rate of 2680 mm per annual. The average minimum and maximum temperatures are 19°C and 40.8°C respectively. The gradients are usually between 1-2%.
Treatment arrangement
Furrow length and irrigation water inflow rate are two variables in the experiment. The experiment was set up using a split plot in randomized complete block design. In the main plots, three levels of furrow length were assigned, and three levels of inflow rate were assigned in sub plots. Treatments were allocated to each plot at random in three blocks, and each block served as a replication (Table 1).
| No | Treatment arrangement | ||
|---|---|---|---|
| Main plot furrow length (m) | Sub plot flow rate Qmax (%) | Flow rate (Qmax) (l/s) | |
| 1 | 10 | 50 | 0.8 |
| 2 | 30 | 75 | 1.2 |
| 3 | 50 | 100 | 1.6 |
Design of surface irrigation system
The volume balance model was chosen for this investigation because it has been shown to be accurate, requires little data, and relies on few assumptions. The volume balance model posits that water entering the field will travel a distance, X, toward the field’s lower end at any given time (t). The inflow of water into the furrows at the field's entrance, Qo, is assumed to be constant, such that at time t, the product of Qo and t equals the volume of water on the soil surface, Vy (t), plus the volume infiltrated, Vz (t), both of which are time dependent. The factors employed in the mathematical models representing the complete process of surface irrigation to increase irrigation efficiency include field size, field slope, flow rate, cut-off time, soil-infiltration characteristics, and flow resistance. Advance time, recession time, infiltrated depths, and accompanying irrigation efficiencies and uniformities are all determined by interactions between the variables. The volume balance equation is as follows.
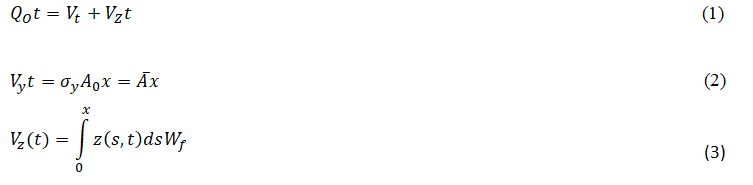
Ā is the average area of the furrow shape, Wf is the furrow width, Ao is the cross-sectional flow area at the field entrance, y is the surface shape parameter, z (s,t) is the infiltrated volume per unit length throughout the advance length, and s is the distance travelled by the advancing front.

Where σz is the sub-surface shape parameter. The following two assumptions are applied to the volume balance model
In a furrow a simple power function can be employed to describe the waterfront's trajectory

Where x is the distance that the front has advanced at time t, and r, and P are empirically fitted parameters.
The infiltration function has a Kostiakov-Lewis characteristic form

Where Z is the volume of infiltrating water per unit length, τ denotes the opportunity time, fo denotes the basic intake rate in terms of volume per unit length per unit time, and k and τ denote empirically fitted parameters. The volume balancing model can be stated as follows if these two assumptions in the Lewis-Milne equation are used [8].

where,
Qo inflow per furrow at the upstream end of the field ( m3/min)
t=Time from the start of inflow (min)
σy =Surface flow shape factor from 0.77-0.80
Ao=The flow area at the flow’s upstream end at time tx (m2)
x=The distance from the inlet that the advancing front has travelled in tx minutes
σz=Subsurface shape factor
f0=Basic infiltration rate
k=Empirical parameters (m2/min/m)
r=Power advance
a=Empirical coefficient
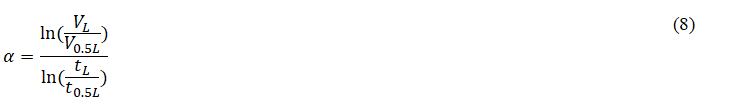
For determining parameters ‘k’ and ‘α’ of the infiltration function can be solved knowing the advance times corresponding to two locations as follows [9].
where,
α empirical coefficients
VL=Volume of water at the end of the field
V0.5L=Volume of water at the mid of the field
tL=The advance time at the end of the field
t0.5L=The advance time at the mid of the field
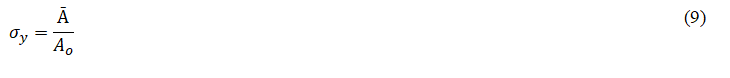
Where σy is the subsurface water profile shape factor and σy is the surface water profile shape factor.
The maximum non-erosive flow rate was calculated using the method below, which took into account the farm's slope (furrow slope) and soil type [10].

α coefficient which depend on soil texture (soil type) Qmax maximum non erosive flow rate (lit/sec)
β coefficient which depend on soil texture (soil type) S Furrow slope (%)
The relationship between the depth of water in the furrow and the matching top width was determined using the furrow geometry data. To approximate this relationship, we used Equation 10. The parameters α1, α2 can be determined by fitting data to the equation 11.

Where B denotes the top width of the water in the furrow, y denotes the depth of the water in the furrow, and α1 and α2 are the top width factor parameters.
The wetted perimeter factor parameters γ1 and γ2 can be calculated using the formula below.

Where WP is the Wetted Perimeter of the furrow
Parameter data for the advance function is needed to improve furrow irrigation performance [11].
The application efficiency (Ea) is computed by dividing the volume of water necessary to fill the specified depth of water in the soil by the volume of water delivered to the furrow.

tco is the cut-off time in minutes, and Zreq is the needed depth in meters to be filled.
Water distribution efficiency (DU)
The ratio of the smallest accumulating depths in the distribution to the average depths of the entire distribution is commonly referred to as distribution uniformity [12].

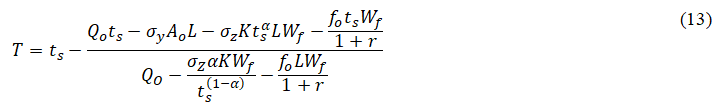
Inflow time (T)
To apply the greatest depth of application water to the test (optimal) furrow and its buffer furrows with the given optimal flow rate, the time of cutoff was computed as follows [13].

T=Inflow time of cutoff (min),
L=Furrow length (m),
W=Furrow spacing (m),
Fg=Gross depth of application (mm),
Qo=Flow rate (l/s).
The flow rate in the 90° V-notch was determined by using the equation developed by Shen.

Q=flow rate in the Parshall flume
Ce=Coefficient of discharge
The height measured with respect to the vertex of the notch, cm
Molden defined water productivity as the physical mass of production or the economic value of production measured against gross inflow, net inflow, depleted water, process depleted water, or available water.

Estimation of infiltration parameter
One of the most helpful infiltration equations in surface irrigation is the modified Kostiakov-Lewis equation. In this investigation, the Kostiakov–Lewis equation was employed to determine cumulative infiltration, as illustrated below [14].

where,
Z=Cumulative infiltration in units of volume per length of the furrow t elapse time of infiltration (min) α, k empirical coefficients (α=dimensionless, k=m3/min/m-1) fo Basic infiltration rate (m-3 m-1 min-1)
The advance curve is a simple power function, found using the following equation.

where,
x=Water front advance (m)
P=Fitting parameter
t=Time from start of inflow (min)
r=Fitting parameter
Kostiakov-Lewis parameters (α and k) were determined as follows:

where,
k=Empirical coefficients
VL=Volume of water at the end of the field
σ Z =surface profile coefficients

Where σy is surface profile shape factor (0.77); σz is subsurface profile shape factor; t 0.5 L and TL are the advance times (min) at two points, x1=0.5 L and x2=L respectively.
Irrigation performance parameter
Application Efficiency (AE) and Distribution Uniformity (DU) are performance criteria used in this study. Soil moisture samples were taken by using Auger sampler at three locations along the furrow and at three depths before and after irrigation (48 hours) (0-30, 30-60 and 60-90 cm) for estimating AE and DU.

Where Dad, Dp, Zmin, Zav, and Ddp represent the depth of water added to the root zone (mm),
Characteristics of the experimental site
The trial was conducted in 2019 and 2021 at were agricultural research center. The soil of the site categorized under clay soil texture. Table 2 gives the soil physical properties and textural class. The bulk density ranges from 1.19 to 1.23 g/cm3.
| Soil depth (cm) | FC (%) | PWP (%) | Available water (mm/m) | Drainage rate (cm/hr) | BD (g/cm3) | Texture | |||
|---|---|---|---|---|---|---|---|---|---|
| Sand | Clay | Silt | Class | ||||||
| 0-30 | 42 | 30 | 147.9 | 26.9 | 1.19 | 5.1 | 58.2 | 36.7 | Clay |
| 30-60 | 42 | 30 | 152.9 | 24.4 | 1.23 | 9.1 | 52.9 | 38 | Clay |
| 60-90 | 41 | 27 | 156.8 | 26.4 | 1.22 | 6.5 | 51.5 | 42 | Silty clay |
FC=Field capacity, PWP=Permanent wilting point, BD=Bulk density
Figure 1 shows that the basic infiltration rate of soil of experimental site was 5.01 mm/hr, which was the maximum infiltration for the clay soil (Table 3).
| Depth (cm) | Ece (ds/m) | pH | Soluble cations | |||||
|---|---|---|---|---|---|---|---|---|
| (Ca+Mg(meq/l) | meq/l (Na) | meq/l (k) | SAR | |||||
| 0-30 | 0.44 | 7.7 | 1.5 | 12.1 | 1.01 | 13.8 | ||
| 30-60 | 0.61 | 7.5 | 1.2 | 15.6 | 1.03 | 21.5 | ||
| 60-90 | 0.79 | 7.5 | 1.5 | 13.7 | 1.1 | 17.4 | ||
| Depth (cm) | Exchangable cations | OC (%) |
TOC (%) | OM (%) | TN (%) | P (ppm) | ||
| (Ca+ Mg) cmol+/kg | K cmol+/kg | Na cmol+/kg | ||||||
| 0-30 | 46.3 | 5.8 | 18.5 | 0.77 | 0.95 | 1.64 | 0.08 | 14.73 |
| 30-60 | 44.7 | 4.3 | 16.2 | 0.61 | 0.8 | 1.38 | 0.07 | 16.63 |
| 60-90 | 43.3 | 2.6 | 14.3 | 0.52 | 0.69 | 1.19 | 0.06 | 17.06 |
OC=Organic Carbon, TOC=Total Organic Carbon, OM=Organic Matter, TN=Total Nitrogen, SAR=Sodium Absorption Ratio

Figure 1. Infiltration curve of experimental site.
Main effect of inflow rate and furrow length on yield and water productivity
According to the analysis of variance, inflow rate had a significant impact on crop water productivity (P ≤ 0.01). Furrow length had a significant (P ≤ 0.05) impact on crop water use efficiency. The maximum yield and water productivity was obtained from 50 m furrow length and from 1.2 l/sec inflow rate. The result concludes that as the furrow length increases the water productivity increases this in turn ncrease the yield of cotton and decreases water loss (Table 4). This result agreed with the results of [15,16].
| Furrow length | LY | BW | Seed yield | WP |
|---|---|---|---|---|
| 10 m | 5.87b | 157.7b | 3.38b | 0.84b |
| 30 m | 6.76a | 179.7a | 3.90ab | 0.97ab |
| 50 m | 6.72a | 179.5a | 4.62a | 1.15a |
| LSD (0.05) | 0.67 | 19.3 | 0.78 | 0.2 |
| CV | 11.2 | 12.1 | 21.4 | 21.8 |
| Inflow rate | ||||
| 0.8 l/s | 6.58a | 167.6a | 35.3b | 0.88b |
| 1.2 l/s | 6.54a | 174.2a | 42.5a | 1.06a |
| 1.6 l/s | 6.58a | 175.2a | 41.1ab | 1.02ab |
| LSD (0.05) | ns | ns | 6.4 | 0.16 |
| CV | 11.9 | 13.6 | 16.05 | 13.4 |
Seed yield (t/ha), LY=Lint Yield (t/ha), BW=30 Ball Weight (gm), WP=Water Productivity (kg/m3)
The yearly combined analysis shows that there is a significance (P ≤ 0.05) difference between furrow lengths in terms water productivity (Table 5). The highest water productivity was recorded from 50 m furrow length and minimum was recorded from 10 m. The furrow length had significant effect on water productivity of cotton and this result agrees with the achievements of [17].
| Treatment | Water productivity (kg/m3) | |||
|---|---|---|---|---|
| 2019 | 2021 | Combined mean | ||
| Furrow length (m) | 10 m | 0.86 | 0.82 | 0.84b |
| 30 m | 1.02 | 0.93 | 0.97b | |
| 50 m | 1.18 | 1.12 | 1.15a | |
| Year*inflow*furrow length | ns | |||
| LSD (5%) | 0.16 | |||
| CV | 14.8 | |||
LSD=Least Significance Test, CV=Coefficient of Variation
The combine analysis of inflow rate shows that had a significant (P ≤ 0.05) effect on water productivity of cotton (Table 6). The maximum water productivity was recorded from 1.6 l/s and minimum was recorded from 0.8 l/s inflow rate. This result agrees with achievements of [18-20].
| Treatment | Water productivity | |||
|---|---|---|---|---|
| 2019 | 2021 | Combined mean | ||
| Flow rate (l/s) | 0.8 l/s | 0.89 | 0.87 | 0.88b |
| 1.2 l/s | 1.12 | 1 | 1.06ab | |
| 1.6 l/sec | 1.06 | 0.99 | 1.02ab | |
| Year*inflow*furrow length | ns | |||
| LSD (5%) | 0.16 | |||
| CV | 14.6 | |||
The combined analysis shows that the yield had significantly affected by furrow length (Table 7). The maximum cotton yield (seed yield+lint yield) was recorded from 50 m furrow length.
| Treatment | Yield (ku/ha) | |||
|---|---|---|---|---|
| 2019 | 2021 | Combined mean | ||
| Furrow length (m) | 10 m | 34.6 | 33.1 | 33.8b |
| 30 m | 41.1 | 37 | 39.0b | |
| 50 m | 47.5 | 44.9 | 46.2a | |
| Year*inflow*furrow length | ns | |||
| LSD (5%) | 6.2 | |||
| CV | 19.4 | |||
The yearly combined analysis of inflow rate shows that there is significant difference in harvest yield of cotton. The maximum yield was obtained from 50 m furrow length and the lowest was recorded from the shortest 10 m furrow length (Table 8).
| Treatment | Yield (ku/ha) | |||
|---|---|---|---|---|
| 2019 | 2021 | Combined mean | ||
| Furrow length (m) | 0.8 l/s | 35.8 | 34.9 | 35.3b |
| 1.2 l/s | 44.9 | 40.1 | 42.5a | |
| 1.6 l/sec | 42.4 | 39.9 | 41.1ab | |
| Year*flow*furrow length | ns | |||
| LSD (5%) | 6.6 | |||
| CV | 18.4 | |||
The effect of furrow length and inflow rate on water productivity and yield of cotton
According to the results of ANOVA table there is a significant difference (P ≤ 0.05) between the interaction effects of furrow length and inflow rate (Table 9). The maximum water productivity of (1.37 kg/ m3) was recorded from 50 m furrow length combined with 1.2 l/s flow rate. Maximum lint and seed yield was also recorded from the same furrow length combined with 1.2 lit/s inflow rate. The highest water application efficiency of (65%) was recorded from 50 m furrow length with 1.2 l/s inflow rate. The maximum DU (Table 9) of 84.3% was obtained for 50 m furrow length and 1.2 lit/s inflow rate; whereas the minimum DU 38.3% was obtained for flow rate of 1.6 lit/s inflow rate of the 10 m furrow length. Application efficiencies affected by the furrow length and inflow rate. The higher the furrow length has maximum application efficiency and cotton lint and seed yield plus water productivity. On clay soil that furrow length and application discharge are the main factor affecting application efficiency and larger flow rates are needed as furrow length increases to obtain high efficiencies [21,22]. Higher furrow length has maximum application efficiency and yield. The result in lined with results of [23,24].
| No | Treatment | AE (%) | DU (%) | WP (kg/m3) | Advance time (min) | Slope (%) | Furrow width (m) | Furrow length(m) | Discharge (l/sec) | LY (qu/ha) | Seed yield (qu/ha) | |
|---|---|---|---|---|---|---|---|---|---|---|---|---|
| Furrow length (m) and flow rate (l/sec) | T0.5L | TL | ||||||||||
| 1 | 10 m_Qmax_50% | 43.8 | 55.6 | 0.89bc | 1.44 | 3.09 | 0.53 | 0.9 | 10 | 0.8 | 54.8c | 35.6c |
| 2 | 10 m_Qmax_75% | 56.6 | 49.6 | 0.78c | 3.15 | 7.17 | 0.53 | 0.9 | 10 | 1.2 | 59.3bc | 31.2c |
| 3 | 10 m_ Qmax _100% | 38.3 | 68.1 | 0.85bc | 4.12 | 3.07 | 0.53 | 0.9 | 10 | 1.6 | 62.1abc | 34.5c |
| 4 | 30 m_ Qmax _50% | 64.1 | 61.6 | 0.93bc | 6.7 | 30.35 | 0.53 | 0.9 | 30 | 0.8 | 67.2ab | 37.2c |
| 5 | 30 m_ Qmax _75% | 58.3 | 61.1 | 1.03b | 2.58 | 6.35 | 0.53 | 0.9 | 30 | 1.2 | 68.6a | 41.2bc |
| 6 | 30 m_ Qmax _100% | 61.2 | 78.1 | 0.97bc | 4.97 | 19.66 | 0.53 | 0.9 | 30 | 1.6 | 67.2ab | 38.6c |
| 7 | 50 m_ Qmax _50% | 51 | 54.4 | 0.82c | 14.75 | 28.92 | 0.53 | 0.9 | 50 | 0.8 | 64.7ab | 33.2c |
| 8 | 50 m_ Qmax _75% | 65 | 84.4 | 1.37a | 16.49 | 40.5 | 0.53 | 0.9 | 50 | 1.2 | 68.6a | 55.1a |
| 9 | 50 m_ Qmax _100% | 42.5 | 74.1 | 1.25a | 11.46 | 26.8 | 0.53 | 0.9 | 50 | 1.6 | 68.2a | 50.3ab |
| Lsd (0.05) | 0.19 | 8.5 | 11.3 | |||||||||
| CV | 14.8 | 11.3 | 24.4 | |||||||||
DU=Water Distribution Uniformity (%), WP=Water productivity, AE=Application Efficiency, DU= Distribution Efficiency (%), T0.5 L=Advance time in minutes at the middle of the furrow length, TL=Advance time in minutes at the end of the furrow length
Interaction effect of furrow length and inflow rate on cotton lint and seed yield was found to be significant (P ≤ 0.05). Highest lint yield 68.6 qu/ha was obtained from combination of 50 m furrow length and 1.2 lit/s inflow rate. The least yield 54.8 qu/ha was obtained from combination of 50 m furrow length and 0.8 lit/s inflow rate. Cotton lint yield, seed yield and water productivity were highly affected by interaction effect of furrow length and inflow rate. Lint and seed yield was also affected by inflow rate and furrow length. Given this and other economic benefits, it can be conclude that longer furrow length and moderate inflow rate is better for cotton production [25-31].
Efficient application and distribution of water by furrow irrigation is dependent on furrow parameters such as flow rate, soil textural class, field slope, soil infiltration characteristics, roughness coefficient, and irrigation management. To address these issues, the first priority is to improve irrigation water management. There is limited quantitative data on the Amibara irrigation scheme's system performance and water management. Therefore, the objective of this study was to generate information on furrow variables specifically flow rate and furrow length and their combination to enhance irrigation efficiency for cotton production.
The authors are grateful to Ethiopian Institute of Agricultural Research, for providing funds for the experiment and technical support. The authors are also indebted to were agricultural research centre for all staff of irrigation and water harvesting research program.
[Crossref][Googlescholar][Indexed]
Irrigation & Drainage Systems Engineering received 835 citations as per Google Scholar report


