Research - (2021) Volume 10, Issue 3
Received: 11-Jan-2021
Published:
17-Mar-2021
, DOI: 10.37421/2168-9768.2021.10.256
Citation: Belay Yadeta, Mekonen Ayana, Muluneh Yitayew, Tilahun Hordofa. Comparison of Measured and Estimated Sugarcane Water Requirement under Arid and Semi-Arid Climatic Condition: The Case of Wonji Shoa Sugarcane Plantation, Ethiopia. Irrigat Drainage Sys Eng 10 (2021): 256.
Copyright: © 2021 Yadeta B, et al. This is an open-access article distributed under the terms of the Creative Commons Attribution License, which permits unrestricted use, distribution, and reproduction in any medium, provided the original author and source are credited.
Sugarcane is one of the most important commercial crops cultivated mostly on the large scale basis all over the world from arid to semi-arid climate condition like Ethiopia. Wonji shoa sugarcane plantation was the first large scale irrigation in Ethiopia. But sugarcane crop is the most water intensive crop that requires critical determination of its evapotranspiration. Determination of crop evapotranspiration is more accurate through experiment but experiment was not mostly undertaken due to high cost, lack of instruments and laboratory facilities, and time it required. But to overcome those problems, some models were developed as an option in determining the crop evapotranspiration. In line with this, the current study focused on the performance evaluation of sugarcane evapotranspiration determined by different models as compared to the lysimeter experiment under study area. The main objective of this study was to analysis the variation of sugarcane evapotranspiration measured from the lysimeter experiment and that determined using different models under the current study climatic condition. In the current study, Blaney-Criddle, Drooger and Allen, Hargreaves, Irmak, Tabari and Thornthwaite were selected. The selected models were required only few climatic parameters. After reference evapotranspiration was determined by each selected models, the sugarcane evapotranspiration was determined by multiplying those reference evapotranspiration by crop coefficient recommended by FAO-56. The performances of those models were evaluated using the most commonly used statistical indices. Those statistical indices used were RMSE, MBE, t-test, R2 and IA. After all the data computed by each selected models the analysed, Blaney-Criddle model was the best model in determining the sugarcane evapotranspiration as compared to the lysimeter experiment followed by Irmak models. Therefore, from the current findings, it can be concluded that Blaney- Criddle model can be used to determine sugarcane evapotranspiration under current study climatic condition.
Crop Coefficient • Crop Evapotranspiration • Lysimeter experiment • Reference Evapotranspiration Model • Performance evaluation • Sugarcane
Water scarcity is a major challenge facing a lot of nations especially the developed countries due to climate change, increasing demand of freshwater by different sectors and more importantly environmentally induced problem such as overexploitation of existing water resources and desertification [1]. Future agricultural production depending on rainfall especially in the developing countries faced major constraints due to the shortage of rainfall as a result of climate change and mismanagement of available water resources present for sustainable agricultural production. Globally, irrigated agricultural consumption accounts about 80% of the available fresh water resources. But the availability of the freshwater resource is considerably decreasing from time to time due to increased competition on it from time to time [2,3].
Sugarcane is a water intensive crop in which the irrigation water becomes increasingly scarce resource particularly due to high competition on water resources from different sectors. But due to its increased demand, there is a need to optimize sugarcane productivity not only per unit of land but also per unit of water. Sugarcane is a perennial and water intensive crop that requires irrigation in most of the time but the magnitude of irrigation is influenced by geographic location and climatic conditions of the area [4]. Water requirement of sugarcane varies from 1200 to 3500 mm depending on soil types, crop growing duration and the climatic conditions of the area [5]. Scarcity and growing competition for fresh water resource reduce water availability of water for irrigation. Not only availability of the irrigation water but also irrigation efficiency is dominant factor controlling agricultural production on the large scale bases like sugarcane estate. To increase the efficiency of irrigation, especially for surface irrigation, an accurate estimation of crop water requirements in irrigated agriculture is essential for effective planning and management of water resources. In semiarid areas, agricultural consumptive uses are relatively high, so that saving small percentages brings an extra availability of significant volumes of water [6].
In the arid and semi-arid climatic condition, water resource scarcity is the most limiting factor for crop production due to low and erratic rainfall which limits rain fed agricultural productivity and resulted in high risk of agricultural production Irrigation. Irrigation water is becoming increasingly scarce and its development system with efficient use is essential for sustainability of highly demanded crops produced for commercial purpose. Efficient management of irrigation water involves precise irrigation scheduling which accomplished through an accurate crop water requirement determination. Irrigation is a practice to apply water to the root zone of a crop to reach field capacity. Water use efficiency is driven by three factors, the specific amount of water applied, the timing of the application and the efficiency of the irrigation method. Irrigation scheduling aims for yield maximization, high irrigation efficiency and crop quality improvement by adding appropriate amount of irrigation water to the crop in order to bring the soil moisture to the desired level.
Evapotranspiration (ET) is the combination of evaporation from open surface and plant transpiration which are crucial processes in the hydrologic cycle. In other words, Evapotranspiration defined as the combined loss of water from a given area and during a specified period of time by evaporation from the open surface and by transpiration from plants. Accurate prediction of ET is essential for the estimation of the water budget and the management of water related environmental systems. Crop water use is generally estimated by multiplying the reference evapotranspiration by pre-determined crop specific coefficient. Many authors in the related field of study forwarded to develop a standard, precise and globally acceptable method of estimating reference evapotranspiration for accurate computation of crop water requirements. There were many models developed to estimate reference evapotranspiration (ETo) in environments that lack direct ETo measurements. A major complication in ETo estimation using these models is there meteorological data requirement may not be easily available. This restriction at time prohibits the use of more accurate models and necessitates the use of models that have less demanding meteorological data requirements. An international scientific community has accepted the FAO-56 Penman Monteith (FAO-56PM) model as the most precise one for its good results when compared with other models in various regions of the entire world. Estimation of reference ETo by globally accepted FAO56- PM requires many weather parameters like maximum and minimum temperature, solar radiation, sunshine hours, wind speed and relative humidity. However, for many locations, such meteorological variables are often incomplete and/ or not available.
Reference evapotranspiration determination from weather data has been used in different applications of crop water requirement and irrigation water management. Generally, indirect methods are used to determine the ETo but the most accurate methods are direct method through the use of the experiment like lysimeter. The main problems of such like experiments are high installation and maintenance cost, time consumption and lack of precise instrumentation and laboratory facilities. To overcome those, there are many number of models developed in the past decades which quantify ETo. Therefore, the current study was focused on the evaluation of the sugaracne evapotrranpiration determined by lysimeter experiment as compared to selected models. Inline with this the main purpose of this study wasto analysis the variation of sugarcane water requirement computed from the lysimeter experiment and estimated using different models under the current climatic condition.
Description of Wonji Shoa sugarcane plantation estate
Wonji Shoa is located in the South East Shoa of Oromia regional state far 110 km from Addis Ababa, capital city of the country, Ethiopia. The Wonji shoa sugarcane estate is situated at 8021’- 8029’ N and 39012’- 39018’E at an altitude of 1550m.a.s.l. Wonji Shoa is characterized by very gentle and regular topography that makes it most suitable for irrigation. Sugarcane is grown in the area mostly as mono crop. The climate of the area is characterized as semi-arid with main rainy season take place between months of June to September. The rainfall of the area is erratic both in quantity and distribution. The area receives mean annual rainfall of 831mm with mean annual maximum and minimum temperature of 27and 15oC respectively. The soil of Wonji shoa varies from sandy loam to heavy clay types.
Wonji shoa was the first commercial large scale irrigation scheme in the history of Ethiopia irrigation development. It was established in 1951 at Wonji by Netherland’s Hende rVerneering Armestadam (H.V.A.) Company private investors and Ethiopian government. When the factory started production in 1954 its initial production was 1400qunt/year. At the start, the share company had five thousand hectares of land for its sugarcane cultivation. Then after, Wonji Shoa Sugar Factory capacity is increased from time to time and in 1962 with the production of 1,700quint/day.
The two factories known by the name Wonji Shoa Sugar Factory altogether had the capacity of producing 750,000 quintals of sugar per year till recent time (prior to the completion of the new Wonji Shoa Sugar Factory). Serving for more than half a century and getting obsolete, these two Wonji and Shoa sugar factories were closed in 2011 and 2012 respectively. Replacing these pioneer factories, the new and modern factory had started production in 2013 with higher production capacity (Figure 1).

Figure 1. Map of the study area: A) Ethiopia, B) Oromia region, C) West shewa zone and D) Wonji shoa sugarcane plantation Estate).
Data collection
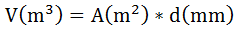
Irrigation water was always applied before the soil moisture reached the soil moisture depletion factor. Since the experiment was conducted to develop the crop coefficient at optimum growing condition, irrigation water was applied based on the available soil moisture depleted from the crop root zone. The soil moisture in the crop root zone was regularly monitored by using gravimetric methods for the depth above 15cm and the depth below this monitored by neutron probe since in the upper depth it sense the amount of moisture present in the atmosphere. Then the volume of irrigation water applied to compensate the amount of water lost in the form of crop evapotranspiration was calculated as
 (1)
(1)
Where: V = volume of irrigation water applied, A = Area of the lysimeter (m2), d = depth of irrigation to be applied (mm)
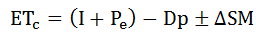
The sugarcane water requirement was computed from directly measuring the amount of water evapotranspired from the lysimeter and deep percolated beyond the crop root zone by including the change soil moisture as
 (2)
(2)
Where: ETc= Crop evapotranspiration (mm/day), I = Irrigation Applied water, Pe = effective rain fall (mm), Dp = Deep percolation (mm), ΔSM = change in soil moisture
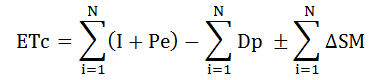
The change in soil moisture always monitored using gravimetric method and neutron probe to overcome the problems of over irrigation or under irrigation that highly influence the yield of sugarcane. The amount of water percolated below the crop root zone (DP) was measured by gauged cylindrical cup from the lysimeter drainage hole. The total amount of water consumed by the crop from planting date to harvesting date was computed by the following equation (3)
 (3)
(3)
The amount of rainfall which effectively consumed by crops out of the total amount of rain fall was computed by CROPWAT 8.0 model.
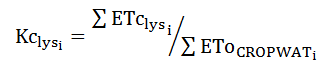
The reference evapotranspiration was determined using CROPWAT 8.0 model from MARC meteorological station. The climatic data input required for the model were Temperature, Humidity, Sunshine hours and Wind speed. Those collected climatic parameters were also used to determine the sugarcane evapotranspiration by selected models as the same time. All climatic parameters were prepared according all the selected model inputs required separately. After all the climatic parameters prepared, reference evapotranspiration was determined. The sugarcane crop coefficient was developed as the ratio of sugarcane water requirement directly measured from the lysimeter and ETo computed by CROPWAT 8.0 model. The sugarcane evapotranspiration was continuously measured from the lysimeter experiment and reference evapotranspiration determined by CROPWAT 8.0 model and finally, the sugarcane crop coefficient was computed using equation (4).
 (4)
(4)
Where: Kclysi = sugarcane crop coefficient determined at each growth stages, ETclysi= sugarcane water requirement measured from lysimeter at each growth stages, ETocropwati = reference evapotranspiration determined using CROPWAT 8.0 model
In this study, sugarcane water requirement also determined using different selected models. From the collected climatic parameters, reference evapotranspiration was determined by each selected models. Since the crop evapotranspiration computed using the ETo multiplied with Kc value. The sugarcane Kc value was adopted from FAO recommendation at each growth stages. The selected models based on the availability of climatic data were Blaneycriddle, Drooger and Allen, Hargreave, Irmak, Tabari and Thornthwaite. Those models are based on temperature and radiation models in which those climatic parameters relatively accessible and not requires many data inputs like CROPWAT crop models to compute the reference evapotranspiration.
Blaney-Criddle Model
Blaney and Morin first developed an empirical relationship between evapotranspiration and mean air temperature, average relative humidity and mean percentage of day time hours. Blaney and Criddle later modified this relationship by excluding humidity term. The basic assumption was that evapotranspiration varies directly with the sum of the products of mean monthly air temperature and monthly percentage o fannual day time hours for an actively growing crop with adequate soil moisture. Those authors described by citing Doorenbos and Pruitt, the most fundamental revision of the Blaney-Criddle model by FAO-24 and estimate a grass related reference crop evapotranspiration. The Blaney-Criddle model is given by equation (5)
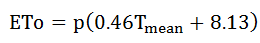 (5)
(5)
Where: Tmean= mean temperature, P = Mean daily percentage of total annual day time hours, Tmax = summation of all maximum temperature of the month divide by number of days of the months, Tmin = summation of all minimum temperature of the month divide by number of days of the months
Drooger and Allen Model
This model was developed to estimate the daily or monthly reference evapotranspiration as a function of air temperature and solar radiation. This is computed by equation (6).
 (6)
(6)
Hargreaves Model
Hargreaves and Samani proposed several improvements for the Hargreaves equation for estimating grass related reference ET. Because solar radiation (Rs) data frequently are not available, Hargreaves and Samani recommended estimating Rs from extra-terrestrial radiation (Ra) and the difference between mean monthly maximum and minimum temperatures as stated by[15] given by equation (7).
 (7)
(7)
Irmak model
This model also used to compute the daily or monthly reference evapotranspiration as a function of air temperature and solar radiation given by equation (8).
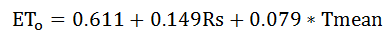 (8)
(8)
Abarimodel
Finally, this model was used to compute the daily or monthly reference evapotranspiration as a function of mean air temperature and solar radiationgiven by equation (9).
 (9)
(9)
For all models requires solar radiation
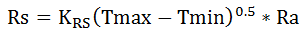 (10)
(10)
Where: KRS = adjusted coefficient = 0.16
Thornthwaite model
Thornthwaite model has been widely criticized for its empirical nature but is widely used. Because Thornthwaite model estimating ETo can be computed using only temperature, it has been one of the most misused empirical equations in arid and semi-arid irrigated areas where the requirement has not been maintained given by equation (11).
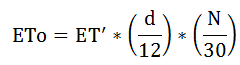 (11)
(11)
To compute this, the following should be first computed
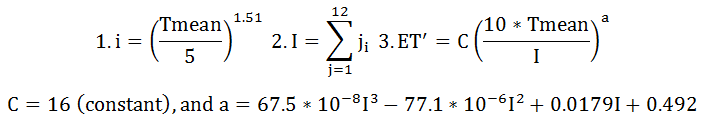
Where: i = monthly heat index for the month j, (0 when the mean monthly temperature is 0°C or less), I = annual heat index, Ta = mean monthly air temperature (0°C), j = number of months (1 - 12),ET' = unadjusted monthly potential evapotranspiration based on a standard month of 30 days,12 hr of sunlight/day, ET' are adjusted depending on the number of days N in a month (1 ≤ N ≤ 31),d = duration of average monthly day light (hr) andN = number of days in a given month (1 - 31 days).
After the reference evapotranspiration was computed by all those models, the sugarcane water requirement was computed using the recommended sugarcane Kc. The sugarcane evapotranspiration was computed using crop coefficient developed by FAO using the following equation (12).
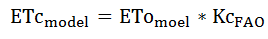 (12)
(12)
Where: ETcmodel=sugarcane water requirement computed from models, KcFAO=sugarcane crop coefficient recommended by FAO, ETomodel = reference evapotranspiration determined by each models
The sugarcane water requirement computed by different models was compared with the measured water requirement from lysimeter experiment and one model which is relatively similar to the experiment was recommended for this climatic condition.
The sugarcane evapotranspiration determined by lysimeter experiment and computed by CROPWAT 8.0 model from different ETo models were arranged for selection of the best models for the current study climatic condition. The performance of different models used to determine sugarcane evapotranspiration was evaluated using different statistical indices adopted fromas compared to the lysimeter expirement. The most common performance evaluation indices were
Root mean square error (RMSE)
Root mean square error index was used to measure the tendency of error occurred in the models in determining the sugarcane evapotranspiration by lysimeter (ETclys) as compared to the models (ETcmodels).The magnitudes of RMSE values are useful to identify model performance but not of under or overestimation by individual model. The optimum value for RMSE is zero
which computed as equation (13).
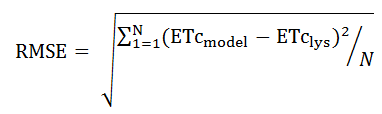 (13)
(13)
Mean bias error (MBE)
The mean bias error indicates whether the selected models over estimated or under estimated the sugarcane evapotranspiration. Mean bias error positive value indicates overestimation (ETcmodels>ETclys) and negative value indicates (ETcmodels<ETclys) underestimation but the optimal value for MBE is zero computed by equation (14).
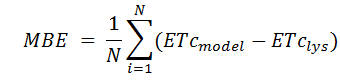 (14)
(14)
T-test
The models assess based on RMSE and MBE alone may be misleading in the absence of t-value. The t-statistics should be used in conjunction with MBE and RMSE error to better evaluate model performance. Finally t-statistics indicator can be view as supplement of MBE and RMSE error in supporting models to determine whether or not model estimate are statistically significant at particular confidence level. The optimal value of t-test is zero or very small which computed by equation (15).
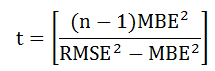 (15)
(15)
Where: MBE = Mean bias error, RMSE = Root mean square error, n = Number of observations.
Coefficient of determination (R2)
The coefficient of determination is useful because it gives the proportion of the variance (fluctuation) of one variable that is predictable from the other variable. It is a measure that allows us to determine how certain one can be in making predictions from a certain model. Coefficient of determination ranges 0 ≤ R2 ≤ 1 but the model is accepted if the value is greater than 0.6 which indicates the strength of linear association between measured ETc by lysimeter and by different models. The R2 was computed by the following equation (16)
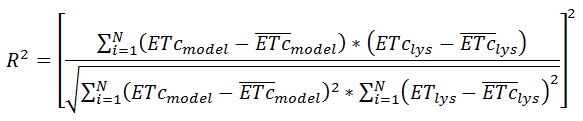 (16)
(16)
Index of agreement (IA)
Index of agreement provides a relative measure of the error alloying cross comparison of the model Index of agreement was used to measure a tendency of agreement between ETc computed by lysimeter and selected different models. The performance of the model was good if value of IA ≥ 0.95 but if the value was 1, there was a perfect agreement between the two which computed by equation (17).
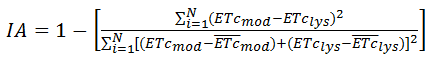 (17)
(17)
Finally, the variation in sugarcane evapotranspiration measured by lysimeter and computed using different models were analyzed and the best model fits to the experiment was recommended for this climatic condition.
Analysis of sugarcane crop evapotranspiration from lysimeter
Sugarcane crop evapotranspiration was directly measured from the lysimeter experiment based on the soil water balance analysis. In the process most of the soil water balance components: surface and subsurface inflow and out flow as well as ground water contribution were neglected because they are controlled by the lysimeter. The sugarcane evapotranspiration computed from lysimeter experiment ranges from 1.63mm/day to 7.13mm/day throughout crop growing season. This study relatively agrees with the studies conducted by different researcher at different time in different places. The study conducted by indicated that the sugarcane crop evapotranspiration ranges from 1.05 to 7 mm/day. The other studies conducted by [23] found that ETc of sugarcane ranges from 2 to 6mm/day and by ranges from 1.59 and 5.85 mm/day which was lower than the current study. The findings of most studies were similar with current study in determining sugarcane crop evapotranspiration but a few of them was lower than the current study. The sugarcane crop evapotranspiration measured during the growing period of the crop presented in (Figure 2).

Figure 2. Sugarcane evapotranspiration determined by Lysimeter (mm/ month).
Determination of Reference Evapotranspiration by Selected Models
The sugarcane evapotranspiration was determined from the reference evapotranspiration determined using different ETo models and Kc adopted from FAO recommendation. In the current study, first ETo was determined by selected models before the sugarcane evapotranspiration determined by corresponding models. The following models were selected to determine the reference evapotranspiration under the current study location.
Blaneycriddle model
Determination of reference evapotranspiration by this model required only temperature and sunshine hour data. Based on those data collected from the study area, the reference evapotranspiration was determined (Figure 3).

Figure 3. Determination of reference evapotranspiration by different selected models.
Drooger and Allen model
Determination of reference evapotranspiration by this model required only temperature and solar radiation data. Based on those data collected from the current study area, the reference evapotranspiration was determined was determined (Figure 3).
Hargreaves model
Determination of reference evapotranspiration by this model required only temperature and solar radiation data. Those required data were collected from the current study area and reference evapotranspiration was determined was determined (Figure 3).
Irmak model
Determination of reference evapotranspiration by this model required only temperature and solar radiation data. Based on those data collected from the current study area, reference evapotranspiration was determined (Figure 3).
Tabari model
Determination of reference evapotranspiration by this model required only temperature and solar radiation data. Based on those data collected from the current study area, reference evapotranspiration determined by this model was presented in the (Figure 3).
Thornthwaite model
Determination of reference evapotranspiration by this model required only temperature data. Based on those data collected from the current study area, the reference evapotranspiration was determined (Figure 3).
Determination of Sugarcane evapotranspiration by selected models
In this study, six models were selected to determine the sugarcane evapotranspiration as compared to the experimentally measured using lysimeter experiment. The sugarcane crop coefficient was adopted from FAO- 24 modified to FAO-56 recommendation. Based on this recommendation the Kc values for sugarcane were 0.40, 1.20, 1.25 and 0.75 at emergence and development, Tillering, grand formation and ripening growth stages respectively. Based on those recommended Kc values and ETo determined by each selected models, the sugarcane evapotranspiration was determined.
Blaney-Criddle model
The reference evapotranspiration using this model was determined as indicated in the (Figure 3) and sugarcane Kc value was taken from FAO recommendation. After ETo and Kc were obtained, sugarcane evapotranspiration was determined on monthly basis and presented in the (Figure 4) below as compared to the lysimeter experiment.As the result obtained revealed that, the sugarcane evapotranspiration obtained using this model resembles at almost similar to the lysimeter experiment except at ripening growth stages which under estimate it. From the selected models, this model is the most accurate model as compared to the lysimeter experiment. This indicates if the crop water requirement applied based on this model it may not cause yield reduction in sugarcane crop because at ripening growth stages by its nature the sugarcane not requires more water.

Figure 4. Sugarcane evapotranspiration determined by Blaney-Criddle model.
As it is indicated in the figure 4 above the sugarcane evapotranspiration determined by this model was almost similar with the result obtained from the lysimeter experiment in the current study. Similar to this study, the study conducted byindicated that Blane-Criddle model is the best model that can be used alternatively with the FAO-PM in determining the reference evapotranspiration. Similarly the other study conducted by ona statistical Comparison of Reference Evapotranspiration Methods revealed that Blaney- Criddle model is the better performance relative to the other models selected as copmared to the FAO-PM on determination of ETo.
Drooger and Allen model
The reference evapotranspiration was determined using Drooger and Allen model as indicated in the (Figure 3) and sugarcane Kc value was taken from FAO recommendation to determine the sugarcane evapotranspiration. The sugarcane evapotranspiration was determined on monthly basis and presented in the (Figure 5) below as compared to the lysimeter experiment. The sugarcane evapotranspiration determined using this model throughout the crop growing season was greater than the lysimeter experiment. If irrigation water was applied based on this model, it resulted in over irrigation which may cause the adverse effect on the crop yield as well as water logging problems which finally affect the soil productivity in the future. On the large scale irrigation like wonjishoa sugarcane plantation, such model wasnot recommended to use in determining the sugarcane evapotranspiration because it causes water logging problems throughout the growing period of the crop and may also resulted in the development of salinity problems. In general, based on the result obtained from the current study, this model is not recommended to use in determining the sugarcane evapotranspiration under Wonji shoa climatic condition.

Figure 5. Sugarcane evapotranspiration determined by Drooger and Allen model.
As indicated in the figure (5), the sugarcane evapotranspiration determined by this model was greater than the lysimeter experiment throughout the crop growing seasons. Similar to the current study, the study conducted indicated that the reference evapotranspitation determined by using Drooger and Allen equation over estimates as compared to the FAO-PM equation. The other study conducted indicated that in opposite to the current study findings, this model is goodwhen all the climatic parameters that required for FAO-PM equation was inaccurate in determining the ETo.
Hargreaves model
Similar to the previous models, the reference evapotranspiration using this model was determined as indicated in the (Figure 3) and the recommended Kc value of sugarcane indicated in the same manner. The sugarcane evapotranspiration was determined on monthly basis and presented in the (Figure 6) below as compared to the lysimeter experiment. The sugarcane evapotranspiration determined using this model throughout the crop growing season was greater than the lysimeter experiment. This indicated over irrigation as a result the crop become water logging and this reduces the yield of the crop because the sugarcane crop is highly sensitive to both water extremes. On the other hand if this model considered to irrigate the sugarcane crop on the large scale irrigation like wonjishoa sugarcane plantation, this cause the water logging problems throughout the crop growing period which resulted in the development of salinity problems that adversely affect the soil productivity beside to the crop yield reduction. Therefore, this model is not recommended to use in determining the sugarcane evapotranspiration under current study area climatic condition.

Figure 6. Sugarcane evapotranspiration determined by Hargreaves model.
As indicated in Figure 6, the result obtained in the current study area climatic condition on the sugarcane evapotranspiration throughout the growing period was greater than the lysimeter experiment. Similar to the current study findings, the study conducted on the evaluation of reference evapotranspiration indicated that Hargreaves model over estimates the reference evapotranspiration out of the models considered.But in opposite to the current study, the study conducted revealed that the Hargreaves model under estimates the sugarcane evapotranspiration as compared to the FAO penman monteith recommendation.
Irmak model
Also similar to the other models discussed, the reference evapotranspiration using this model was determined as indicated in the (Figure 3) and the recommended Kc value for the sugarcane. The sugarcane evapotranspiration was determined on monthly basis and presented in the (Figure 7) below as compared to the lysimeter experiment. As the result obtained revealed that, the sugarcane evapotranspiration obtained using this model was better than other models selected next to the Blaney-Criddle as compared to the lysimeter experiment but under estimate at early and late growth stages. The variation in sugarcane evapotranspiration determined by this model was lower at ripening growth stage and at this stage the crop may not affect by water stress as compared to the other growth stages. Therefore, based on the current study result as compared to the lysimeter experiment, in absence of such like expensive and time consuming experiment this model can be used to determine the sugarcane evapotranspiration under current study climatic condition.

Figure 7. Sugarcane evapotranspiration determined by Irmak model.
As indicated in the figure (7), the sugarcane evapotranspiration determined by this model was somewhat similar to that of the lysimeter experiment. The study conductedindicated that, this model is highly agreement with the grass referenced experiment by very high coefficient of determination than the other models considered which has some similarity with the current study. The other study conducted by [30] indicated that Irmak model well performed than the other twenty ETo models with very low MBE under Uttarakhand climatic condition, India.
Tabari model
In the same way, the reference evapotranspiration determined by this model indicated in the (Figure 3) and the Kc value similar to the other models used from FAO recommendation. The sugarcane evapotranspiration obtained by this model revealed that much less than the lysimeter experiment throughout the crop growing periods (Figure 8). The sugarcane evapotranspiration determined by this model under estimated throughout the crop growth stages. Since the crop is sensitive to both water extremes, if irrigation water applied based on this model it resulted in accounted yield reduction from the potential yield of the crop due to water shortage. Therefore, as compared to the result obtained by lysimeter experiment, this model is not recommended in determining the sugarcane evapotranspiration in the current study area climatic condition.

Figure 8. Sugarcane evapotranspiration determined by Tabari model.
As it indicated in the (Figure 8) the sugarcane evapotranspiration determined by this model was by far lower than the result obtained from current lysimeter experiment. Similar study conducted on the performance evaluation of reference evapotranspiration models in semiarid and arid climatic condition of Mali, indicated that Tabari model performance lower than the other models considered by under estimating the ETo.
Thornthwaite model
In the same way, the reference evapotranspiration determined by this model indicated in the (Figure 3) and the Kc value similar to the other models used from FAO recommendation to determine the sugarcane evapotranspiration. The result obtained from this model revealed that the sugarcane evapotranspiration determined was less than the lysimeter experiment throughout the crop growing periods (Figure 9). This model under estimate the sugarcane evapotranspiration especially at the crop growth stage when it requires more water (grand formation) which also may cause the crop yield reduction due to the water stresses during growth periods. This model also not recommended in determining the sugarcane evapotranspiration under wonjishoa climatic condition.

Figure 9. Sugarcane evapotranspiration determined by Thornthwaite model.
As indicated in the (Figure 9) the sugarcane evapotranspiration determined by this model was lower than the current lysimeter experiment except at aerly growth stage of the crop. In opposite to the current study findings, the study conducted on the performance evaluation of different reference evapotranspiration indicated that this model is the best model as compared to the FAO-PM in determing the ETo.
Performance evaluation of the models
In the current study, different statistical indices were used to evaluate the performance of the selected reference evapotranspiration models as compared to the CROPWAT 8.0 model. The evaluation of those models was used to select the best models that best fit with the experiment in determining the sugarcane evapotranspiration. From many statistical indices used to evaluate the performance of selected models, the most frequently used were root mean square error (RMSE), mean bias error (MBE), t-test, coefficient of determination (R2) and Index of agreement (IA). The values of those indices for each selected models were worked out and presented in Table 1.
| Models | RMSE | MBE | t-test | R2 | IA |
|---|---|---|---|---|---|
| Blaney-Criddle | 5.71 | -0.13 | 0.01 | 0.67 | 0.86 |
| Drooger and Allen | 13.86 | 2.3 | 0.34 | 0.90 | 0.29 |
| Hargreaves | 12.57 | 1.87 | 0.29 | 0.01 | 0.41 |
| Irmak | 6.21 | -0.62 | 0.13 | 0.62 | 0.85 |
| Tabari | 14.83 | -2.49 | 0.38 | 0.85 | -1.36 |
| Thornthwaite | 10.35 | -1.54 | 0.29 | 0.00 | 0.03 |
From the selected reference evapotranspiration models, the best model was selected based on the value of statistical indices recommended. The selection criteria were lower RMSE and MBE which is zero or near to zero and higher R2 and IA with lower t-test value. The values of RMSE ranges from 5.71 to 14.83 in all models considered. Based on the RMSE values Blaney-Criddle model (5.71) performed better followed by Irmak model (6.21) as compared to the CROPWAT 8.0 model in the current study area. The current study result was similar with the study conductedon Comparitive evaluation of different potential evapotranspiration estimation approaches in which Blaney- Criddle model perforced better than all other models selected.Based on MBE, Blaney-Criddle, Irmak, Tabari and Thornthwaite models under estimated and Droogen and Allen and Hargreaves models over estimated the reference evapotranspiration in the current study climatic condition.In generally, based on the result obtained on the performance evaluation of selected reference evapotranspiration models in the current study area climatic condition, Blaney- Criddle models was the best model as compared to the other models with low RMSE (5.71) and t-test (0.01) and high R2 (0.67) and IA (0.86).Next to the Blaney-Criddle, Irmak was better model with low RMSE (6.21), t-test (0.13) and high R2 (0.62) and IA (0.85). But both of them under estimate the crop water requirement as indicated by the negative values of MBE.Therefore, from the current study findings, it can be recommended that Blaney-Criddle model will be used alternatively by CROPWAT 8.0 model in determining the reference evapotranspiration under Wonji shoa climatic condition. Therefore, in case where all climatic parameters required for the CROPWAT models are not available to determine ETo, Blaney-Criddle model can be used.
Now days, irrigation water resource all over the world decreasing from time to time in opposite the water demand increased by different sectors from time to time. From the highly increased water requirement sectors, irrigation expansion and its water consumption in developing countries is the one which critically focused by the government like Ethiopia. Since irrigation water consumption is more, to save some amount of water that lost due to excess application to the crops which requires more amount of irrigation water, determination of accurate crop water requirement is very important in irrigated field especially in the large scale irrigation like Wonji shoa sugarcane plantation. Sugarcane evapotranspiration is determined directly using different scale experiments or indirectly using models from the climatic parameters. In the current study, the sugarcane evapotranspiration was determined using lysimeter experiment and the result obtained by this experiment was compared with different models. FAO penman monteith model is the widely accepted model to determine the reference evapotranspiration. But this model requires many climatic parameters which are not obtained at all location. Therefore, the current study was focused on the determination of reference evapotranspiration by selected models which require few climatic parameters as compared to the CROPWAT 8.0 model. The main purpose of the current study was to analyse the variation of sugarcane evapotranspiration determined by lysimeter experiment as compared to the selected models. In the current, sugarcane evapotranspiration was directly computed from lysimeter experiment and six reference evapotranspiration (ETo) models which required few climatic parameters were selected. The selected models were Blaney-Criddle, Drooger and Allen, Hargreaves, Irmak, Tabari and Thornthwaite. After ETo determined by each selected models, sugarcane evapotranspiration was determined by multiplying reference evapotranspiration with the crop coefficient recommended by FAO. To select the most accurate models as compared to the experimentally determined sugarcane evapotranspiration, the performance of the models were evaluated using statistical indices.The most common statistical indices used to evaluate the performance of the selected models were RMSE, MBE, t-test, R2 and IA. The computed average sugarcane evapotranspiration were 2.34 mm/day at emergence and germination growth stage, 4.02 mm/day at tillering growth stage, 5.58 mm/day at grand formation growth stage and finally 5.38 mm/day at ripening growth stage. Those sugarcane evapotranspiration was computed on the monthly basis for the growing season of the crop. The sugarcane crop coefficients recommended by FAO were 0.40, 1.02, 1.25 and 0.75 at each growth stages respectively. Those Kc values were used to determine the sugarcane evapotranspiration. In the same way of the experiment, sugarcane evapotranspiration that computed by each models were based on the monthly basis. After the performance of sugarcane evapotranspiration determined was evaluated, Blaney-Criddle model was the best model followed by Irmak model. Therefore, from the current study findings, it is concluded that Blaney-Criddle model can be used to determine sugarcane evapotranspiration. Specifically, at current study area this model can be used by considering the crop coefficient developed at this specific area.
We are grateful to Adama Science and Technology (ASTU) and Ambo University for the financial support of this research. We would like to acknowledge to Melkassa Agricultural Research Center, Wonji Shoa Sugarcane Plantation Estate and Ethiopia Sugar Research and Development, Wonji Center. We cannot list all of them but heartfelt thanks to Melkassa Agricultural Research Center staffs specially, water resource and drainage department, Wonji Shoa sugarcane plantation estate specially, plantation department and Ethiopia sugar research and development Wonji center staffs.
Irrigation & Drainage Systems Engineering received 835 citations as per Google Scholar report


