Research Article - (2022) Volume 10, Issue 6
Received: 25-Mar-2022, Manuscript No. JBES-22-56732;
Editor assigned: 28-Mar-2022, Pre QC No. P-56732;
Reviewed: 12-Apr-2022, QC No. Q-56732;
Revised: 25-May-2022, Manuscript No. R-56732;
Published:
01-Jun-2022
, DOI: 10.37421/2332-2543.2022.10.428
Citation: Asuquo I.E, Akpan I.I, Abiaobo N.O and George I.E, et al. "Biodiversity and Abundance of Fish Species in Ekpene Ukpa River, a Tributary of Qua Iboe River Estuary, Niger Delta, Nigeria ." J Biodivers Endang Spec 10 (2022) : 428.
Copyright: © 2022 Asuquo I.E, et al. This is an open-access article distributed under the terms of the Creative Commons Attribution License, which permits unrestricted use, distribution, and reproduction in any medium, provided the original author and source are credited.
The diversity and abundance of fish species in Ekpene Ukpa River were studied from July-October, 2020. Sampling was by direct observation of the fish species at the sampling sites following landing by fishermen. Frequency, counts, and percentages were employed to determine the fish species composition and abundance, while a Microsoft Excel 2003 based program was used to determine the ecological indices. A total of 84 species belonging to seven (7) families were recorded. The most abundant grouping of fish species was Chrysichthys auratus with 25.0% and the least in abundance were Pellonula leonensis and Trachinotus teraia with 1.19%, respectively. The Index of Preponderance (IP) value of 0.06 was recorded for Chrysichthys auratus which makes this species very significant in the study site. The study revealed that species richness and diversity was high in October. An inclusive management approach is recommended, such as educational awareness, involving of the local contents, and comprehensive rational planning on the management and development of the study site.
Diversity • Abundance • Species • River • Ekpene ukpa
The idea of flora-fauna biodiversity is rapidly growing; this is as a result of persistence disturbances of the natural ecosystem which has resulted in the extinction of some species, which fish is inclusive [1]. This is caused by mainly human factors [2,3]. Naturally, fauna assemblage, especially that of fish is essential, both ecologically and nutritionally as such its management and conservation is of great importance [4]. The high diversity of fish is probably the main source of stability to various tropical fisheries and this gives a serious concern for its conservation [5].
Presently, fish diversity and its environmental management is a vital point to be considered and the ability to analyze the problems associated with its environmental distortions and various other impacts on its population dynamics require a total and comprehensive survey of the fish population before and after assessment [6]. This could only be achieved through a critical survey of its composition [7-10].
Several surveys on the fish diversity and abundance of some water bodies around the Niger Delta have been carried out by several scientists but there is a dearth of information on the baseline survey of fish fauna in Ekpene Ukpa River, a segment of Qua Iboe River estuary, Niger Delta. This study aims at developing a baseline survey of fish fauna assemblage of the water body [11,12].
Study area
The study was conducted in Ekpene Ukpa River (Latitudes 50049’N and Longitude 70052’E) within the tropical rainforest of Niger Delta region, Nigeria. The river is the mainstay of livelihood among the locals of the surrounding community. Presently, the system is seriously impacted upon due to the construction of a carriage bridge across the water body, sand dredging of the water body, and other nonconventional fishing operations.
Data collection
The study was carried out for a 4 month period (July-October, 2020). The study area was characterized by heavy impartation of anthropogenic perturbations on the aquatic ecosystem. Sampling was by direct observation of the fish at the landing sites. The fish were sorted accordingly into family and species levels. Fish species that could not be identified insitu, were preserved and transported in a plastic cooler box containing ice blocks and labeled for laboratory identification and analysis. In the laboratory, the fish were preserved in 2% formaldehyde solution [13]. Identification of the fish species was done according to [14-16].
Statistical analysis
All members of a species were physically counted, to establish the morphometric characteristics and recorded monthly. The Simpsons Dominance index, D; Shannon-Weiner Diversity index; Margalefs species richness, d; Shannon-Weiner Index, H, Eveness, E; Dominance Index, C, as in Odum were employed to evaluate the trend in fish community structure as calculated below:
Margalef Index (d), this is a diversity index, which is largely dependent on species richness
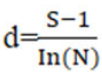
Where d=Diversity index
S=Number of Species
N=Number of individual
ln=Natural Logarithm
Shannon Index (H')
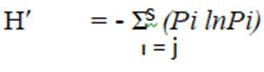
Where, H=Shannon diversity index
Pi=proportion of species i
Shannon-Wiener Index (H)
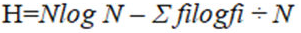
Where fi=Observed proportion of individuals that belong to the ith species.
Log N=Natural Logarithm
N=Total number of individuals for all species
Species Evennes (E): This is a measure of how evenly an individual are distributed among the species present in a sample. It ranges from 0 - 1
Where, E=Equitability measure
H=Shannon-Wiener Index
Hmax=Number of species in the sample
Simpson’s Dominance Index (C): This is the best known of the second group of heterogeneity indices referred to as measures of dominance. They are weighted towards the abundance of the commonest species.
Where Pi is the proportional abundance of the ith species
That is,

ni=Number of individuals of the ith species
N=Total number of individuals for all species
Table 1 shows the total number of fish species caught on a monthly basis in Ekpene Ukpa River. A total of 84 species were collected. The highest number of fish species was recorded in October; this month also recorded the highest number of individual species. July recorded the lowest number of fish species and individual species.
| Species | Common name | July | August | September | October | Trade name |
|---|---|---|---|---|---|---|
| Caranx hippos | Crevalle jack | 4 | 2 | - | 1 | None |
| Ethmalosa fimbriata | Bonga | 4 | - | - | - | None |
| Pellonula leonensis | 1 | - | - | - | None | |
| Chrysichthys nigrodigitatus | Bagrid catfish | 2 | 3 | 6 | 10 | None |
| Oreochromis niloticus | Nile Tilapia | - | 4 | - | 8 | None |
| Oreochromis aureus | - | 4 | - | 3 | None | |
| Chrysichthys auratus | - | 4 | 5 | 2 | None | |
| Trachinotus teraia | Shortfin pompana | - | 1 | - | - | None |
| Clarias gariepinus | - | - | 4 | 3 | None | |
| Clarias anguillaris | - | - | 2 | - | None | |
| Brycinus humilis | - | - | 2 | - | None | |
| Hydrocymus humilis | - | - | 2 | - | None | |
| Labeobarbus kimberleyensis | - | - | - | 3 | None | |
| Tilapia zilli | Redbelly Tilapia | - | - | - | 3 | None |
| No. of individual | 11 | 18 | 24 | 37 | ||
| No. of species | 4 | 6 | 6 | 9 |
Table 2 shows the morphometric characteristics, relative abundance, and index of preponderance of fish species collected in the study site. The fish species collected were grouped into 7 families (Figure 1), which varied in number and composition.
| Taxonomic unit | No. | X TL (cm) |
X BW (g) |
RA% | IP |
|---|---|---|---|---|---|
| .Cichlidae | (20) | (23.81) | |||
| Oreochromis niloficus | 10 | 34.79 | 97.18 | 11.90 | 0.01 |
| Oreochromis aureus | 7 | 28.31 | 62.38 | 8.33 | 0.005 |
| Tilapia zilli | 3 | 14.41 | 41.00 | 3.57 | 0.002 |
| . Clarotidae | (32) | (38.10) | |||
| Chrysichthys nigrodigitatus | 21 | 60.57 | 234.3 | 25.0 | 0.10 |
| Chrysichthys auratus | 11 | 48.43 | 119.75 | 13.09 | 0.02 |
| . Claridae | (9) | (10.71) | |||
| Clarias gariepinus | 7 | 34.2 | 105.75 | 8.33 | 0.009 |
| Clarias angullaris | 2 | 21.7 | 53.31 | 2.38 | 0.001 |
| . Cyprinidae | (9) | (10.71) | |||
| Labeobarbus kimberleyensis | 9 | 25.15 | 42.05 | 10.71 | 0.004 |
| . Alestidae | (2) | (2.38) | |||
| Hydrocynus vittanus | 2 | 12.50 | 36.3 | 2.38 | 0.0009 |
| . Clupeidae | (5) | (5.95) | |||
| Ethmalosa fimbriata | 4 | 19.00 | 36.20 | 4.76 | 0.002 |
| Pellonula leonensis | 1 | 25.00 | 30.12 | 1.19 | 0.0004 |
| . Carangidae | (7) | 8.33 | |||
| Caranx hippos | 6 | 21.9 | 51.37 | 7.142 | 0.004 |
| Trachinotus teraria | 1 | 8.40 | 31.20 | 1.19 | 0.0004 |
The morphometric characteristics of the collected species showed that the highest mean Body Weight (XBW) was recorded for Chrysichthys nigrodigitatus, while Pellonula leonensis recorded the lowest mean Body Weight (XBW). In terms of length, the highest mean total length (XTL) was recorded for Chrysichthys nigrodigitatus, while lowest Mean Total length (XTL) was recorded for Hydrocynus vittanus.
Tables 3-6 explain the computation of diversity and dominance for the study period, that is, July, August, September and October amongst the fish group.
| Fi (Abundance) | filogfi | Filog2fi | pi | pilnopi | pi(lnpi)2 | (ni/N)2 | (ni/ni-1)/N(N-1) |
|---|---|---|---|---|---|---|---|
| 4 | 2.41 | 1.45 | 0.36 | -0.38 | 0.35 | 0.13 | 0.1080 |
| 4 | 2.41 | 1.45 | 0.36 | -0.38 | 0.36 | 0.13 | 0.108 |
| 1 | 0 | 0 | 0 | 0 | 0 | 0 | 0 |
| 2 | 0.60 | 0.18 | 0.18 | -0.31 | 0.53 | 0.033 | 0.018 |
| Σ11 | 5.42 | 3.08 | 0.9 | -1.07 | 1.25 | 0.293 | 0.234 |
| Fi (Abundance) | filogfi | Filog2fi | pi | pilnopi | pi(lnpi)2 | (ni/N)2 | (ni/ni-1)/N(N-1) |
|---|---|---|---|---|---|---|---|
| 2 | 0.60 | 0.18 | 0.11 | -0.24 | 0.54 | 0.012 | 0.006 |
| 3 | 1.43 | 0.68 | 0.17 | -0.30 | 0.53 | 0.028 | 0.02 |
| 4 | 2.41 | 1.45 | 0.22 | -0.33 | 0.50 | 0.048 | 0.04 |
| 4 | 2.41 | 1.45 | 0.22 | -0.33 | 0.50 | 0.048 | 0.04 |
| 4 | 2.41 | 1.45 | 0.22 | -0.33 | 0.50 | 0.048 | 0.04 |
| 1 | 0 | 0 | 0.06 | -0.17 | 0.47 | 0.004 | 0 |
| Σ18 | 9.26 | 5.21 | 1 | -1.7 | 3.04 | 0.188 | 0.146 |
| Fi (Abundance) | filogfi | Filog2fi | pi | pilnopi | pi(lnpi)2 | (ni/N)2 | (ni/ni-1)/N(N-1) |
|---|---|---|---|---|---|---|---|
| 6 | 4.67 | 3.63 | 0.29 | -0.36 | 0.44 | 0.08 | 0.073 |
| 5 | 3.45 | 2.44 | 0.23 | -0.34 | 0.50 | 0.05 | 0.046 |
| 4 | 2.41 | 1.45 | 0.19 | -0.32 | 0.5 | 0.04 | 0.029 |
| 2 | 0.60 | 0.18 | 0.10 | -0.23 | 0.53 | 0.01 | 0.005 |
| 2 | 0.60 | 0.18 | 0.10 | -0.23 | 0.53 | 0.01 | 0.005 |
| 2 | 0.60 | 0.18 | 0.10 | -0.23 | 0.53 | 0.01 | 0.005 |
| Σ21 | 12.33 | 8.06 | 1.01 | -1.71 | 4.05 | 0.2 | 0.163 |
| Fi (Abundance) | filogfi | Filog2fi | pi | pilnopi | pi(lnpi)2 | (ni/N)2 | (ni/ni-1)/N(N-1) |
|---|---|---|---|---|---|---|---|
| 1 | 0(23.54) | 0(19.42) | 0(0.95) | 0 | 0 | 0 | 0 |
| 10 | 10 | 10 | 0.29 | -0.36 | 0.44 | 0.084 | 0.079 |
| 8 | 7.22 | 6.52 | 0.24 | -0.34 | 0.49 | 0.058 | 0.884 |
| 3 | 1.43 | 0.68 | 0.09 | -0.22 | 0.52 | 0.008 | 0.005 |
| 2 | 0.60 | 0.18 | 0.06 | -0.17 | 0.47 | 0.004 | 0.002 |
| 3 | 1.43 | 0.68 | 0.09 | -0.22 | 0.52 | 0.008 | 0.002 |
| 1 | 0 | 0 | 0 | 0 | 0 | 0 | 0 |
| Σ34 | 1.43 | 0.68 | 0.09 | -0.22 | 0.52 | 0.008 | 0.002 |
Table 7 explains the summary of the ecological indices. The species richness (d) ranged from 1.25–2.27 across the sampling months. Shannon-Weiner Index (H); ranged between 0.54-0.84, Shannon’s Index (H) ranged between 1.07–1.75; Eveness index between 0.52-0.55; Dominance Index (c) ranged between 0.178-2.93 and Simpson’s Index (D) ranged between 0.234 -0.974 (Figure 2).
| July | August | September | October | |
|---|---|---|---|---|
| Species Richness (d) | 1.25 | 1.73 | 1.64 | 2.27 |
| Shannon-Wiener Index (H) | 0.54 | 0.74 | 0.74 | 0.84 |
| Shannon’s Wiener Diversity Index (H¢) | 1.07 | 1.74 | 1.71 | 1.75 |
| Eveness Index (E) | 0.52 | 0.59 | 0.56 | 0.55 |
| Dominance Index (c) | 2.93 | 0.188 | 0.20 | 0.178 |
| Simpson’s Index (D) | 0.234 | 0.146 | 0.163 | 0.974 |

Figure 2. Ecological indices of fish species on monthly basis.
The diversity and abundance of fish species in Ekpene Ukpa revealed moderate fish diversity. This trend of dominance exhibited by the fishes is synonymous with that observed in other segments of Qua Iboe River. The moderate fish species diversity and abundance in the river could be influenced by local fish harvest, downstream migration of fish in search of food, shelter, spawning, etc. [17]. Moreover various developmental projects around the study site may also be a factor.
The abundance of the family Clarotidae and Cichlidae tallied with the report of Idodo-Umeh in some water bodies around the Niger Delta region. The preponderance of this family in terms of number and weight could be attributed to the presence of trophic abundance such as planktonic materials [18]. Their prolific breeding capabilities and their strong adaptation to the conditions of the water system [19]. The absence of effective predators could also be attributed to the abundance of food resources in the ecosystem. The species richness and diversity were observed to be more in October being the receding of the rains and fish utilizing the expanded feeding areas, due to inundation as a result of the surface run-off. Moreover many allochthonous food materials are brought into the expanded habitats during the rains. The Shannon-Wiener’s diversity index on the monthly basis was in line with Gaines, et al. who noted that Shannon- Wiener’s diversity index ranges between 1.5-3.5 and rarely reaches 4.5. This finding clearly indicates that the fish species were much diversified in all sampling months, and this is of significance to the biodiversity of the study area [20,21]. The Index of Preponderance (IP) showed that Chrysichthys nigrodigitatus had the highest IP value of 0.1 and this agrees with who opined that IP values less than 0.10 are regarded as relatively insignificant [22].
The aquatic system is blessed with a rich aquatic fauna assemblage of fish species, which could boost the economic viability of the area, if properly managed. However, various negative factors as practiced in the area could adversely affect the system; therefore, the government should be on alert in this regard. The result obtained in this study is a baseline study to catapult other researches in this area.
Google Scholar, Crossref, Indexed at
Google Scholar, Crossref, Indexed at
Google Scholar, Crossref, Indexed at
Google Scholar, Crossref, Indexed at
Google Scholar, Crossref, Indexed at
Google Scholar, Crossref, Indexed at
Google Scholar, Crossref, Indexed at
Google Scholar, Crossref, Indexed at
Journal of Biodiversity & Endangered Species received 624 citations as per Google Scholar report