Research Article - (2022) Volume 11, Issue 11
Received: 02-Nov-2022, Manuscript No. idse-22-55675;
Editor assigned: 03-Nov-2022, Pre QC No. P-55675;
Reviewed: 16-Nov-2022, QC No. Q-55675;
Revised: 17-Nov-2022, Manuscript No. R-55675;
Published:
24-Nov-2022
, DOI: 10.37421/2168-9768.2022.11.356
Citation: Yimer, Natan Molla. “Assessment of Performance of SWAP and CROPWAT Model simulating Irrigation Water Requirement on Sugarcane Yield of Kuraz Irrigation Project.” Irrigat Drainage Sys Eng 11 (2022): 356
Copyright: © 2022 Yimer NM. This is an open-access article distributed under the terms of the Creative Commons Attribution License, which permits unrestricted use, distribution, and reproduction in any medium, provided the original author and source are credited.
The role of simulation models in understanding the processes in the soil-plant-atmosphere system has increased significantly in recent years. This is attributed to increased computing capabilities available today. Mathematical models, be it physically or empirically based, have the promising potential to explore solutions to water management problems. Evaluation of water management scenarios can be easily done, thus facilitating better recommendations for improved water use. Thus, in large-scale irrigated agriculture, there is potential benefit from improved rainwater and irrigation management, as well as upstream through reduced land degradation and associated soil erosion, which, when transported downstream, reduces the efficiency of irrigation schemes and best practices. The Kuraz Sugar Development irrigation project in the sub basin, which is one of the sub basins in Ethiopia, has suitable land for agriculture and livestock, and currently huge investment is found in irrigation projects, and of these, the dominant is state-owned irrigation, like the Kuraz Sugar Development irrigation project in the sub basin, which is planned to irrigate sugarcane on 175,000 hectares of land.
Agro-hydrological model • SWAP • CROPWAT
In the sub basin, frequent events of high and low rainfall, less work on soil conservation practice and deforestation are observed as causes of the changing climate and land degradation that make the need for improved and resilient agricultural water management to have a greater yield of the crop with environmental sustainability. Thus the aim of this research work is to evaluate the performance of two computer-based agro-hydrological models (SWAP and CROPWAT) in simulating soil water balance components of a sugarcane cropped field under irrigation conditions. To achieve this purpose, an available code that takes into account the interaction between soil, water, atmosphere and plants is used after assessing the challenges in the sub basin and identifying adaptation strategies for improved agricultural water management and comparing it with the CROPWAT model. Consequently, it is being tried to analyze the impact of climate change on water demand for irrigation and relative crop yield in the Kuraz irrigation project area.
From the result of the performance of the two models, the SWAP model result of actual evapotranspiration and irrigation water requirement is greater than the designed crop water requirement of the CROPWAT model output, which can be calibrated with the yield of sugarcane. The comparison of the two models shows that the SWAP model output indicates the actual evapotranspiration and irrigation water requirement is greater than the CROPWAT model output of the designed irrigation water requirement that can be made to conform to the yield reduction of sugarcane in the project area as a calibration method due to a shortage of data. It shows the need for irrigation water should be supplied to maintain a good yield of sugarcane in the future, and due to the scare availability of water adaptation and mitigation strategies, saving this water is a must.
Background
Globally, there are high expectations for the potential of improved agricultural water management to drive agricultural growth and poverty reduction. The development of irrigation and agricultural water management holds significant potential to improve productivity and reduce vulnerability to climactic volatility in any country. Although Ethiopia has abundant rainfall and water resources, its agricultural system does not yet fully benefit from the technologies of water management and irrigation simulation. \According to climate change assessments, less precipitation and higher temperatures can be expected in the south Omo Gibe sub basin [1]. Besides, an increment in drought studies shows high land degradation and nutrient depletion of agricultural land as well. Such climatic and land conditions require an effort to improve agricultural water management efficiency and to optimize irrigation technologies. There are currently available water-use and cropgrowth simulation models, which can be combined with climate and land use scenarios in order to recommend, through many simulations, the most reliable irrigation management. IPCC findings indicate that developing countries such as Ethiopia will be more vulnerable to climate change, and climate change may have far-reaching implications for Ethiopia because of its economic, climatic, and geographic settings [2]. From the research done on Omo Gibe basin, in the higher emission scenario, the basin will face drought conditions and, due to increased temperatures, the evaporation condition of the basin will be high. The current mean annual maximum and minimum temperatures are expected to rise by about 0.9°C to 1.8°C and 1.2°C to 2.2°C as a result. A 2°C rise in mean annual surface air temperature is expected in the future.
The investment in this area is mainly designed with a crop-oriented model and this model does not consider the effect of soil texture. Soil interacts with water and therefore its characteristics are a reflection of, and sometimes the reason for, agronomical decisions. The root water absorption in a crop-oriented model is calculated using a law of the limiting is unable to simulate upward water movement due to capillary rising. Crop-oriented model yield predictions significantly depart from actual yields under heavy rain conditions. The main purpose of an irrigation system is to maximize crop production to improve economic growth and alleviate hunger and poverty in the country. Therefore, water needs to be distributed efficiently to the crops at the right time with an effective quantity. Efficient water allocation for crops can result in saving water, increasing the cultivated land area to some extent, or else using that amount of saved water for other economic and social purposes.
Irrigation water management relies on accurate knowledge of plant water consumption, water flows, and soil moisture dynamics throughout the growing season. The decision-supporting tools should therefore capture the temporal and spatial variability of rainfall, soils, and crops. Because field measurements and remote sensing cannot fully reconstruct this, dynamic simulation models are required to describe soil physical processes, surface water balance, and crop growth in order to provide this information to stakeholders and finally derive water productivity estimates [3]. In order to optimize water use and crop productivity, one has to improve the water resource allocation optimally in a water-limiting region, improve irrigation scheduling, and establish crop water needs, which are influenced by the rate of water used by the crops, evapotranspiration (ET), and other losses such as soil retention characteristic. Therefore, a study is needed to address the problems of how to make the best use of the limited water available while maximizing the economic return on water use. This requires evaluation of crop water requirements, irrigation water requirements, irrigation scheduling, and cropping systems.
Thus, to overcome these challenges, the input data for modeling climate and land use change scenarios in the area should be periodical, mostly on a daily basis, and both the climate and land parameter data need to be estimated using different methods to forecast their effect on agricultural water management. Kuraz Sugar Corporation would like to know the demand for water for irrigation in the area of the Kuraz Sugar Development Project in response to future climate change and land transformation in order to ensure an optimum crop yield. Consequently, the need for improved irrigation water management, two irrigation models, the common agro-hydrological model SWAP and the current existing model in project area CROPWAT, will be assessed and compared on evapotranspiration and irrigation requirements to show the performances of the models on actual irrigation requirements based on the yield of sugarcane on the Kuraz irrigation project as calibration in order to show the effect of rising temperatures on the sugarcane yield. The overall objective of this study is to investigate cropping systems and water use options to improve irrigation water allocation and use in the context of climate change and land degradation on a case-by-case basis, evaluating the performance of two models: SWAP and CROPWAT.
The specific objectives include
• Assessment of crop water requirements in the case study area for sugarcane crop, as well as identification of impacts on irrigation efficiency due to temperature increases and decreases in canal water level on crop water requirements.
• Quantifying and predicting the current field conditions' effects on the increase of temperature and decrease of water level in the canal using the SWAP model and also simulating the same cropped field using the CROPWAT model
• Compare the performances of the two models in predicting actual crop water needs on crop water requirements and yield of sugarcane to give recommendations for irrigation practice on the usefulness of the Agro hydrological model.
Scope of the study
Comparison of CROPWAT and SWAP model descriptions: Irrigation, being considered the major user of water, is a potential avenue to study water use efficiency. A strategic point to start with is to answer the question of how much water is really needed to grow crops. But even this question is difficult to answer because of the interrelationship of factors in the soil-plantatmosphere system. It is more difficult if the issue expands to how crops are using the applied water in the soil. The irrigation interval is mainly dependent on the evapotranspiration and water holding capacity of the soil or soil type. Very often, attention is only paid to water applied by irrigation. However, it seems obvious that, with the increasing competition for water, considering only irrigation water is not adequate and an approach encompassing the total water balance is necessary. Most experiments, however, continue to use the traditional approach of investigating the effects of different amounts of irrigation applications or different irrigation methods on crop yields.
These studies are mainly focused on obtaining the highest yield per unit of irrigation water and ignore some important issues. They take into account only water applied by irrigation, while ignoring water consumed by the plant from other sources such as capillary rise from the groundwater, rainfall, and reduction in soil-water storage. For determining savings in agricultural water use, three processes should be considered: the distinction between crop transpiration and soil evaporation; groundwater recharge vs. capillary rise; and changes in long-term soil-water storage. Unfortunately, only the last term can be easily obtained from soil-moisture measurements in the field. A crop orient model like CROPWAT is an analytical model commonly used for most irrigation projects, including the Kuraz irrigation project. CropWat 8.0 is an FAO-developed decision-support computer program that uses rainfall, soil, crop, and environmental data to measure reference evapotranspiration (ET0), crop water requirements, irrigation scheduling, and irrigation water requirements [4]. The software helps improve irrigation schedules and the simulation of crop water use for different crops under irrigated and rain-fed conditions by providing general data for various crop features, local climate, and soil properties.
In top soils, numerous physical, chemical, and biological processes occur, with all kinds of complexity and interactions. Although analytical equations are elegant, provide insight, and are rapidly transferable, they are, in general, insufficient for field conditions. The interaction between highly non-linear processes under irregularly changing boundary conditions, as occurring in the field, cannot be solved by analytical equations. Numerical solutions of the governing relationships are much better equipped to solve these processes at the prevailing boundary conditions. Our increased knowledge of numerical stability, the exponential growth of computer speed and capacity, the accessibility of input data and availability of support through the Internet, and the increasing user-friendliness of interfaces have enhanced the development and application of numerical models. One of these agro-hydrological models is the Soil-Water-Atmosphere-Plant (SWAP) model [5]. Actually, water moves not only downward within the soil, but also lateral and even upward, depending on the potential gradients [6]. Transport phenomena, such as water movement into the soil, are driven by potential gradients that depend on gravity, water extraction by roots, and water that enters or leaves the profile from the top or bottom, causing different soil water suction in the different layers.
To analyse water flow in a SWAP model system, one needs to know the three boundaries mentioned earlier (i.e., top, bottom, and lateral boundaries [7]. For the top boundary (i.e., interaction between soil and atmosphere), the amount of rainfall and irrigation (available data or prediction) is important. Based on the meteorological data (i.e., rain, temperature, humidity, radiation, and wind speed) and crop model, the amount of water intercepted by the crop leaves and the amount of water extracted by the crop roots can be modelled. Further, based on the properties of the soil and meteorological data, the amount of water infiltration into the soil and surface run-off can be modelled. For the lateral boundary (i.e., interaction between soil and surface water level), the depth of surface water level and the depth of the ditches should be given. If the groundwater level is well below the surface water level and the depth of the ditches, lateral infiltration will occur, and if otherwise, drainage will occur. The rate of infiltration or drainage is very much influenced by the infiltration and drainage resistance of the soil being modelled. For the bottom boundary (i.e., the upper part of the saturated zone), depending on the spatial distribution of water pressure head, water recharge (water flow from unsaturated zone to saturated zone) or discharge (water flow from saturated zone to unsaturated zone) could occur [8].
Study area
The Omo-Gibe basin is one of the major river basins in Ethiopia and is situated in the south-western part of the country, covering parts of the Southern Nations, Nationalities and Peoples Region (SNNPR) and Oromia region. The basin covers an area of 79,000 km2 with a length of 550 km and an average width of 140 km. The basin lies between 4000’N and 9022’N latitudes and between 34044’E and 38024’E longitude. It is an enclosed river basin that flows into Lake Turkana, which forms its southern boundary. The total mean annual flow from the river basin is estimated at about 16.6 BMC [9]. The Omo Gibe watershed was selected as a case study for this research because largescale and medium-scale irrigation potential are identified in the basin, with an estimated irrigable area of 57,900 and 10,028 hectares, respectively, and a total irrigable area of 67,928 hectares. However, this figure could be much higher given the vast land area of lower Omo. In addition, it can be considered a representative watershed where there are high landscape and climatic zone differences within short distances. Population growth and land use systems together with considerable human interventions in the upper part of the Omo watershed make it feasible for climate change and land degradation impact analysis on the hydrological regime. The Omo River is one of the largest rivers in Ethiopia, with a mean annual flow of up to 20 BMC and a catchment area of 79 000 km2. The river is thus a vital natural resource for the country.
As per the Omo Gibe Master Plan Study, even though many areas in the basin are not suitable for irrigation development, either due to steep slopes or soil, the lower Omo area, where the project is to be constructed, has extensive plains, moderately suitable soils, and sufficient water available from the Omo River. Overall, about 175 000 ha of net potential irrigable area is delineated for sugar cane development on the right and left banks of the lower Omo Sub-Basin. Rainfall in the Omo-Gibe basin varies from over 1900 mm per annum in the north-central areas to less than 300 mm per annum in the south. With a decrease in elevation, the amount of rainfall throughout the Omo-Gibe catchments decreases. Moreover, the rainfall regime is unimodal for the northern and central parts of the basin and bimodal for the south. The mean annual temperature in the Omo-Gibe basin varies from 160°C in the highlands of the north to over 300°C in the lowlands of the south. The maximum temperature is higher in the southern part of the basin, especially at Morka, where the mean annual maximum temperature reaches up to 30.6°C. There is a little variation in minimum temperature, which varies from 9.2°C in the northern part of the basin, for example in Gedo, to 16°C in the southern part of the basin at Jinka.
The topography of the Omo Gibe basin as a whole is characterized by its physical variation. The northern two-thirds of the basin have mountainous to hilly terrain cut by deeply incised gorges of the Omo, Gojeb, and Gilgel- Gibe Rivers, while the southern one-third of the basin is a flat alluvial plain punctuated by hilly areas. The northern and central half of the basin lie at an altitude greater than 1500 masl with a maximum elevation of 3360 m.a.s.l (located between Gilgel-Gile and Gojeb tributaries), and the plains of the lower Omo lie between 400-500 meter asl [10]. More specific soil studies in the basin have concentrated on the irrigation potential of the lower Omo valley, with some work on erosion and conservation measures. Poorly drained vertisols are the dominant feature of the land scope in many areas of the upper basin, and they are common in the plains of the lower Omo where they occur in association with poorly drained sodic clays. Alluvial and colluvial soils of the lower Omo are characterized by their highly heterogeneous nature in terms of texture both laterally and vertically. Soil erosion is also a serious problem in the Gilgel Ghibe watershed. The total soil loss into the Omo River from landslides is estimated at 11 t/ha/yr for the last 20 years. As far as the chemical properties are concerned, most of the soils are moderately alkaline to very strongly alkaline. The soils are also characterized by the existence of high CEC levels and high base saturation percentages from top to sub-soils. In most cases, the soils of the command area have low organic carbon content levels and also have low to very low total nitrogen levels. Thus, nitrogen must be effectively supplied through appropriate fertilizer application.
SWAP model: SWAP model is a physically based, agro-hydrological model termed Soil Water Atmosphere and Plant (SWAP) (to simulate water transport processes at a field scale [11]. It has been widely used for modelling soil water flow, solute transport, soil heat flow, daily evapotranspiration, crop growth, field irrigation. SWAP water flow is based on an implicit finite difference solution of the non-linear partial differential Richards’ equation according to the model user guide. Depending on the given boundary conditions, SWAP model will calculate soil water flow due to the spatial differences of soil water potential. Soil consists of different organic matters and
 (1)
(1)
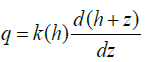
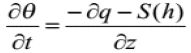
can be modelled as porous media with permeability properties as described by Darcy's low: where q [cm/day] is the soil water flux density (positive upward), K is hydraulic conductivity of the soil [cm/day], h is soil water pressure head [cm] and z is the vertical coordinate [cm] taken positively upward. When water content changes with time under transient conditions, conservation of matter is formulated by the continuity equation for soil water:
 (2)
(2)
Where q is volumetric water content (cm3 cm-3), t is time (d) and S is soil water extraction rate by plant roots and drain discharge (cm3 cm-3 d-1).
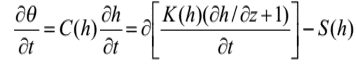
By combining equation (4.1) and (4.2) one could derive the partial differential equation that describes the soil-water-atmosphere interactions in unsaturated zone which is the well- known
Richard’s equation
 (3)
(3)
Where C is the water capacity (S0/dh) (cm-1), h soil water pressure head (cm), K is hydraulic conductivity (cm d-1), S root water extraction rate (cm3 cm-3 s-1) and z soil depth (cm). Hydraulic conductivity is an intrinsic representative property of the soil being studied. This soil property depends very much on the type and structure of the soil. In addition, atmospheric temperature and thus soil temperature will also have an impact on this hydraulic property of soil, which all are included the SWAP model. Root water extraction rate depends on the crop model and the atmospheric conditions, while the water pressure head depends on the initial condition and further calculated spatial distribution of water pressure head depending on all the boundary conditions and soil properties. Richard's equation (equation (4.3) is solved by SWAP numerically given the initial conditions, the boundary conditions and the relations between volumetric water content (q), soil water pressure head and hydraulic conductivity of the soil being studied. The reader is referred to SWAP manual for further detail on the numerical methods implemented in SWAP program.
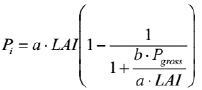
As described earlier, crops leafs intercept water from rain and irrigation. In SWAP, the amount of intercepted precipitation is calculated based on a formula proposed by Von Hoyningen-Hune (1883) and Branden (1985):
 (4)
(4)
LAI where Pi is intercepted precipitation (cm/day), LAI is leaf area index, Pgross is gross precipitation (cm/day), a is an empirical coefficient (cm/day) and b represents the soil cover fraction. Equation (4.6) shows that the amount of intercepted precipitation will asymptotically reaches the saturation amount (i.e. a-LAI) for increasing amounts of precipitation.
It is generally accepted that the daily water fluxes passing through a canopy are large compared to the amounts of water stored in the canopy itself. Therefore, it can be assumed that root water extraction in the soil is equal to plant transpiration. On the other hand, due to meteorological conditions, water from the soil or ponding on the soil surface can evaporate. The total amount of transpiration (from plant) and evaporation (from soil surface) can be referred to as evapotranspiration. it can be calculated by using Penmanmonteith equation.
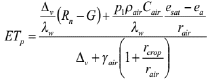 (5)
(5)
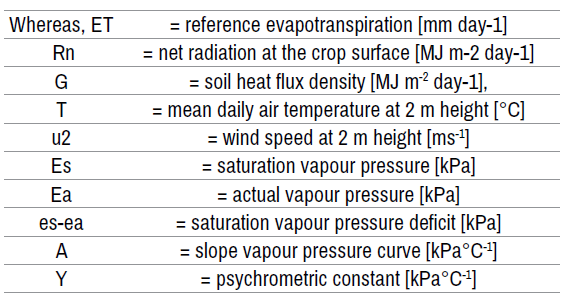
where ET is the transpiration rate of the canopy (mm/day), Av is the slope of the vapour pressure curve (kPa/°C), Aw is the latent heat of vaporization (J/ kg), Rn is the net radiation flux at the canopy surface (J/(m2 day), G is the soil heat flux (J/(m2 day), p1 account for unit conversion (= 86400 s/day), pair is the air density (kg/m3), Cair is the heat capacity of moist air (J/(kg°C), esat is the saturation vapor pressure (kPa/°C), ea is the actual vapor pressure (kPa), Yair is the psychrometric constant (kPa/°C), rcrop is the crop resistance (s/m) and rair is the aerodynamic resistance (s/m). Penman-Monteith equation is recognized as one of the best formula to predict evapotranspiration under different climatic conditions. This equation has become an international standard to calculate potential evapotranspiration for a dry, horizontallyuniform vegetated surface. Penman-Monteith equation is applied in SWAP to calculate potential evapotranspiration. The maximum potential root water extraction rate could be reduced by the stress due to dry or wet conditions. The maximum possible root water extraction rate could be calculated as follow:
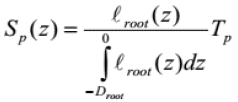 (6)
(6)
where 1 root is root layer thickness (cm) and Tp is potential evapotranspiration.
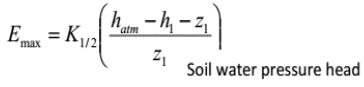 (7)
(7)
The maximum evaporation value that to soil can sustain is calculated using Darcy's law: Where Ki/2 is average hydraulic conductivity (cm/d) between the soil surface and the first node, hatm is the soil water pressure head (cm) in equilibrium with the air relative humidity, h1 is the soil pressure head at the first node, and z1 is the soil depth (cm) at the first node. The value of Emax depends on the thickness of the top soil compartments. SWAP recommends therefore for more accurate simulation, the thickness of the top compartments is maximum 1 cm.
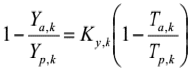
By calculating the potential and actual transpiration one can then calculate the relative crop yield based on a simple model defined in SWAP. For each growing stage k the actual yield Ya,k (kg/ha) relative to the potential yield Yp,k (kg/ha) is calculated in the SWAP model using the
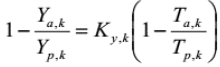 Following equation (8)
CROPWAT model
Background of CROPWAT model according FAO, CropWat for Windows is a program that uses the FAO (1992) Penman-Monteith methods for calculating reference crop evapotranspiration. These estimates are used in crop water requirements and irrigation scheduling calculations (Derek Clarke CropWat for Windows)
For understating the current and actual field situation it’s required to know how much water is given for difference crops in each month for the practiced crops in the study area, with the existing irrigations efficiency, secondly it’s necessary to explore monthly canal available water for the crops in the study area. CROPWAT is taken in account for simulating the net irrigation requirement of each crop in the study area, and canal flow is estimated. The result of this scenario helps to quantify irrigation water requirement. To find out the crop water requirements (CWR) and irrigation water requirements (IWR) through CROPWAT model the following steps and information is required.
• Decade or monthly climate data that is minimum and maximum air temperature, relative humidity, sunshine duration and wind speed is required by the model.
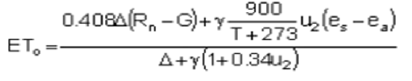
• Reference crop evapotranspiration (ETo) equation based on Penman- Monteith method
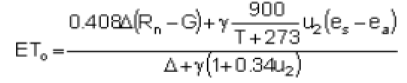 (9)
(9)
• Rainfall data (daily/decade/monthly) is required to calculate effective rainfall, for this study USDA Soil Conservation Service method has been chosen for the calculating of effective rainfall; following criteria have to be followed.
ER = Total R (125-0.2 TR)/125
A cropping pattern consisting of the planting date, crop coefficient data files (including Kc values, stage days, root depth, depletion fraction) and the area planted (0-100% of the total area) and also a set of typical crop coefficient data files are provided in the program.
CWR and IWR computes due to the following formula, on the account of CROPWAT model.
CWR = ETo* Kc
IWR = (ETo* Kc) – ER
Data input for simulating crop water requirement: Daily meteorological data, i.e. precipitation, solar radiation, air temperature, air humidity and wind speed is needed to calculate the evapotranspiration rate with Penman- Monteith equation described in chapter 4. In addition, the amount of water from precipitation is needed as an input to calculate water interception by the plants, surface water run-off and rain infiltration into the soil. The closest weather station to Kuraz irrigation project is kako station. It is assumed here that the recorded data in kako station is the same as that in the project area (Figures 1-5). Based on Kuraz block sugar development irrigation project 74 m3/day per hectare for normal days and 134m3/day per hectare for dries period will supply which means design discharge of kuraz right side block main canal design discharge it is 165 m3/s and 155 m3/s for left side main block canal a total of 290 m3. The irrigation type applied in the field is surface irrigation. For simplicity reason, based on the information and provided by WWDSE, the irrigation water amount is set to be 7.2 mm/day for normal month and 10.7 mm/ day for dry month. Dry period is defined here as precipitation deficit, i.e. when the total precipitation is below the potential evapotranspiration. For the entire period of interest, the amount of irrigation per day can be realized by calculating the difference between precipitation and potential evapotranspiration for every month based on the meteorological data and applied the criteria defined above (i.e. 7.2 mm/day for normal month and 10.7 mm/day for dry month. The irrigation is applied during the month of April till October.

Figure 1. Command area monthly rainfall.

Figure 2. Monthly max and min temperature, °C.

Figure 3. Monthly humidity, %.

Figure 4. Monthly sunshine durations, hrs.

Figure 5. Monthly wind speed, m/s
Crop data
Crop water requirements and effective rainfall: Where; ETc is crop evapo-transpiration (mm/day); ETo is reference crop evapo-transpiration (mm/ day) and Kc is crop coefficient.
ETc = ETo*cKKc
The effects of weather conditions are captured in the ETo estimate. Therefore, as ETo represents a factor of climatic demand, Kc varies mainly with the specific crop characteristics. This allows the transfer of standard values for between locations and climates (Tables 1 and 2).
| Soil Groups | Growth Stages | ASM | Root Depths | Depletion Levels | Average Daily ETc | Irrigation Intervals |
|---|---|---|---|---|---|---|
| mm/m | M | % TAM | mm/day | Days | ||
| Heavy Soils | Initial | 220 | 0.3 | 35 | 1.87 | 10 |
| Developmental | 220 | 0.4 | 65 | 4.48 | 13 | |
| Mid | 220 | 0.5 | 65 | 6.49 | 11 | |
| Late | 220 | 0.65 | 65 | 3.33 | 28 | |
| Light Soils | Initial Developmental | 180 | 0.3 | 35 | 1.87 | 10 |
| 180 | 0.4 | 65 | 4.48 | 10 | ||
| Mid | 180 | 0.5 | 65 | 6.49 | 9 | |
| Late | 180 | 0.65 | 65 | 3.33 | 23 |
| Age | Growth Stages | Canopy Cover | Kc Value | Root Depth |
|---|---|---|---|---|
| [months] | [%] | Cm | ||
| 0 – 2 | Initial | 0 - 25 | 0.3 | 30 |
| 3 – 3 | Developmental | 25 - 50 | 0.5 | 45 |
| 4 – 6 | Developmental | 50 - 75 | 0.7 | 60 |
| 7 – 11 | Mid | 75 - 100 | 1.20 | 60 |
| 12 – 12 | Late | 100 | 0.7 | 60 – 70 |
| >12 | Dry off |
Soil: Soil water section is one of the main input file beside other files that have been describe in the previous sections.
The maximum pond layer thickness (cm) is the threshold of water layer thickness on top of the soil surface before run-off starts. Here the maximum thickness of ponding water layer is set at 0.2 cm and Soil evaporation is calculated using Penman-Monteith equation. Here, SWAP manual recommends users (default) to use the combination of reduction to maximum Darcy flux and maximum black. Default soil evaporation coefficient for black equals to 0.35 cm/day0'5. Default minimum rainfall for model reset (cm) is used here (= 0.5). Further, default parameters for numerical scheme to discretize Richard's equation are used here.
In this paper, soil types are grouped into two types of soil, light loamy soil and heavy loamy soil. These two soil types have different hydraulic properties. The light loamy soil is modelled with two layers, i.e. at the top loam (TL) and at the bottom loam (BL). Heavy loam is also modeled with 2 layers i.e. at the top clay (TC) and at the bottom is loam (BL). The soil of hydraulic functions of the soil layers to a depth of 4 meters (the depth of soil domain chosen here) and soil water retention parameter was taken from Van Genuchten-Mualem parameters (i.e. saturated moisture content (φsat), residual moisture content φr, saturated hydraulic conductivity Ks, and shape parameters n, α, and λ were obtained from Wosten et al., 1994)). The parameters used to define the soil hydraulic properties of top soil loam (TL), top soil Clay (TC) and sub soil loam (SL) is shown in below (Table 3).
| Soils | ρεσ | φσατ | Ksat | α (cm-1) | λ (-) | n(-) |
|---|---|---|---|---|---|---|
| (cm3 cm-3) | (cm3 cm-3) | |||||
| (Top) Loam | 0.01 | 0.43 | 2.25 | 0.0096 | -2.733 | 1.284 |
| (B8) | ||||||
| (Top) Clay | 0.1 | 0.42 | 1.17 | 0.0118 | -4.795 | 1.224 |
| (Sub) Loam (O10) | 0.01 | 0.49 | 2.22 | 0.0107 | -2.123 | 1.28 |
The soil in the area of study is simply modeled with 2 layers, i.e. top layers (14 cm thick) are divided into 10 compartments (vertical discretization) with 1 cm thick plus 2 compartments with 5 cm thick. In this paper, the depth of water level and the depth of the bottom of the ditches for the selected areas obtained from GIS map are not available in WWDSE design report. And the ground water level as stated in limitation sub topic of this paper is not available here also the exact values of drainage resistance and infiltration resistance are very difficult to determine. These values strongly depend on the phreatic groundwater level and drainage. Hence, here, no simulation of drainage is selected.
Yield of sugarcane: According to the WWDSE design report and other researches on technical inefficiency of sugarcane yield the three years calculated and tabulated below. Even though the area of sugarcane plantation (Table 4).
| Year | predicted Yield*1000 ton | Area of Plantation | Sugarcane yield/Area | Actual yield*1000 ton |
|---|---|---|---|---|
| 2014 | 3256 | 25000 | 123.2 | 2572.24 |
| 2015 | 3481 | 25000 | 146.8 | 2680.37 |
| 2016 | 3279 | 25000 | 131.16 | 2459.25 |
The result with comparison of yield of sugarcane of these same soil water balance components as simulated using the two models is also presented in the following tables (Table 5).
| Month | Decade | Stage | Kc | Etc | Etc | Eff rain | irr.req |
|---|---|---|---|---|---|---|---|
| Coeff | mm/day | mm/dec | mm/dec | mm/dec | |||
| Jan | 1 | Init | 0.3 | 1.22 | 12.2 | 11.1 | 1.1 |
| Feb | 1 | Init | 0.3 | 1.3 | 13 | 9.3 | 3.6 |
| Mar | 1 | Deve | 0.34 | 1.5 | 15 | 14.8 | 0.2 |
| Apr | 1 | Deve | 0.6 | 2.68 | 26.8 | 30.3 | 0 |
| May | 1 | Deve | 0.86 | 3.51 | 35.1 | 25.8 | 9.3 |
| Jun | 1 | Mid | 1.07 | 4.11 | 41.1 | 16.3 | 24.9 |
| Jul | 1 | Mid | 1.07 | 3.88 | 38.8 | 14.5 | 24.2 |
| Aug | 1 | Mid | 1.07 | 3.77 | 37.7 | 15.9 | 21.7 |
| Sep | 1 | Mid | 1.07 | 4.13 | 41.3 | 14.1 | 27.2 |
| Oct | 1 | Late | 0.93 | 3.78 | 37.8 | 15.9 | 21.9 |
| Sum | 0 | 7.61 | 29.88 | 298.8 | 168 | 134.1 |
Crop water requirements simulated using CROPWAT: The results from model execution included of crop water requirement and irrigation requirement and are presented in the following tables
Crop water requirement simulated by SWAP model: Based on all the input parameters described in chapter 4, SWAP program can calculate some desired output like crop yield, and water balance. In this chapter, the calculation of potential and actual evapotranspitation and irrigation requirement is presented. Its effect on crop yield based on the simple model described here is calibrated by using the recorded sugarcane yield in the area of Kuraz obtained from WWDSE design report (Table 6).
| Water | balance | increments( cm/period) |
||||||||||
|---|---|---|---|---|---|---|---|---|---|---|---|---|
| * | Date | Day | Rain | Irrig | Interc | Runoff | Transpiration | Evaporation | DrainageQBottom | |||
| *dd/mm/yyyy | gross | gross | pot | act | pot | pot | act | pot | act | net | ||
| *<========><==><======><======><======><======><======><======><======><======><=======><======> | ||||||||||||
| jan | 31/01/2014 | 31 | 20.286 | 37.1 | 0 | 15.173 | 7.724 | 8.79 | 7.224 | 7.822 | 0 | 0 |
| 1/3/2014 | 60 | 27.683 | 42.347 | 0 | 52.387 | 9.143 | 9.846 | 8.643 | 8.865 | 0 | 0 | |
| 31/03/2014 | 90 | 18.585 | 43.29 | 0 | 43.188 | 10.187 | 10.687 | 9.687 | 9.887 | 0 | 0 | |
| 30/04/2014 | 120 | 17.605 | 43.29 | 0 | 42.014 | 10.381 | 10.381 | 9.881 | 9.881 | 0 | 0 | |
| 31/05/2014 | 151 | 18.042 | 46.5 | 0 | 14.025 | 10.531 | 10.777 | 10.031 | 10.877 | 0 | 0 | |
| 30/06/2014 | 181 | 17.78 | 47.3 | 0 | 13.819 | 10.461 | 11.321 | 9.961 | 9.961 | 0 | 0 | |
| 31/07/2014 | 212 | 17.575 | 50.8 | 0 | 13.533 | 10.558 | 10.952 | 10.058 | 10.842 | 0 | 0 | |
| 31/08/2014 | 243 | 16.672 | 46.6 | 0 | 12.699 | 10.516 | 10.473 | 10.016 | 9.973 | 0 | 0 | |
| 30/09/2014 | 273 | 17.607 | 47.4 | 0 | 13.769 | 10.338 | 10.833 | 9.838 | 10.833 | 0 | 0 | |
| 31/10/2014 | 304 | 20.596 | 48.5 | 0 | 17.367 | 9.729 | 9.979 | 9.229 | 10.229 | 0 | 0 | |
| Sum | 453.127 | 0 | 237.974 | 99.568 | 104.039 | 94.568 | 99.17 | |||||
Comparison of the performance of CROPWAT and SWAP model: To give Some judgments on the results of comparison, The average difference of the results from 2 models is about 10% as can be calculated from the below table and it can be due to some reasons as follow:
• CROPWAT uses average monthly climate data and then applies the results for the period defined by user (daily, monthly or specific period) while SWAP takes daily basic data.
• The limit of CROPWAT on soil infiltration rate (maximum at 300mm/day) is not true for the case study. Actual infiltration rate at research is large. A limited infiltration rate should lead to a lower irrigation requirement for CROPWAT while SWAP consider movement water in the soil from upper boundary to lower boundary in field scale
• CROPWAT does not consider variation of soil water movement like canal water reduction and siltation effect and also soil temperature effect. So in that case, the irrigation requirement will be high that should be maintained otherwise reduce the yield of sugarcane as it be seen below (Table 7).
| Year | SWAP actual ETO | cropwat ETO avg | SWAP irr. Req.avg (mm/dec) | CROPWAT irr. Req.avg (mm/dec) | Difference ETO avg | Difference in irr.req | |
|---|---|---|---|---|---|---|---|
| 2014 | Dry season | 104.029 | 90.84 | 453.127 | 413.3 | 13.189 | 39.82 |
| Wet season | 95.4 | 85.4 | 290.5 | 320.3 | 10 | -29.8 | |
| 2015 | Dry season | 112.656 | 102.245 | 420.32 | 462.87 | 10.411 | 42.55 |
| Wet season | 96.2 | 90.4 | 300.4 | 333.5 | 5.8 | -33.1 | |
| 2016 | Dry season | 124.56 | 113.24 | 432.21 | 473.284 | 11.32 | 41.07 |
| Wet season | 108.5 | 98.5 | 310.2 | 345.7 | 10 | -35.5 | |
• Due to the limited available data on sugarcane crop, a simple crop yield model is chosen for the SWAP model described here. With the simple model, SWAP could calculate the relative crop yield. This is realized by taking the ratio between the actual transpiration (Ta) and the potential transpiration (Tp), i.e. relative crop yield (Ya/Yp) = (Ta/Tp). To obtain the average relative yield for the entire area of Kuraz project area, the average relative crop yield for all the point of interests is taken. To be able to compare the yield response of the SWAP model and the data obtained from WWDSE.
• Despite all the simplification used in the SWAP model, it still could capture some trends of the relative sugar cane yield in the kuraz area. The limitation of this model in predicting the relative crop yield is discussed further (Figure 6).

Figure 6. Simulated irrigation requirement by CROPWAT and SWAP model.
As described earlier, the SWAP model presented here requires many parameters as input, i.e. meteorological data, irrigation parameters, crop parameters, soil properties, drainage parameters, and bottom boundary conditions. The meteorological data that were used in the SWAP model presented here are available from National meteorological agency and WWDSE design report. For fixed irrigation input data, data from WWDSE design report was used,
For each growing stage k the actual yield Ya, k (kg/ha) relative to the potential yield Yp, k (kg/ha) is calculated in SWAP model using the following equation:
 (10)
(10)
Where Ky,k is the yield response factor of growing stage k, and Tp,k (cm) and Ta,k (cm) are the potential and the actual transpiration respectively, during growing stage k. For the SWAP model defined here, a simple crop yield model is used. The value of potential and actual transpiration can be calculated by using SWAP model. However, the value of crop yield response factor (Ky) should be given (input data) in the model. Crop yield response is a function of the age of the sugar cane plants, the type of the species, irrigation method and management and the growth stage due to the changes in meteorological data (van Dam, 1997). In the SWAP model for sugarcane crop presented here, a simple model is chosen. This is because mostly parameters needed to apply detailed crop model are unknown. In the crop simple model, the yield response factor of the whole growing stage is assumed to be equal to 1 (as suggested by van Dam, 1997). By using the simple model for crop yield, the relative crop yield for each point of interest in the Kuraz project area could be calculated. In order to enable better sugar cane crop yield prediction, it is recommended to use the detailed crop yield model available in SWAP, however this requires effort to measure all the parameters needed to determine crop yield response factor (Ky). This is not a straight forward task and will require significant effort (Figure 7). As described above, the SWAP model for sugarcane crop plantation in Kuraz project area has been validated using the available data. Therefore, this model can be further utilized to predict water demand in the future (i.e. 2020) in order to maintain optimum sugarcane crop yield. This can be realized by providing the predicted future meteorological data into the SWAP model with the input parameters that has been validated model. It can be concluded with the estimation of water demand in the future which is useful information for Sugar Corporation in order to ensure sufficient water supply to kuraz project area.

Figure 7. Comparison of actual and predicted yield of sugarcane.
Model calibration (crop yield) and future application discussion: If the amount of water supplied to the Kuraz irrigation project area could be maintained at a similar level as it is today, based on the calculation presented here, then in the future the capability of the corporation to satisfy water demand would not be enough. However, taking into account all the simplification and the uncertainties in the model, it is safer for the corporation to increase the water supply capability in the future, particularly using a better approach of soil and water management integrated with sub-basin scale soil and water conservation practices, as we have discussed in the previous chapters, in order to cope with the increasing water demand in the future. The water demand needed to maintain good soil moisture and yield an optimum sugar cane yield as calculated in SWAP is increased. The extreme water demand is due to the fact that the average maximum temperature in summer is higher. The SWAP model described here shows, as expected, that water demand is higher.
According to the WWDSE design report, the water balance modeling was done in order to check the capacity of the Omo River with respect to satisfying the water requirements of the Kuraz irrigation project and maintain the channel flow downstream of the diversion point. Accordingly, the result of the analysis showed that without Gibe III operation, the Omo River doesn’t satisfy the irrigation demand for some months. In the case of the second scenario, the release of the regulated flow from Gibe III HP dam is considered the power release fluctuating from 335 to 950 m3/s, which means that the minimum release could satisfy the irrigation water requirement of the 175,000 ha of land that is planned to be cultivated under sugar development. So the need for estimation of future water demand under climate change, especially drought happening with the increase in temperature and capillary water rise, which affect the water supplied for irrigation, is important to find an adaptation strategy. SWAP simulates the impact of temperature increases on crop yield as well as the impact of capillary water rises on irrigation water requirements. And this shows that it is possible to use ground water recharge as an adaptation strategy in a water deficit period.
We have seen that climate change affects the irrigation water supply in the canal in the dry period and that causes a reduction in crop yield. In the wet season, even though the crop yield is not reduced, there will be an excess supply of water and overuse of water that can be stored for a drier period. The result that shows from the SWAP model there will be excess supply of water that is more than the crop water requirement that is due to capillary water from the ground water due to raise of the ground water table in wet and rainy season. And this indicate that it is possible to simulate the supply of shallow ground water as input for irrigation water supply to the crops and this implies that during dry season we can use shallow ground water as adaptation strategy to compensate the shortage of water due to climate change This capability of the SWAP model over the CROPWAT model makes the model preferable to simulate adaptation strategies and optimize the best strategies by integrating the model with other algorithms. As a result, the models can be compared on the simulation of ground water recharge impact on crop yield to demonstrate superior performance. Despite the fact that there are various adaptation strategies that can be used to reduce the impact of rising temperatures on crop requirements, some of the strategies use shallow groundwater during dry periods by demonstrating the benefit of drilling and pumping water into the canal during dry periods vs the cost of the crop obtained by using yield maximization optimization technique.
From the design report of WWSDE, shallow ground water exists up to 20m and the cost of drilling borehole lining and pumping to the surface varies according to the borehole water depth and the discharge required, but using rough estimation, it can be estimated that it is feasible to use shallow ground water in a dry period. Here, the ground water table is estimated using the predicted rainfall output on infiltration on the soil rise of the ground water table and recharge to the surface soil root zone and supplied to crop water needs. In addition to the effect of temperature increase, the effect of rainfall that causes recharge of the ground water in the rainy season is helpful in keeping the soil moisture wet, and this kind of ground water recharge can be used as an adaptation strategy for moisture deficit times to keep the yield of a crop high. Ground water can be supplied as subsurface discharge from ponds that are to be filled using shallow wells in the field area. It is also possible to monitor the supply of irrigation water by controlling the amount of water at the head of the canal as an adaptation option.
Finally: The purpose of this study is to develop a better understanding of how farmers and irrigators perceive and use climate, plant growth, and soil information to assist in their irrigation schedule decision making. This is to ensure that when scientific information is provided to assist irrigators, it is presented in a way that is useful and encourages uptake. The benefit is to both the irrigators and the service providers, as maximum benefit is being gained from such services. Key areas for improvement have been identified in this study, like water losses should be reduced and water savings and efficiency should be increased, in particular in agricultural water scarce areas. In this thesis, I have shown the potential impacts of current and future climate change combined with agricultural land use change scenarios on the South Omo subbasin agricultural water management, specifically the Kuraz irrigation project area. The first general conclusion is that, overall, the crop yield simulated in the watersheds will decrease in the future. The second general conclusion is that simulated adaptation management strategies at the farm level and sub basin level are able to mitigate the combined impacts of climate and land use change and can also improve agriculture's water management efficiency, as modeled by the Kuraz irrigation project.
Further research should entail applying agro-hydrological models using parameter non-uniqueness to provide an even greater global indication of the uncertainty. The uncertainty in the reported outcomes is therefore correspondingly high, and the results must be interpreted with caution. I have chosen an option that was current and most suitable to provide some indication of the direction and the magnitude in which agricultural water management may be impacted and adapted by future changes. Controlled standards are also necessary to improve the calibration and validation of the crop parameter component of the SWAP model. Agricultural land management action for the provision of sustainable outcomes and a recommended option for Sugar Corporation should be developed through research and integrated management, though there is no such program and plan in the sub basin. According to the point of further research put into the WWDSE design report, water allocation, system performance, and conjunctive use of surface and ground water, as well as irrigation policy measures are necessary to focus on in this direction
The SWAP model for sugarcane crop plantation is presented and calibrated. The model presented here is able to show the impact of climate change and land degradation on increasing water demand in order to maintain an optimum sugarcane crop yield for the past few years. The result of the model also shows that due to climate change effects, particularly temperature increases, the sugarcane yield will decrease and the demand for water to balance this effect will increase in the future. Consequently, the result of the model, even though the uncertainty of the result data is high due to the shortage of data in the project area, can be a support for the effect of climate change in agricultural water management, which targets an increase in crop yield in agricultural land. Thus, we can also conclude from the experimental case study the need for improved agricultural water management, which can adapt to the effect of climate change and land transformation as we discussed in the previous chapters. The scientific guide subject of this paper enhances the establishment of models that help in taking decisions carefully and rapidly about actions to rehabilitate sugarcane products and the environment with a participative spirit. Equations presented can be used to monitor the ascent of water.
The change in bottom flux from groundwater recharge into capillary rise can be a threat to the sustainability of the system in terms of falling groundwater tables and salinity. The drop in groundwater might be limited as a large part of the basin is not irrigated and water from these areas recharges the groundwater resources. Salinity can become a real threat in the future as the drought continues, although lateral fluxes are still quite high. Further research in terms of scenario analysis is desirable. This study shows that by using only readily available secondary data (standard meteorological data, soil map and land use map) and a physically based simulation model, we can provide swift information about the functioning of a system.
Google Scholar, Crossref, Indexed at
Google Scholar, Crossref, Indexed at
Google Scholar, Crossref, Indexed at
Irrigation & Drainage Systems Engineering received 835 citations as per Google Scholar report


