Research Article - (2021) Volume 10, Issue 9
Received: 26-Aug-2021
Published:
16-Sep-2021
, DOI: 10.37421/2168-9768.2021.10.287
Citation: Muhammad Jalal Khan, Abdul Malik, Mujibur Rahman, Muhammad Afzaal and Shahi Mulk. "Assessment of Crop Water Requirement for Various Crops in Peshawar, Pakistan Using CROPWAT Model." Irrigat Drainage Sys Eng 10 (2021): 287.
Copyright: © 2021 Muhammad Jalal Khan, et al. This is an open-access article distributed under the terms of the Creative Commons Attribution License, which permits unrestricted use, distribution, and reproduction in any medium, provided the original author and source are credited.
Water is an important input for agriculture so that this valuable resource is designed properly and deliverable. Reasonable information on evapotranspiration, crop water requirements, and net irrigation requirements is required for effective planning of this resource. Present research intentions to calculate the Crop Water Requirement for the various crop in the Peshawar district using CROPWAT 8.0 model. Crops in the area of study comprise wheat, sorghum, and millet. The climate data (rainfall, maximum temperature, minimum temperature, hours of sunshine, wind speed, and humidity) was obtained from Regional Meteorological Center, Peshawar. The soil and crop data were obtained from Food and Agriculture Organization for the above-mentioned crops. The reference evapotranspiration, crop water requirement, effective rainfall, and irrigation water requirement were calculated via the CROPWAT model. The study evident that for crops grown in the area the irrigation water requirement is desired to fulfill crop water requirements since effective rainfall is not enough to encounter the crop water requirement.
CROPWAT • Crop water requirement • Evapo-transpiration • Irrigation water requirement
Background
Water is becoming valuable and rare owing to its growing demand in agricultural activities [1]. Water demand is rising gradually as the crop yield is a serious problem throughout the world, particularly in developing countries, owing to population growth, rapid urbanization, and irrigation activities. The causes for this are the lack of adequate water management and water resources conservation. It is compulsory to apply significant approaches that help rise water efficiency [2]. Water is an important input for agriculture so that this valuable resource is designed properly and deliverable. Reasonable information on evapotranspiration, crop water requirements, and net irrigation requirements is required for effective planning of this resource. The water demand for crops differs significantly between crops and crops, even during the entire growing season of a single crop [1]. A major part of a hydrological cycle is evapotranspiration. It is also the transport of water from crop and soil surface to the environment through evaporation. Type of vegetation under various weather conditions vary in evapotranspiration. In Pakistan, although many crops require irrigation and a major portion of water is wasted in the environment because of the greater rate of evapotranspiration. As the ETorises, the need for crop water will also significantly raise, eventually affecting the production of a crop. It is quite tough to achieve this issue owing to a restricted resource of water [3]. The water requirement can be calculated by the estimated process, where the calculation of the water requirement of the crop (ETc) is equivalent to the ETovalue multiplied by the crop coefficient (Kc). Globally, the Penman-Monteith equation is one of the most accurate and detailed techniques for calculating evapotranspiration and crop water requirements [4]. In CROPWAT 8.0, the Penman-Monteith equation is used to evaluate the potential evapotranspiration. Temperature, wind speed, humidity, solar radiation, and ambient temperature are the main determiners of the potential evapotranspiration rate in the Penman-Monteith equation. With model CROPWAT 8.0 we can detect crop water requirements throughout the growing period by rainwater and irrigation on the field [5]. Crop Water Requirements (CWR) relates to the quantity of water needed to cover losses of evapotranspiration from the cultivated field over a certain period. The requirements of crop water are normally expressed in mm/day, mm/month, or mm/season [6].
The only way to improve agriculture is through the provision of modern, adequate irrigation strategies and improved water management practices. Taking into consideration the current water situation throughout the world is an important technique for choosing proper water use. CROPWAT is an FAO-developed window-based model for determining the ETo for accurate irrigation scheduling and design. The Penman-Monteith Equation of FAO is the basis of this application to determine ETo, which will also be useful for increasing crop production [7]. This research aims to estimate the Crop Water Requirement for the variouscrops in the Peshawar district using CROPWAT 8.0.
Research problem
The CROPWAT model is preferred for use in this study in the determination of the reference evapotranspiration (ETo) as it is reported to deliver very reliable values on actual crop water use data worldwide. Systematic crop water requirements are essential ensuring efficient scheduling of irrigation and water management, design of canal capacities, planning of water resources, regional drainage, and research in reservoir operation. Adequate information on crop water and irrigation requirements is lacking among the farmers practicing irrigation for most of the crops grown in the area. This research is thus an attempt to calculate the crop water needs of the main crops grown in the study area using the FAO CROPWAT model [8-12].
Objectives
To determine the Crop Water Requirement and Irrigation water Requirement for various crops in Peshawar district.
Study area
Geographical location is between lengths 71°22' 0" -71º 42' 0" East and latitudes |33° 44' 0" – 34º 15' 0" North. It is the headquarter of Khyber Pakhtunkhwa province. The Peshawar area is 1.257 square kilometers and about 358 m above sea level. The district has extreme climatic conditions. The average monthly temperature for the Peshawar district varies from at least 2.60ºC in January up to 42.70ºC in June (Ullah & Khan, 2019). The average Relative humidity varies from 46 to 76 correspondingly in June and August [13-17] (Figure 1).

Figure 1. Map of the study area.
Input data for CROPWAT
Water and irrigation measurements use inputs from climate, soil, and crop data, along with irrigation and rain data. The climate input data needed are rainfall (day/decade/monthly) and reference evapotranspiration (decade/ monthly). The FAO Penman-Monteith technique provides a measure of reference evapotranspiration from minimum and maximum temperature, wind speed, sunshine hours, and humidity [18].
Input meteorological data: Meteorological data included the minimum, and maximum temperature, wind speed (Km/day), air humidity (%), and sunshine duration (hr.) for the Peshawar District, the latitude, longitude, and elevation value. Data have been gathered from the meteorology department for 13 years (2005-2017), ETo value can be obtained ETo per day or per month. The attained ETo values are founded on the method of Penman-Monteith (Figure 2).

Figure 2. Monthly ETo penman-monteith calculation.
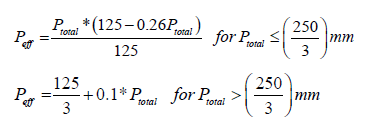
Input rainfall data: Data of Rainfall develops one of the variables deciding the importance of the need for crop water. Data for the thirteen years from 2005 to 2017 has been used for rainfall. USDA Soil Conservation Services (SCS) formula has been used to calculate effective rainfall [1] (Figure 3).
Input crop data: The input crop characteristics data includes the total number of days at each stage of growth, Kc value for each phase of growth, critical depletion, depth of root, and crop yield response parameter. The yield response factor (Ky) is the proportion of the reduction of comparative yield to the deficits in comparative evapotranspiration that combines temperature, soil, and crop conditions that reduce crop yields from evapotranspiration in comparison with their potential yield (Figure 4).

Figure 3. CROPWAT input for calculation of effective rainfall.

Figure 4. Input module of CROPWAT for crop data.
Input soil data: The CROPWAT software needs certain basic data on the soil, such as total soil moisture available, the maximum infiltration rate of rainfall, maximum depth of root, initial depletion of soil moisture content, and initially soil moisture available (Figure 5).

Figure 5. Input module of CROPWAT for soil data.
Output data obtained from CROPWAT
Crop water requirement: After receiving the crop, the number of days for various phases of crop such as (initial, mid-season, development, and late season), crop coefficientvalues, yield response fraction values,and the date of transplantation from the user, the crop water requirements of various crops were measured by the model. The outputs encompass various crop stages, crop coefficient (Kc), effective precipitation, crop reference evapotranspiration, and irrigation demands as below (Figure 6).

Figure 6. Output module for crop water requirement.
Irrigation schedule: The irrigation schedule specifies the right irrigation calculation and the proper irrigation time. The CROPWAT model estimates the irrigation schedules of ETo, CWR, and IWR to be drawn upon various management conditions and water supply plans. The model generated Gross Irrigation, Net irrigation, and rate of flow in liter/sec/hectare (l/s/ha). The model also balances soil moisture on daily basis (Figures 7 and 8).

Figure 7. Crop irrigation scheduling.

Figure 8. Flow chart of the methodology.
Meteorological Data
The climate data from 2005-2017 on a mean monthly basis has been collected from Regional Meteorological Center Peshawar.
Rainfall Data: The rainfall data is taken on a mean monthly basis. The maximum average monthly rainfall has been reported in August whereas the minimum average monthly rainfall has beenreported in November.
Temperature: The temperature data both maximum and minimum is needed as an input in the CROPWAT model. The mean minimum temperature has been recorded in January while meaning the maximum temperature is recorded in June i.e., 5.1ºC and 39.2ºC respectively.
Humidity: A relative humidity parameter is also needed for the CROPWAT model. Mean monthly relative humidity data from 2005-2017 has been collected from the meteorological department. The average minimum humidity of 44.1 percent is noted in May whereas the average maximum humidity of 68.1 percent is noted in August.
Wind Speed: Wind speed data is necessary for the CROPWAT model. The data on a mean monthly basis has been obtained from the meteorological department. The mean minimum wind speed was detected in December (4.3 Km/hr) whereas the maximum was detected in July (16.9 Km/hr.)
Sunshine Hours: The CROPWAT model needs the data of sunshine hours. The maximum sun hours (11.9 hr) have been recorded in June whereas the minimum sun duration hours in January (5.9 hr). Timation and Analysis of Reference Evapotranspiration (ETo).
Estimation of ETo: The average monthly values of the EToat the beginning and end of the year were recorded at minimum and maximum in mid-year as shown in Table 1. The peak ETowas reported in June (10 mm/day) and the least ETo was reported in December (1.61 mm/day).
| Month | Minimum Temperature | Maximum Temperature | Humidity | Wind Speed | Sun hours | Solar Radiation | ETo |
|---|---|---|---|---|---|---|---|
| ºC | ºC | % | Km/hr. | Hr. | MJ/m²/day | mm/day | |
| January | 5.1 | 18.1 | 66 | 6.3 | 5.9 | 10.3 | 1.72 |
| February | 8.3 | 21.6 | 65 | 9.6 | 5.9 | 12.4 | 2.72 |
| March | 13.1 | 25.1 | 62 | 10.5 | 8.3 | 18.1 | 4 |
| April | 18 | 30.8 | 54 | 11.9 | 8 | 20.2 | 5.74 |
| May | 23.1 | 36.5 | 44 | 14.1 | 10 | 24.5 | 8.37 |
| June | 26.3 | 39.2 | 44 | 15.6 | 11.9 | 27.7 | 10 |
| July | 27.4 | 36.8 | 62 | 16.9 | 11.3 | 26.5 | 8.32 |
| August | 26.2 | 35.5 | 68 | 15.4 | 10.1 | 23.6 | 6.88 |
| September | 23.6 | 34.7 | 63 | 12.2 | 9.6 | 20.6 | 6.07 |
| October | 18 | 31.3 | 61 | 7.9 | 7.5 | 14.9 | 4.14 |
| November | 11.1 | 25 | 67 | 5.3 | 7 | 11.8 | 2.35 |
| December | 5.8 | 20.8 | 66 | 4.3 | 6.6 | 10.2 | 1.61 |
Analysis of ETo: The increased ETo values were due to the increased temperature, maximum sunshine time, and high wind speed from May to August. Wind speed was observed in July at an average peak value of 16.9 km/hr. For maximum sunshine hours which have accelerated ETo, high values of radiation were observed. Incoherent patterns with ETo resulted in differing months in the monthly averaged values of humidity. At the beginning and end of the year, the lower values for ETo were due to reduced temperatures, limited sunshine, and lower wind speeds. In December, the average minimum wind speed was 4.3 km/hr. Minimum sunlight duration, which contributed to minimum ETo as shown in Figure 9, was responsible for low radiation values (Table 1 and Figure 9).

Figure 9. Effect of climate parameters on ET0.
Effective rainfall
Effective rainfall is that fraction of the overall rainfall that substitutes or possibly reduces the respective net amount of irrigation water needed. The total mean rainfall in the area of study is 588 mm per annum whereas the mean effective rainfall in the area of study is 528 mm per annum. The mean rainfall is maximum in August which is 88.1 mm whereas the rainfall is minimum in November and December which is 18.4 and 18.6 mm respectively as shown in (Table 2).
| Month | Rainfall (mm) | Effective rainfall (mm) |
|---|---|---|
| January | 40 | 37.4 |
| February | 83.4 | 72.3 |
| March | 73.9 | 65.2 |
| April | 73.9 | 65.2 |
| May | 27.3 | 26.1 |
| June | 29.8 | 28.4 |
| July | 81.8 | 71.1 |
| August | 88.1 | 75.7 |
| September | 33.5 | 31.7 |
| October | 19.7 | 19.1 |
| November | 18.4 | 17.9 |
| December | 18.6 | 18 |
| Total | 588.4 | 528 |
Crop data
Crop data required to oblige the purposesallocated to this research are shown in the tables below for cultivated crops in the research area [14]. (Table 3). Table 3 shows the crop coefficient values and their corresponding crop height for various crops i.e wheat, millet, sorghum, and cotton crop (Table 4).
| Crop | Kc Initial | Kc mid | Kc end | Crop Height h (m) |
|---|---|---|---|---|
| Wheat | 0.55 | 1.15 | 0.32 | 1 |
| Millet | 0.3 | 1 | 0.3 | 1.5 |
| Sorghum | 0.3 | 1.1 | 0.55 | 1-2. |
| Crop | Length | Plant Date | ||||
|---|---|---|---|---|---|---|
| Initial | Development | Mid | Late | Total | ||
| Wheat | 25 | 35 | 65 | 40 | 165 | Oct/Nov |
| Millet | 15 | 25 | 40 | 25 | 105 | June |
| Sorghum | 20 | 30 | 40 | 30 | 120 | June |
Table 4 demonstrates the total length of growing crop periods, the length of each stage (initial, mid-season, development, and late-season) periods as well as their month of plantation for wheat, millet, sorghum, and cotton crops in the study area.
The Yield Response Factor (Ky) values for each growing phase (emergency, flowering stage, vegetative stage, ripening, and yield formation), rooting depth and depletion fraction for wheat, millet, sorghum, and cotton are given in (Table 5) [19].
| Crop | Depth of Root (m) | Yield Response factor (Ky) | Depletion Fraction (P) | ||||
|---|---|---|---|---|---|---|---|
| Wheat | 1.5-1.8 | 1 | 0.2 | 0.6 | 0.5 | 0.5 | 0.55 |
| Millet | 1.0-2.0 | 1 | 0.2 | 0.6 | 0.5 | 0.5 | 0.55 |
| Sorghum | 1.0-2.0 | 1.25 | 0.4 | 1.5 | 0.5 | 0.2 | 0.55 |
A mathematicalguesstimate for correctingp for ETc rate is p = p Table 22 + 0.04 (5 - ETc) wherever the adjusted p is restricted to 0.1 <= p <= 0.8 and ETc is in millimeter (mm)/day.
Soil data
According to different researchers, the area of research is covered by loam-type soils; the table below shows the fundamental infiltration rate and water existing in various soil textures, essential as data of soil in a CROPWAT model. The loam soil has available water vary from 100-175 mm/mm whereas its fundamental infiltration rate varies from 10-20 mm/hr. A value of 100 mm/m and 240 mm/day is selected for the analysis [20] (Tables 6 and 7).
| Soil Texture | Available Water (AW) (mm/m) |
|---|---|
| Coarse Sands | 20-65 |
| Fine Sands | 60-85 |
| Loam | 100-175 |
| Sandy Loams | 90-130 |
| Fine Sandy Loam | 100-170 |
| Loamy Sands | 65-110 |
| Silty Clay Loam | 130-160 |
| Silty Clay | 125-170 |
| Silt Loams | 150-230 |
| Clay | 110-150 |
| Peats and Mucks | 160-240 |
| Soil type | Basic infiltration rate (mm/hr) |
|---|---|
| Sand | < 30 |
| sandy loam | 20 - 30 |
| Loam | 10-20 |
| clay loam | 5-10 |
| Clay | 1-5 |
Total crop water requirement
The overall water needed for various crops in the area of study is existing in table 11. The average water needed for the wheat crop was 443.7 mm/ period. The average water needed for millet was 578.1mm/period. The average water needed for sorghum was 690.2 mm/period. From this, it is concluded that CWR for
Wheat < Millet < Sorghum
The results have shown that for crops with long growing seasons, the crop and reference evaporations (ETcand ETO) were higher than those with shorter growing seasons. Throughout the dry season, ETC was greater than during the rainy season [21].
Net irrigation requirement
It is distinct from the CWR. NIR is the irrigation water provided to a field to ensure the crop receives its entire CWR and no water losses in the irrigation process. The NIR for various crops is presented in the table. The NIR for wheat, millet, and sorghumcropsare 177, 383, and 484 mm per season respectively. The NIR for Sorghum > Millet > Wheat.
The greater value of NIR illustrates that the effective rainfall availability is small (Table 8 and Figure 10).
| Month | Decade | Stage | Kc (coefficient) | ETc (mm/day) | ETc (mm/decade) | Eff. Rainfall (mm/decade) | Irrigation Req. (mm/decade) | |
|---|---|---|---|---|---|---|---|---|
| Nov | 2 | Initial | 0.55 | 1.23 | 7.4 | 3.5 | 4.5 | |
| Nov | 3 | Initial | 0.55 | 1.12 | 11.2 | 5.9 | 5.3 | |
| Dec | 1 | Develop | 0.55 | 1.02 | 10.2 | 5.4 | 4.9 | |
| Dec | 2 | Develop | 0.67 | 1.07 | 10.7 | 5.1 | 5.6 | |
| Dec | 3 | Develop | 0.85 | 1.4 | 15.4 | 7.6 | 7.9 | |
| Jan | 1 | Develop | 1.04 | 1.75 | 17.5 | 9.9 | 7.6 | |
| Jan | 2 | Mid | 1.16 | 2 | 20 | 11.8 | 8.3 | |
| Jan | 3 | Mid | 1.17 | 2.4 | 26.4 | 15.9 | 10.5 | |
| Feb | 1 | Mid | 1.17 | 2.79 | 27.9 | 21.5 | 6.4 | |
| Feb | 2 | Mid | 1.17 | 3.18 | 31.8 | 26 | 5.8 | |
| Feb | 3 | Mid | 1.17 | 3.68 | 29.4 | 24.6 | 4.8 | |
| Mar | 1 | Mid | 1.17 | 4.18 | 41.8 | 22.3 | 19.5 | |
| Mar | 2 | Late | 1.17 | 4.67 | 46.7 | 21.4 | 25.3 | |
| Mar | 3 | Late | 1.02 | 4.68 | 51.5 | 21.5 | 29.9 | |
| Apr | 1 | Late | 0.8 | 4.12 | 41.2 | 22.9 | 18.2 | |
| Apr | 2 | Late | 0.59 | 3.36 | 33.6 | 23.5 | 10.1 | |
| Apr | 3 | Late | 0.39 | 2.61 | 20.9 | 14.9 | 2.3 | |
| 443.7 | 263.8 | 176.8 | ||||||
| Month | Decade | Stage | Kc (coefficient) | ETc (mm/day) | ETc (mm/decade) | Eff. Rainfall (mm/decade) | Irrigation Req. (mm/decade) |
|---|---|---|---|---|---|---|---|
| June | 2 | Initial | 0.3 | 3.12 | 18.7 | 4.5 | 14.9 |
| June | 3 | Develop | 0.3 | 2.94 | 29.4 | 12.9 | 16.5 |
| July | 1 | Develop | 0.49 | 4.34 | 43.4 | 20.2 | 23.3 |
| July | 2 | Develop | 0.78 | 6.49 | 64.9 | 25.5 | 39.4 |
| July | 3 | Mid | 1.01 | 7.93 | 87.3 | 25.4 | 61.9 |
| Aug | 1 | Mid | 1.03 | 7.56 | 75.6 | 26.2 | 49.4 |
| Aug | 2 | Mid | 1.03 | 7.07 | 70.7 | 27.5 | 43.2 |
| Aug | 3 | Mid | 1.03 | 6.79 | 74.7 | 21.8 | 52.9 |
| Sep | 1 | Late | 0.92 | 5.91 | 59.1 | 14.5 | 44.7 |
| Sep | 2 | Late | 0.63 | 3.92 | 39.2 | 9.1 | 30.1 |
| Sep | 3 | Late | 0.39 | 2.13 | 14.9 | 5.7 | 6.7 |
| 578.1 | 193.4 | 382.9 |
| Month | Decade | Stage | Kc (coefficient) | ETc (mm/day) | ETc (mm/decade) | Eff. Rainfall (mm/decade) | Irrigation Req. (mm/decade) |
|---|---|---|---|---|---|---|---|
| June | 2 | Initial | 0.3 | 3.12 | 31.2 | 7.6 | 23.6 |
| June | 3 | Initial | 0.3 | 2.91 | 29.1 | 12.9 | 16.2 |
| July | 1 | Develop | 0.45 | 4.01 | 40.1 | 20.2 | 19.9 |
| July | 2 | Develop | 0.73 | 6.04 | 60.4 | 25.5 | 34.9 |
| July | 3 | Mid | 1.01 | 7.93 | 87.2 | 25.4 | 61.8 |
| Aug | 1 | Mid | 1.12 | 8.27 | 82.7 | 26.2 | 56.5 |
| Aug | 2 | Mid | 1.12 | 7.73 | 77.3 | 27.5 | 49.9 |
| Aug | 3 | Mid | 1.12 | 7.43 | 81.7 | 21.8 | 59.9 |
| Sep | 1 | Late | 1.12 | 7.17 | 71.7 | 14.5 | 57.2 |
| Sep | 2 | Late | 0.98 | 6.07 | 60.7 | 9.1 | 51.6 |
| Sep | 3 | Late | 0.8 | 4.38 | 43.8 | 8.2 | 35.7 |
| Oct | 1 | Late | 0.63 | 3.02 | 24.1 | 5.9 | 16.7 |
| 690.2 | 204.8 | 483.8 |
| Crops Name | Wheat | Millet | Sorghum |
|---|---|---|---|
| Planting Date | 15-Nov | 15-Jun | 11-Jun |
| Harvesting Date | 28-Apr | 27-Sep | 08-Oct |
| Period days | 165 | 105 | 120 |
| Eto (mm)/Period | 501.71 | 795.09 | 886.42 |
| Max, Kc | 1.17 | 1.03 | 1.12 |
| CWR (mm)/ Period | 443.7 | 578.1 | 690.2 |
| Rainfall (mm)/Period | 299.2 | 221.4 | 232.9 |
| Effective Rainfall (mm)/Period | 263.8 | 193.4 | 204.8 |
| NIR (mm) / period | 176.8 | 382.9 | 483.8 |
| Gross NIR (mm/period) 70% Eff | 252.57 | 547 | 691.14 |

Figure 10. The contrast of effective rainfall, IWR, and CWR for various crops.
Figure 10 shows Sorghum has the maximum consumption of water than the wheat and millet crop. This is due to less effective rainfall during their growth periods. The Crop Water Requirement for crops grown in summer is maximum due to high evapotranspiration. With the increase in CWR, an increase in IWR occurs [22].
Conclusions
It has been concluded from the study that by putting the meteorological data like Temperature (maximum and minimum), rainfall, wind speed, relative humidity, and sunshine hours into the CROPWAT model the Effective rainfall, Reference evapotranspiration, Irrigation water requirement, and Crop water requirement can be determined. CROPWAT is an easy, meaningful, and workable model for the assessment of Effective rainfall, Reference evapotranspiration, Irrigation water requirement, and Crop Water Requirement. The texture of soil from the research was loam. The available water was 100 mm/m whereas the infiltration rate of the study area was 10 mm/hr. Mean reference evapotranspiration for Peshawar was 5.16 mm/ day. The maximum ETo was in June which was 10.0 mm/day whereas the minimum value of ETo in December was 1.62 mm/day. Effective rainfall of 75.7 mm was maximum in August while a minimum of 17.9 mm in November. The average water needed for the wheat, millet, and sorghumcrop was 443.7, 578.1, and 690.2 mm/period respectively. The irrigation water requirement for wheat, millet, and sorghumcrops is 177, 383, and 484 mm per season respectively. From this, it is concluded the CWR and IWR for Sorghum > Millet > Wheat. CWR and IWR for crops grown in summer are greater than that for crops grown in the winter season. This increase in demand is due to the higher evapotranspiration in summer and less effective rainfall.
Recommendations
• Since this analysis is focused on 17 years of meteorological data. It is suggested that greater accuracy and reliability be achieved for a minimum of 30 years.
• Identical research can be conducted using the different models in several climactic locations.
• The results of this research can be correlated with evaluation models.
• While the CROPWAT model provides a sensible approximation for CWR and IWR, it will be assessed in the research area for even more reliable results.
Irrigation & Drainage Systems Engineering received 835 citations as per Google Scholar report


